Reports
Sale

Global Drilling Fluids Market Size, Report: By Type: Bentonite, Barite, Xanthan Gum, Potassium Chloride, Caustic Soda, Soda Ash; Regional Analysis; Market Dynamics: SWOT Analysis: Porter’s Five Forces Analysis; Key Indicators for Demand, Key Indicators for Price; Value Chain Analysis; Price Analysis; Competitive Landscape; 2024-2032
Global Drilling Fluids Market Outlook
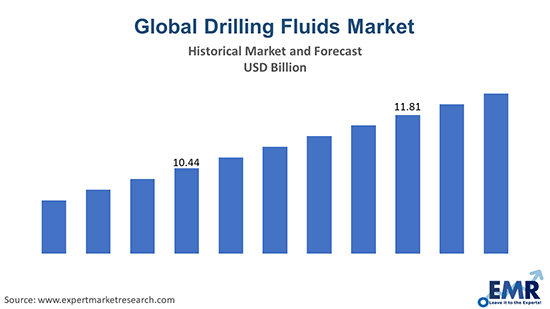
The global drilling fluids market is driven by the recovering oil price and an increase in the frequency of drilling operations in the key regions. The global drilling fluids market reached a value of almost USD 10.45 billion in 2023. The drilling fluids industry is further expected to grow at a CAGR of 2.6% between 2024 and 2032 to reach a value of almost USD 13.15 billion by 2032.
Read more about this report - REQUEST FREE SAMPLE COPY IN PDF
The global drilling fluids market is supported by an increase in the demand from North America, due to resuming production of shale wells in the forecast period. North America and the Middle East are the high maturity markets in the industry, whereas the Asia Pacific and Latin America are the medium maturity markets for the same. The largest consumers of drilling fluids regionally are the United States and the Asia Pacific. The United States contributes to 42% of the global supply. It continues to be the largest consumer in the industry due to the continued activity of drilling and extraction from shale or tight formation. The demand for drilling fluid in Australia is expected to increase due to the stabilising oil and gas prices as the country has one of the largest shale gas reserves in the world.
Fluctuations in crude oil prices affect the prices of drilling fluid adversely. Rig count also determines the price of drilling fluids. The demand for drilling fluids from Australia is increasing due to an increased rig count in the past few years, led by explorations taking place in the industry.
Properties and Applications
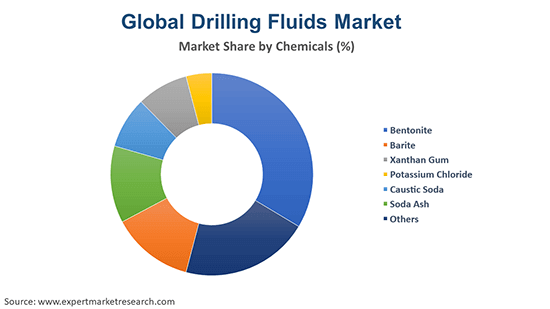
Drilling fluids are chemical components used in the extraction of gas and oil. Based on chemicals, the drilling fluids industry is segmented into:
Read more about this report - REQUEST FREE SAMPLE COPY IN PDF
- Bentonite
- Barite
- Xanthan Gum
- Potassium Chloride
- Caustic Soda
- Soda Ash
- Others
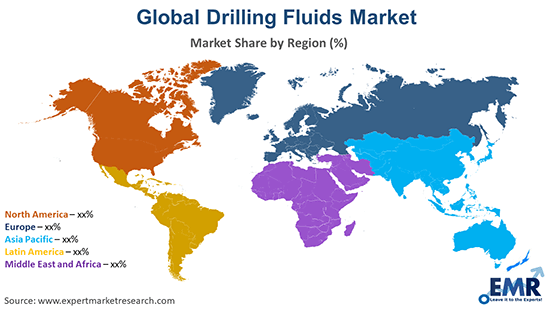
The report also covers the regional markets of the product like North America, Europe, the Asia Pacific, Latin America, and the Middle East and Africa.
Read more about this report - REQUEST FREE SAMPLE COPY IN PDF
Market Analysis
The global drilling fluids market is driven by the growing number of drilling operations and recovering oil prices. In the Asia Pacific, India and Australia have witnessed continued performance of drilling operations despite having low crude prices. Future demand for drilling fluids is expected to rise, propelling the industry further. The drilling fluids help in eliminating cutting from the formation, along with smooth drilling operation and completion. The drilling fluids market size runs parallel to the drilling operations across the region.
The industry for bentonite is expected to increase owing to the increase in the foundry and metal casting application in the automotive and oil and gas industry, invigorating the industry growth for bentonite. The industry is also expected to be encouraged by the increasing environmental concerns associated with wastewater treatment due to high toxic content and radioactive chemicals.
The supply of barite, on the other hand, highly corresponds to the oil and gas prices, as the use of barite in drilling fluids represents the single largest consuming industry. The demand for barite is expected to increase due to the improvement in oil prices and shale gas drilling in the United States. China has set out to achieve the production of 30 billion cubic metres of gas by drilling more shale gas wells by the year 2021, which will increase the domestic consumption and decrease the availability of barite for exports.
Xanthan gum helps in reducing water viscosity in various applications. The demand for xanthan gum is expected to increase due to its usage in the food and oil and gas industries, providing impetus to the industry growth. The xanthan gum demand is expected to remain rapid due to the supportive European and the United States administrations, encouraging the use of the chemical in the form of stabiliser, emulsifier, thickener, and gelling agent.
The production of caustic potash is expected to continue to increase in the United States, as it offers lower energy costs than the other western regions. The utilisation rate is expected to increase in the United States, further boosting the supply in the region. In the forecast period, few capacity additions are predicted for caustic potash, especially in the Asia Pacific region, keeping the export market in focus.
Competitive Landscape
The report gives a detailed analysis of the following key players in the global drilling fluids market, covering their competitive landscape, capacity, and latest developments like mergers, acquisitions, and investments, expansions of capacity, and plant turnarounds:
- Solvay S.A.
- Ecolab Inc.
- Newpark Resources, Inc.
- Baker Hughes Company
- BASF SE
- Halliburton Energy Services, Inc.
- Others
The comprehensive EMR report provides an in-depth assessment of the industry based on Porter's five forces model, along with giving a SWOT analysis.
Key Highlights of the Report
| REPORT FEATURES | DETAILS |
| Base Year | 2023 |
| Historical Period | 2018-2023 |
| Forecast Period | 2024-2032 |
| Scope of the Report |
Historical and Forecast Trends, Industry Drivers and Constraints, Historical and Forecast Market Analysis by Segment:
|
| Breakup by Type of Chemicals |
|
| Breakup by Region |
|
| Market Dynamics |
|
| Competitive Landscape |
|
| Companies Covered |
|
| Report Price and Purchase Option | Explore our purchase options that are best suited to your resources and industry needs. |
| Delivery Format | Delivered as an attached PDF and Excel through email, with an option of receiving an editable PPT, according to the purchase option. |
*At Expert Market Research, we strive to always give you current and accurate information. The numbers depicted in the description are indicative and may differ from the actual numbers in the final EMR report.
1 Preface
2 Report Coverage – Key Segmentation and Scope
3 Report Description
3.1 Market Definition and Outlook
3.2 Properties and Applications
3.3 Market Analysis
3.4 Key Players
4 Key Assumptions
5 Executive Summary
5.1 Overview
5.2 Key Drivers
5.3 Key Developments
5.4 Competitive Structure
5.5 Key Industrial Trends
6 Snapshot
6.1 Global
6.2 Regional
7 Industry Opportunities and Challenges
8 Global Drilling Fluids Market Analysis
8.1 Key Industry Highlights
8.2 Global Drilling Fluids Historical Market (2018-2023)
8.3 Global Drilling Fluids Market Forecast (2024-2032)
8.4 Global Drilling Fluids Market by Types
8.4.1 Bentonite
8.4.1.1 Market Share
8.4.1.2 Historical Trend (2018-2023)
8.4.1.3 Forecast Trend (2024-2032)
8.4.1.4 Breakup by Application
8.4.1.4.1 Foundry Sands
8.4.1.4.1.1 Market Share
8.4.1.4.1.2 Historical Trend (2018-2023)
8.4.1.4.1.3 Forecast Trend (2024-2032)
8.4.1.4.2 Pet Products
8.4.1.4.2.1 Market Share
8.4.1.4.2.2 Historical Trend (2018-2023)
8.4.1.4.2.3 Forecast Trend (2024-2032)
8.4.1.4.3 Iron Ore Pelletizing
8.4.1.4.3.1 Market Share
8.4.1.4.3.2 Historical Trend (2018-2023)
8.4.1.4.3.3 Forecast Trend (2024-2032)
8.4.1.4.4 Drilling Mud
8.4.1.4.4.1 Market Share
8.4.1.4.4.2 Historical Trend (2018-2023)
8.4.1.4.4.3 Forecast Trend (2024-2032)
8.4.1.4.5 Construction
8.4.1.4.5.1 Market Share
8.4.1.4.5.2 Historical Trend (2018-2023)
8.4.1.4.5.3 Forecast Trend (2024-2032)
8.4.1.4.6 Paper
8.4.1.4.6.1 Market Share
8.4.1.4.6.2 Historical Trend (2018-2023)
8.4.1.4.6.3 Forecast Trend (2024-2032)
8.4.1.4.7 Others
8.4.2 Barite
8.4.2.1 Market Share
8.4.2.2 Historical Trend (2018-2023)
8.4.2.3 Forecast Trend (2024-2032)
8.4.2.4 Breakup by Application
8.4.2.4.1 Drilling Fluids
8.4.2.4.1.1 Market Share
8.4.2.4.1.2 Historical Trend (2018-2023)
8.4.2.4.1.3 Forecast Trend (2024-2032)
8.4.2.4.2 Rubber and Plastics
8.4.2.4.2.1 Market Share
8.4.2.4.2.2 Historical Trend (2018-2023)
8.4.2.4.2.3 Forecast Trend (2024-2032)
8.4.2.4.3 Pharmaceuticals
8.4.2.4.3.1 Market Share
8.4.2.4.3.2 Historical Trend (2018-2023)
8.4.2.4.3.3 Forecast Trend (2024-2032)
8.4.2.4.4 Others
8.4.3 Xanthan Gum
8.4.3.1 Market Share
8.4.3.2 Historical Trend (2018-2023)
8.4.3.3 Forecast Trend (2024-2032)
8.4.3.4 Breakup by Type
8.4.3.4.1 Food and Beverages
8.4.3.4.1.1 Market Share
8.4.3.4.1.2 Historical Trend (2018-2023)
8.4.3.4.1.3 Forecast Trend (2024-2032)
8.4.3.4.2 Oil and Gas
8.4.3.4.2.1 Market Share
8.4.3.4.2.2 Historical Trend (2018-2023)
8.4.3.4.2.3 Forecast Trend (2024-2032)
8.4.3.4.3 Pharmaceutical
8.4.3.4.3.1 Market Share
8.4.3.4.3.2 Historical Trend (2018-2023)
8.4.3.4.3.3 Forecast Trend (2024-2032)
8.4.3.4.4 Cosmetics
8.4.3.4.4.1 Market Share
8.4.3.4.4.2 Historical Trend (2018-2023)
8.4.3.4.4.3 Forecast Trend (2024-2032)
8.4.3.4.5 Others
8.4.4 Potassium Chloride
8.4.4.1 Market Share
8.4.4.2 Historical Trend (2018-2023)
8.4.4.3 Forecast Trend (2024-2032)
8.4.4.4 Breakup by Application
8.4.4.4.1 Fertilizer
8.4.4.4.1.1 Market Share
8.4.4.4.1.2 Historical Trend (2018-2023)
8.4.4.4.1.3 Forecast Trend (2024-2032)
8.4.4.4.2 Industrial
8.4.4.4.2.1 Market Share
8.4.4.4.2.2 Historical Trend (2018-2023)
8.4.4.4.2.3 Forecast Trend (2024-2032)
8.4.4.4.3 Pharmaceutical
8.4.4.4.3.1 Market Share
8.4.4.4.3.2 Historical Trend (2018-2023)
8.4.4.4.3.3 Forecast Trend (2024-2032)
8.4.4.4.4 Others
8.4.5 Caustic Soda
8.4.5.1 Market Share
8.4.5.2 Historical Trend (2018-2023)
8.4.5.3 Forecast Trend (2024-2032)
8.4.5.4 Breakup by Application
8.4.5.4.1 Flat Glass
8.4.5.4.1.1 Market Share
8.4.5.4.1.2 Historical Trend (2018-2023)
8.4.5.4.1.3 Forecast Trend (2024-2032)
8.4.5.4.2 Container Glass
8.4.5.4.2.1 Market Share
8.4.5.4.2.2 Historical Trend (2018-2023)
8.4.5.4.2.3 Forecast Trend (2024-2032)
8.4.5.4.3 Other Glass
8.4.5.4.3.1 Market Share
8.4.5.4.3.2 Historical Trend (2018-2023)
8.4.5.4.3.3 Forecast Trend (2024-2032)
8.4.5.4.4 Soaps and Detergents
8.4.5.4.4.1 Market Share
8.4.5.4.4.2 Historical Trend (2018-2023)
8.4.5.4.4.3 Forecast Trend (2024-2032)
8.4.5.4.5 Chemicals
8.4.5.4.5.1 Market Share
8.4.5.4.5.2 Historical Trend (2018-2023)
8.4.5.4.5.3 Forecast Trend (2024-2032)
8.4.5.4.6 Oil and Gas
8.4.5.4.6.1 Market Share
8.4.5.4.6.2 Historical Trend (2018-2023)
8.4.5.4.6.3 Forecast Trend (2024-2032)
8.4.5.4.7 Alumina
8.4.5.4.7.1 Market Share
8.4.5.4.7.2 Historical Trend (2018-2023)
8.4.5.4.7.3 Forecast Trend (2024-2032)
8.4.5.4.8 Others
8.4.6 Soda Ash
8.4.6.1 Market Share
8.4.6.2 Historical Trend (2018-2023)
8.4.6.3 Forecast Trend (2024-2032)
8.4.6.4 Breakup by Application
8.4.6.4.1 Flat Glass
8.4.6.4.1.1 Market Share
8.4.6.4.1.2 Historical Trend (2018-2023)
8.4.6.4.1.3 Forecast Trend (2024-2032)
8.4.6.4.2 Container Glass
8.4.6.4.2.1 Market Share
8.4.6.4.2.2 Historical Trend (2018-2023)
8.4.6.4.2.3 Forecast Trend (2024-2032)
8.4.6.4.3 Other Glass
8.4.6.4.3.1 Market Share
8.4.6.4.3.2 Historical Trend (2018-2023)
8.4.6.4.3.3 Forecast Trend (2024-2032)
8.4.6.4.4 Soaps and Detergents
8.4.6.4.4.1 Market Share
8.4.6.4.4.2 Historical Trend (2018-2023)
8.4.6.4.4.3 Forecast Trend (2024-2032)
8.4.6.4.5 Chemicals
8.4.6.4.5.1 Market Share
8.4.6.4.5.2 Historical Trend (2018-2023)
8.4.6.4.5.3 Forecast Trend (2024-2032)
8.4.6.4.6 Oil and Gas
8.4.6.4.6.1 Market Share
8.4.6.4.6.2 Historical Trend (2018-2023)
8.4.6.4.6.3 Forecast Trend (2024-2032)
8.4.6.4.7 Alumina
8.4.6.4.7.1 Market Share
8.4.6.4.7.2 Historical Trend (2018-2023)
8.4.6.4.7.3 Forecast Trend (2024-2032)
8.4.6.4.8 Others
8.5 Global Drilling Fluids Market by Region
8.5.1 Market Share
8.5.1.1 North America
8.5.1.2 Europe
8.5.1.3 Asia Pacific
8.5.1.4 Latin America
8.5.1.5 Middle East and Africa
9 Regional Analysis
9.1 North America
9.1.1 Historical Trend (2018-2023)
9.1.2 Forecast Trend (2024-2032)
9.1.3 Breakup by Country
9.1.3.1 United States of America
9.1.3.2 Canada
9.2 Europe
9.2.1 Historical Trend (2018-2023)
9.2.2 Forecast Trend (2024-2032)
9.2.3 Breakup by Country
9.2.3.1 United Kingdom
9.2.3.2 Germany
9.2.3.3 France
9.2.3.4 Italy
9.2.3.5 Others
9.3 Asia Pacific
9.3.1 Historical Trend (2018-2023)
9.3.2 Forecast Trend (2024-2032)
9.3.3 Breakup by Country
9.3.3.1 China
9.3.3.2 Japan
9.3.3.3 India
9.3.3.4 ASEAN
9.3.3.5 Australia
9.3.3.6 Others
9.4 Latin America
9.4.1 Historical Trend (2018-2023)
9.4.2 Forecast Trend (2024-2032)
9.4.3 Breakup by Country
9.4.3.1 Brazil
9.4.3.2 Argentina
9.4.3.3 Mexico
9.4.3.4 Others
9.5 Middle East and Africa
9.5.1 Historical Trend (2018-2023)
9.5.2 Forecast Trend (2024-2032)
9.5.3 Breakup by Country
9.5.3.1 Saudi Arabia
9.5.3.2 United Arab Emirates
9.5.3.3 Nigeria
9.5.3.4 South Africa
9.5.3.5 Others
10 Market Dynamics
10.1 SWOT Analysis
10.1.1 Strengths
10.1.2 Weaknesses
10.1.3 Opportunities
10.1.4 Threats
10.2 Porter’s Five Forces Analysis
10.2.1 Supplier’s Power
10.2.2 Buyer’s Power
10.2.3 Threat of New Entrants
10.2.4 Degree of Rivalry
10.2.5 Threat of Substitutes
10.3 Key Indicators for Demand
10.4 Key Indicators for Price
11 Value Chain Analysis
12 Trade Data Analysis (HS Code – 281511, 251110, 250810, 310420, 283620)
12.1 Major Importing Countries
12.1.1 By Value
12.1.2 By Volume
12.2 Major Exporting Countries
12.2.1 By Value
12.2.2 By Volume
13 Price Analysis
13.1 Bentonite Historical Price Trends (2018-2023) and Forecast (2024-2032)
13.2 Barite Historical Price Trends (2018-2023) and Forecast (2024-2032)
13.3 Xanthan Gum Historical Price Trends (2018-2023) and Forecast (2024-2032)
13.4 Potassium Chloride Historical Price Trends (2018-2023) and Forecast (2024-2032)
13.5 Caustic Soda Historical Price Trends (2018-2023) and Forecast (2024-2032)
13.6 Soda Ash Historical Price Trends (2018-2023) and Forecast (2024-2032)
14 Environmental Regulations
15 Competitive Landscape
15.1 Market Structure
15.2 Company Profiles
15.2.1 Solvay S.A.
15.2.1.1 Company Overview
15.2.1.2 Product Portfolio
15.2.1.3 Demographic Reach and Achievements
15.2.1.4 Certifications
15.2.2 Ecolab Inc.
15.2.2.1 Company Overview
15.2.2.2 Product Portfolio
15.2.2.3 Demographic Reach and Achievements
15.2.2.4 Certifications
15.2.3 Newpark Resources, Inc.
15.2.3.1 Company Overview
15.2.3.2 Product Portfolio
15.2.3.3 Demographic Reach and Achievements
15.2.3.4 Certifications
15.2.4 Baker Hughes Company
15.2.4.1 Company Overview
15.2.4.2 Product Portfolio
15.2.4.3 Demographic Reach and Achievements
15.2.4.4 Certifications
15.2.5 BASF SE
15.2.5.1 Company Overview
15.2.5.2 Product Portfolio
15.2.5.3 Demographic Reach and Achievements
15.2.5.4 Certifications
15.2.6 Halliburton Energy Services, Inc.
15.2.6.1 Company Overview
15.2.6.2 Product Portfolio
15.2.6.3 Demographic Reach and Achievements
15.2.6.4 Certifications
15.2.7 Others
16 Industry Events and Developments
List of Key Figures and Tables
1. Global Drilling Fluids Market: Key Industry Highlights, 2018 and 2032
2. Global Drilling Fluids Historical Market: Breakup by Types of Chemicals (USD Billion), 2018-2023
3. Global Drilling Fluids Market Forecast: Breakup by Types of Chemicals (USD Billion), 2024-2032
4. Global Bentonite Historical Market: Breakup by Application (USD Billion), 2018-2023
5. Global Bentonite Market Forecast: Breakup by Application (USD Billion), 2024-2032
6. Global Barite Historical Market: Breakup by Application (USD Billion), 2018-2023
7. Global Barite Market Forecast: Breakup by Application (USD Billion), 2024-2032
8. Global Xanthan Gum Historical Market: Breakup by Application (USD Billion), 2018-2023
9. Global Xanthan Gum Market Forecast: Breakup by Application (USD Billion), 2024-2032
10. Global Potassium Chloride Historical Market: Breakup by Application (USD Billion), 2018-2023
11. Global Potassium Chloride Market Forecast: Breakup by Application (USD Billion), 2024-2032
12. Global Caustic Soda Historical Market: Breakup by Application (USD Billion), 2018-2023
13. Global Caustic Soda Market Forecast: Breakup by Application (USD Billion), 2024-2032
14. Global Soda Ash Historical Market: Breakup by Application (USD Billion), 2018-2023
15. Global Soda Ash Market Forecast: Breakup by Application (USD Billion), 2024-2032
16. Global Drilling Fluids Historical Market: Breakup by Region (USD Billion), 2018-2023
17. Global Drilling Fluids Market Forecast: Breakup by Region (USD Billion), 2024-2032
18. North America Global Drilling Fluids Historical Market: Breakup by Country (USD Billion), 2018-2023
19. North America Global Drilling Fluids Market Forecast: Breakup by Country (USD Billion), 2024-2032
20. Europe Global Drilling Fluids Historical Market: Breakup by Country (USD Billion), 2018-2023
21. Europe Global Drilling Fluids Market Forecast: Breakup by Country (USD Billion), 2024-2032
22. Asia Pacific Global Drilling Fluids Historical Market: Breakup by Country (USD Billion), 2018-2023
23. Asia Pacific Global Drilling Fluids Market Forecast: Breakup by Country (USD Billion), 2024-2032
24. Latin America Global Drilling Fluids Historical Market: Breakup by Country (USD Billion), 2018-2023
25. Latin America Global Drilling Fluids Market Forecast: Breakup by Country (USD Billion), 2024-2032
26. Middle East and Africa Global Drilling Fluids Historical Market: Breakup by Country (USD Billion), 2018-2023
27. Middle East and Africa Global Drilling Fluids Market Forecast: Breakup by Country (USD Billion), 2024-2032
28. Major Exporting Countries by Value
29. Major Importing Countries by Value
30. Major Exporting Countries by Volume
31. Major Importing Countries by Volume
32. Bentonite Historical Price Trends and Forecast (2018-2028)
33. Barite Historical Price Trends and Forecast (2018-2028)
34. Xanthan Gum Historical Price Trends and Forecast (2018-2028)
35. Potassium Chloride Historical Price Trends and Forecast (2018-2028)
36. Caustic Soda Historical Price Trends and Forecast (2018-2028)
37. Soda Ash Historical Price Trends and Forecast (2018-2028)
38. Global Drilling Fluids Market Structure
Key Questions Answered in the Report
In 2023, the market attained a value of approximately USD 10.45 billion.
The market is projected to grow at a CAGR of 2.6% between 2024 and 2032.
The market is estimated to witness a healthy growth in the forecast period of 2024-2032 to reach around USD 13.15 billion by 2032.
The major drivers of the market are recovering oil price, increasing frequency of drilling operations, and growing rig count.
The key trends guiding the growth of the market include the increasing environmental concerns associated with wastewater treatment and rising concern towards handling solid waste.
The major regions in the market are North America, Latin America, the Middle East and Africa, Europe, and the Asia Pacific.
Bentonite, barite, xanthan gum, potassium chloride, caustic soda, and soda ash are the leading types in the global drilling fluids market.
The major players in the market are Solvay S.A., Ecolab Inc., Newpark Resources, Inc., Baker Hughes Company, BASF SE, and Halliburton Energy Services, Inc., among others.
Analyst Review
The global drilling fluids market attained a value of USD 10.45 billion in 2023, driven by the increasing frequency of drilling operations. Aided by the increasing rig count, the market is expected to witness a further growth in the forecast period of 2024-2032, growing at a CAGR of 2.6%. The market is projected to reach USD 13.15 billion by 2032.
EMR’s meticulous research methodology delves deep into the market, covering the macro and micro aspects of the industry. Based on types, the industry can be segmented into bentonite, barite, xanthan gum, potassium chloride, caustic soda, and soda ash. The major regional markets for drilling fluids are North America, Europe, the Asia Pacific, Latin America, and the Middle East and Africa. The key players in the above market include Solvay S.A., Ecolab Inc., Newpark Resources, Inc., Baker Hughes Company, BASF SE, and Halliburton Energy Services, Inc., among others.
EMR’s research methodology uses a combination of cutting-edge analytical tools and the expertise of their highly accomplished team, thus, providing their customers with market insights that are accurate, actionable, and help them remain ahead of their competition.
Purchase Options 10% off


Call us
Purchase Full Report
Mini Report
$ 2199
$1999
-
Selected Sections, One User
-
Printing Not Allowed
-
Email Delivery in PDF
-
Free Limited Customisation -
Post Sales Analyst Support -
50% Discount on Next Update
Single User License
$ 3299
$2999
-
All Sections, One User
-
One Print Allowed
-
Email Delivery in PDF
-
Free Limited Customisation -
Post Sales Analyst Support -
50% Discount on Next Update

Five User License
$ 4399
$3999
-
All Sections, Five Users
-
Five Prints Allowed
-
Email Delivery in PDF
-
Free Limited Customisation
-
Post Sales Analyst Support
-
50% Discount on Next Update
Corporate License
$ 5499
$4999
-
All Sections, Unlimited Users
-
Unlimited Prints Allowed
-
Email Delivery in PDF + Excel
-
Free Limited Customisation
-
Post Sales Analyst Support
-
50% Discount on Next Update
Any Question? Speak With An Analyst
View A Sample
Did You Miss Anything, Ask Now
Why Expert Market Research?
Right People
We are technically excellent, strategic, practical, experienced and efficient; our analysts are hand-picked based on having the right attributes to work successfully and execute projects based on your expectations.
Right Methodology
We leverage our cutting-edge technology, our access to trusted databases, and our knowledge of the current models used in the market to deliver you research solutions that are tailored to your needs and put you ahead of the curve.
Right Price
We deliver in-depth and superior quality research in prices that are reasonable, unmatchable, and shows our understanding of your resource structure. We, additionally, offer attractive discounts on our upcoming reports.
Right Support
Our team of expert analysts are at your beck and call to deliver you optimum results that are customised to meet your precise needs within the specified timeframe and help you form a better understanding of the industry.
NEWSLETTER