Reports
Sale

Global Non-magnetic Metals and Alloys Market Size, Growth: By Product Type: Non-Magnetic Metals, Precious Metals, Exotic or Rare Metals; By Application: Aerospace, Industrial Gas and Turbine, Automotive, Electrical and Electronics, Chemical, Others; Regional Analysis; Market Dynamics; Competitive Landscape; 2024-2032
Global Non-Magnetic Metals and Alloys Market Outlook
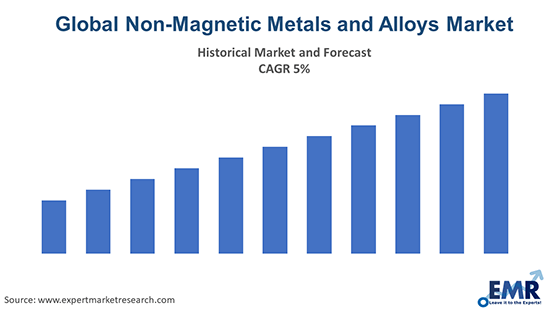
The global non-magnetic metals and alloys market is expected to grow at a CAGR of about 5% in the forecast period of 2024-2032.
Read more about this report - REQUEST FREE SAMPLE COPY IN PDF
North America Leading the Global Market for Non-Magnetic Metals and Alloys
North America has the largest share in the global non-magnetic metals and alloys industry. In terms of global non-magnetic metals and alloys industry, Europe holds the second largest market, followed by Japan, Asia Pacific, Middle East Africa, and then the rest of the world. Due to the rising aviation industry, Asia Pacific is expected to experience above average growth rates over the forecast period. The products are finding wide uses across different regions and industries, boosting the global demand and thus propelling the market growth.
Non-Magnetic Metals and Alloys: Market Segmentation
The Non-magnetic metals and alloys are those metals and alloys used as an alloy that are usually non-ferrous or have only a small quantity of metal. Aluminium, copper, lead, and zinc are major non-magnetic metals. Brass, titanium, beryllium, and nickel are other non-ferrous metals. In terms of mining and refining, they are usually more costly than ferrous metals. In general, these non-magnetic metals and alloys are light in weight, have improved conductivity, and non-magnetic props.

Read more about this report - REQUEST FREE SAMPLE COPY IN PDF
The product type can be divided into the following:
- Non-ferrous metals
- Aluminium
- Lead
- Tin
- Zinc
- Copper
- Nickel
- Titanium
- Others
- Precious Metals
- Gold
- Silver
- Platinum
- Others
- Exotic or Rare Metals
- Cobalt
- Mercury
- Tungsten
- Beryllium
- Bismuth
- Others
It finds wide applications in the following:
- Aerospace
- Industrial Gas and Turbine
- Automotive
- Electrical and Electronics
- Chemical
- Others
The regional markets for non-magnetic metals and alloys can be divided into North America, Europe, the Asia Pacific, Latin America, and the Middle East and Africa.
Read more about this report - REQUEST FREE SAMPLE COPY IN PDF
Rising End-Uses Bolstering the Market Growth
The global demand for non-magnetic metals and alloys is expected to be guided by the use of non-magnetic metals and their respective uses in various industries. The global market for non-magnetic metals and alloys is rising in demand because of the growth of the aviation industry and other transportation and structural materials. Non-magnetic metals and alloys including lead are highly used due to the growth of construction machinery, lead acid batteries, bullets, and radiation protectors. In the chemical processing industry, the demand for chemically inert and corrosion resistant corrosion products is expected to boost the growth in the coming years. Non-magnetic metals and alloys are also highly recyclable in nature, further encouraging the production of non-magnetic metals and alloys.
Key Industry Players in the Global Non-Magnetic Metals and Alloys Market
The report gives a detailed analysis of the following key players in the global non-magnetic metals and alloys market, covering their competitive landscape, capacity, and latest developments like mergers, acquisitions, and investments, expansions of capacity, and plant turnarounds:
- Belmont Metals Inc.
- Saru Smelting Pvt. Ltd.,
- Nippon Yakin Kogyo Co., Ltd.
- Australian Metals Pty Ltd
- Lee Kee Group Limited
- Gravita India Limited
- Others
The comprehensive EMR report provides an in-depth assessment of the market based on the Porter's five forces model along with giving a SWOT analysis.
Key Highlights of the Report
| REPORT FEATURES | DETAILS |
| Base Year | 2023 |
| Historical Period | 2018-2023 |
| Forecast Period | 2024-2032 |
| Scope of the Report |
Historical and Forecast Trends, Industry Drivers and Constraints, Historical and Forecast Market Analysis by Segment:
|
| Breakup by Product Type |
|
| Breakup by Application |
|
| Breakup by Region |
|
| Market Dynamics |
|
| Competitive Landscape |
|
| Companies Covered |
|
| Report Price and Purchase Option | Explore our purchase options that are best suited to your resources and industry needs. |
| Delivery Format | Delivered as an attached PDF and Excel through email, with an option of receiving an editable PPT, according to the purchase option. |
*At Expert Market Research, we strive to always give you current and accurate information. The numbers depicted in the description are indicative and may differ from the actual numbers in the final EMR report.
1 Preface
2 Report Coverage – Key Segmentation and Scope
3 Report Description
3.1 Market Definition and Outlook
3.2 Properties and Applications
3.3 Market Analysis
3.4 Key Players
4 Key Assumptions
5 Executive Summary
5.1 Overview
5.2 Key Drivers
5.3 Key Developments
5.4 Competitive Structure
5.5 Key Industrial Trends
6 Snapshot
6.1 Global
6.2 Regional
7 Opportunities and Challenges in the Market
8 Global Non-Magnetic Metals and Alloys Market Analysis
8.1 Key Industry Highlights
8.2 Global Non-Magnetic Metals and Alloys Historical Market (2018-2023)
8.3 Global Non-Magnetic Metals and Alloys Market Forecast (2024-2032)
8.4 Global Non-Magnetic Metals and Alloys Market by Product Type
8.4.1 Non-Magnetic Metals
8.4.1.1 Historical Trend (2018-2023)
8.4.1.2 Forecast Trend (2024-2032)
8.4.1.3 Breakup by Product Type
8.4.1.3.1 Aluminum
8.4.1.3.1.1 Historical Trend (2018-2023)
8.4.1.3.1.2 Forecast Trend (2024-2032)
8.4.1.3.2 Lead
8.4.1.3.2.1 Historical Trend (2018-2023)
8.4.1.3.2.2 Forecast Trend (2024-2032)
8.4.1.3.3 Tin
8.4.1.3.3.1 Historical Trend (2018-2023)
8.4.1.3.3.2 Forecast Trend (2024-2032)
8.4.1.3.4 Zinc
8.4.1.3.4.1 Historical Trend (2018-2023)
8.4.1.3.4.2 Forecast Trend (2024-2032)
8.4.1.3.5 Copper
8.4.1.3.5.1 Historical Trend (2018-2023)
8.4.1.3.5.2 Forecast Trend (2024-2032)
8.4.1.3.6 Nickel
8.4.1.3.6.1 Historical Trend (2018-2023)
8.4.1.3.6.2 Forecast Trend (2024-2032)
8.4.1.3.7 Titanium
8.4.1.3.7.1 Historical Trend (2018-2023)
8.4.1.3.7.2 Forecast Trend (2024-2032)
8.4.1.3.8 Others
8.4.2 Precious Metals
8.4.2.1 Historical Trend (2018-2023)
8.4.2.2 Forecast Trend (2024-2032)
8.4.2.3 Breakup by Product Type
8.4.2.3.1 Gold
8.4.2.3.1.1 Historical Trend (2018-2023)
8.4.2.3.1.2 Forecast Trend (2024-2032)
8.4.2.3.2 Silver
8.4.2.3.2.1 Historical Trend (2018-2023)
8.4.2.3.2.2 Forecast Trend (2024-2032)
8.4.2.3.3 Platinum
8.4.2.3.3.1 Historical Trend (2018-2023)
8.4.2.3.3.2 Forecast Trend (2024-2032)
8.4.2.3.4 Others
8.4.3 Exotic or Rare Metals
8.4.3.1 Historical Trend (2018-2023)
8.4.3.2 Forecast Trend (2024-2032)
8.4.3.3 Breakup by Product Type
8.4.3.3.1 Cobalt
8.4.3.3.1.1 Historical Trend (2018-2023)
8.4.3.3.1.2 Forecast Trend (2024-2032)
8.4.3.3.2 Mercury
8.4.3.3.2.1 Historical Trend (2018-2023)
8.4.3.3.2.2 Forecast Trend (2024-2032)
8.4.3.3.3 Tungsten
8.4.3.3.3.1 Historical Trend (2018-2023)
8.4.3.3.3.2 Forecast Trend (2024-2032)
8.4.3.3.4 Beryllium
8.4.3.3.4.1 Historical Trend (2018-2023)
8.4.3.3.4.2 Forecast Trend (2024-2032)
8.4.3.3.5 Bismuth
8.4.3.3.5.1 Historical Trend (2018-2023)
8.4.3.3.5.2 Forecast Trend (2024-2032)
8.4.3.3.6 Others
8.5 Global Non-Magnetic Metals and Alloys Market by Application
8.5.1 Aerospace
8.5.1.1 Historical Trend (2018-2023)
8.5.1.2 Forecast Trend (2024-2032)
8.5.2 Industrial Gas and Turbine
8.5.2.1 Historical Trend (2018-2023)
8.5.2.2 Forecast Trend (2024-2032)
8.5.3 Automotive
8.5.3.1 Historical Trend (2018-2023)
8.5.3.2 Forecast Trend (2024-2032)
8.5.4 Electrical and Electronics
8.5.4.1 Historical Trend (2018-2023)
8.5.4.2 Forecast Trend (2024-2032)
8.5.5 Chemical
8.5.5.1 Historical Trend (2018-2023)
8.5.5.2 Forecast Trend (2024-2032)
8.5.6 Others
8.6 Global Non-Magnetic Metals and Alloys Market by Region
8.6.1 North America
8.6.1.1 Historical Trend (2018-2023)
8.6.1.2 Forecast Trend (2024-2032)
8.6.2 Europe
8.6.2.1 Historical Trend (2018-2023)
8.6.2.2 Forecast Trend (2024-2032)
8.6.3 Asia Pacific
8.6.3.1 Historical Trend (2018-2023)
8.6.3.2 Forecast Trend (2024-2032)
8.6.4 Latin America
8.6.4.1 Historical Trend (2018-2023)
8.6.4.2 Forecast Trend (2024-2032)
8.6.5 Middle East and Africa
8.6.5.1 Historical Trend (2018-2023)
8.6.5.2 Forecast Trend (2024-2032)
9 North America Non-Magnetic Metals and Alloys Market Analysis
9.1 United States of America
9.1.1 Historical Trend (2018-2023)
9.1.2 Forecast Trend (2024-2032)
9.2 Canada
9.2.1 Historical Trend (2018-2023)
9.2.2 Forecast Trend (2024-2032)
10 Europe Non-Magnetic Metals and Alloys Market Analysis
10.1 United Kingdom
10.1.1 Historical Trend (2018-2023)
10.1.2 Forecast Trend (2024-2032)
10.2 Germany
10.2.1 Historical Trend (2018-2023)
10.2.2 Forecast Trend (2024-2032)
10.3 France
10.3.1 Historical Trend (2018-2023)
10.3.2 Forecast Trend (2024-2032)
10.4 Italy
10.4.1 Historical Trend (2018-2023)
10.4.2 Forecast Trend (2024-2032)
10.5 Others
11 Asia Pacific Non-Magnetic Metals and Alloys Market Analysis
11.1 China
11.1.1 Historical Trend (2018-2023)
11.1.2 Forecast Trend (2024-2032)
11.2 Japan
11.2.1 Historical Trend (2018-2023)
11.2.2 Forecast Trend (2024-2032)
11.3 India
11.3.1 Historical Trend (2018-2023)
11.3.2 Forecast Trend (2024-2032)
11.4 ASEAN
11.4.1 Historical Trend (2018-2023)
11.4.2 Forecast Trend (2024-2032)
11.5 Australia
11.5.1 Historical Trend (2018-2023)
11.5.2 Forecast Trend (2024-2032)
11.6 Others
12 Latin America Non- Magnetic Metals and Alloys Market Analysis
12.1 Brazil
12.1.1 Historical Trend (2018-2023)
12.1.2 Forecast Trend (2024-2032)
12.2 Argentina
12.2.1 Historical Trend (2018-2023)
12.2.2 Forecast Trend (2024-2032)
12.3 Mexico
12.3.1 Historical Trend (2018-2023)
12.3.2 Forecast Trend (2024-2032)
12.4 Others
13 Middle East and Africa Non-Magnetic Metals and Alloys Market Analysis
13.1 Saudi Arabia
13.1.1 Historical Trend (2018-2023)
13.1.2 Forecast Trend (2024-2032)
13.2 United Arab Emirates
13.2.1 Historical Trend (2018-2023)
13.2.2 Forecast Trend (2024-2032)
13.3 Nigeria
13.3.1 Historical Trend (2018-2023)
13.3.2 Forecast Trend (2024-2032)
13.4 South Africa
13.4.1 Historical Trend (2018-2023)
13.4.2 Forecast Trend (2024-2032)
13.5 Others
14 Market Dynamics
14.1 SWOT Analysis
14.1.1 Strengths
14.1.2 Weaknesses
14.1.3 Opportunities
14.1.4 Threats
14.2 Porter’s Five Forces Analysis
14.2.1 Supplier’s Power
14.2.2 Buyer’s Power
14.2.3 Threat of New Entrants
14.2.4 Degree of Rivalry
14.2.5 Threat of Substitutes
14.3 Key Indicators for Demand
14.4 Key Indicators for Price
15 Value Chain Analysis
16 Competitive Landscape
16.1 Market Structure
16.2 Company Profiles
16.2.1 Belmont Metals Inc.
16.2.1.1 Company Overview
16.2.1.2 Product Portfolio
16.2.1.3 Demographic Reach and Achievements
16.2.1.4 Certifications
16.2.2 Saru Smelting Pvt. Ltd.,
16.2.2.1 Company Overview
16.2.2.2 Product Portfolio
16.2.2.3 Demographic Reach and Achievements
16.2.2.4 Certifications
16.2.3 Nippon Yakin Kogyo Co., Ltd.
16.2.3.1 Company Overview
16.2.3.2 Product Portfolio
16.2.3.3 Demographic Reach and Achievements
16.2.3.4 Certifications
16.2.4 Australian Metals Pty Ltd
16.2.4.1 Company Overview
16.2.4.2 Product Portfolio
16.2.4.3 Demographic Reach and Achievements
16.2.4.4 Certifications
16.2.5 Lee Kee Group Limited
16.2.5.1 Company Overview
16.2.5.2 Product Portfolio
16.2.5.3 Demographic Reach and Achievements
16.2.5.4 Certifications
16.2.6 Gravita India Limited
16.2.6.1 Company Overview
16.2.6.2 Product Portfolio
16.2.6.3 Demographic Reach and Achievements
16.2.6.4 Certifications
16.2.7 Others
17 Key Trends and Developments in the Market
Additional Customisations Available
1 Manufacturing Process
1.1 Overview
1.2 Detailed Process Flow
1.3 Operation Involved
2 Project Requirement and Cost Analysis
2.1 Land, Location and Site Development
2.2 Construction
2.3 Plant Machinery
2.4 Raw Material
2.5 Packaging
2.6 Transportation
2.7 Utilities
2.8 Manpower
2.9 Other Capital Investment
List of Key Figures and Tables
1. Global Non-Magnetic Metals and Alloys Market: Key Industry Highlights, 2015 and 2025
2. Global Non-Magnetic Metals and Alloys Historical Market: Breakup by Product Type (USD Billion), 2018-2023
3. Global Non-Magnetic Metals and Alloys Market Forecast: Breakup by Product Type (USD Billion), 2024-2032
4. Global Non-Magnetic Metals and Alloys Historical Market: Breakup by Application (USD Billion), 2018-2023
5. Global Non-Magnetic Metals and Alloys Market Forecast: Breakup by Application (USD Billion), 2024-2032
6. Global Non-Magnetic Metals and Alloys Historical Market: Breakup by Region (USD Billion), 2018-2023
7. Global Non-Magnetic Metals and Alloys Market Forecast: Breakup by Region (USD Billion), 2024-2032
8. North America Non-Magnetic Metals and Alloys Historical Market: Breakup by Country (USD Billion), 2018-2023
9. North America Non-Magnetic Metals and Alloys Market Forecast: Breakup by Country (USD Billion), 2024-2032
10. Europe Non-Magnetic Metals and Alloys Historical Market: Breakup by Country (USD Billion), 2018-2023
11. Europe Non-Magnetic Metals and Alloys Market Forecast: Breakup by Country (USD Billion), 2024-2032
12. Asia Pacific Non-Magnetic Metals and Alloys Historical Market: Breakup by Country (USD Billion), 2018-2023
13. Asia Pacific Non-Magnetic Metals and Alloys Market Forecast: Breakup by Country (USD Billion), 2024-2032
14. Latin America Non-Magnetic Metals and Alloys Historical Market: Breakup by Country (USD Billion), 2018-2023
15. Latin America Non-Magnetic Metals and Alloys Market Forecast: Breakup by Country (USD Billion), 2024-2032
16. Middle East and Africa Non-Magnetic Metals and Alloys Historical Market: Breakup by Country (USD Billion), 2018-2023
17. Middle East and Africa Non-Magnetic Metals and Alloys Market Forecast: Breakup by Country (USD Billion), 2024-2032
18. Global Non-Magnetic Metals and Alloys Market Structure
Key Questions Answered in the Report
The global non-magnetic metals and alloys market is projected to grow at a CAGR of nearly 5% in the forecast period of 2024-2032.
The growth of the market is being driven by the rising population, growing disposable income, and the rising demand from the construction industry.
The favourable government policies and several other programmes have helped to consume more non-magnetic metals and alloys due to the increased number of aircraft and space ships, this is an important industry trend driving the market growth.
North America, Europe, the Asia Pacific, Latin America, and the Middle East and Africa are the leading regions in the market, with North America accounting for the largest market share.
The major types include non-ferrous metals, precious metals, and exotic or rare metals.
The product finds wide applications in aerospace, industrial gas, and turbine, automotive, electrical and electronics, and chemical, among others.
The leading players in the market are Belmont Metals Inc., Saru Smelting Pvt. Ltd., Nippon Yakin Kogyo Co., Ltd., Australian Metals Pty Ltd, Lee Kee Group Limited, and Gravita India Limited, among others.
Analyst Review
The global non-magnetic metals and alloys market is being driven by the growth in the construction industry. Aided by the rising favourable government policies and several other programmes, the industry is expected to witness a healthy growth in the forecast period of 2024-2032, growing at a CAGR of 5%.
EMR’s meticulous research methodology delves deep into the industry, covering the macro and micro aspects of the industry. Based on its types, the global market for non-magnetic metals and alloys can be segmented into non-ferrous metals, precious metals, and exotic or rare metals. On the basis of application, the global industry can be divided into aerospace, industrial gas, and turbine, automotive, electrical and electronics, and chemical, among others. The major regional markets for non-magnetic metals and alloys are North America, Europe, the Asia Pacific, Latin America, and the Middle East and Africa, with North America accounting for the largest share of the market. The key players in the above industry include Belmont Metals Inc., Saru Smelting Pvt. Ltd., Nippon Yakin Kogyo Co., Ltd., Australian Metals Pty Ltd, Lee Kee Group Limited, and Gravita India Limited, among others.
EMR’s research methodology uses a combination of cutting-edge analytical tools and the expertise of their highly accomplished team, thus, providing their customers with market insights that are accurate, actionable, and help them remain ahead of their competition.
Purchase Options 10% off


Call us
Purchase Full Report
Mini Report
$ 2199
$1999
-
Selected Sections, One User
-
Printing Not Allowed
-
Email Delivery in PDF
-
Free Limited Customisation -
Post Sales Analyst Support -
50% Discount on Next Update
Single User License
$ 3299
$2999
-
All Sections, One User
-
One Print Allowed
-
Email Delivery in PDF
-
Free Limited Customisation -
Post Sales Analyst Support -
50% Discount on Next Update

Five User License
$ 4399
$3999
-
All Sections, Five Users
-
Five Prints Allowed
-
Email Delivery in PDF
-
Free Limited Customisation
-
Post Sales Analyst Support
-
50% Discount on Next Update
Corporate License
$ 5499
$4999
-
All Sections, Unlimited Users
-
Unlimited Prints Allowed
-
Email Delivery in PDF + Excel
-
Free Limited Customisation
-
Post Sales Analyst Support
-
50% Discount on Next Update
Any Question? Speak With An Analyst
View A Sample
Did You Miss Anything, Ask Now
Why Expert Market Research?
Right People
We are technically excellent, strategic, practical, experienced and efficient; our analysts are hand-picked based on having the right attributes to work successfully and execute projects based on your expectations.
Right Methodology
We leverage our cutting-edge technology, our access to trusted databases, and our knowledge of the current models used in the market to deliver you research solutions that are tailored to your needs and put you ahead of the curve.
Right Price
We deliver in-depth and superior quality research in prices that are reasonable, unmatchable, and shows our understanding of your resource structure. We, additionally, offer attractive discounts on our upcoming reports.
Right Support
Our team of expert analysts are at your beck and call to deliver you optimum results that are customised to meet your precise needs within the specified timeframe and help you form a better understanding of the industry.
NEWSLETTER