Reports
Sale

Global Single-Use Filtration Assemblies Market Size, Share: By Product Type: Filters, Filtration Cartridges, Filtration Membranes, Manifold, Cassettes, Syringes, Others; By Type: Membrane Filtration, Depth Filtration, Centrifugation, Others; By Applications; Regional Analysis; Patent Analysis; Supplier Landscape; 2024-2032
Global Single-Use Filtration Assemblies Market Outlook
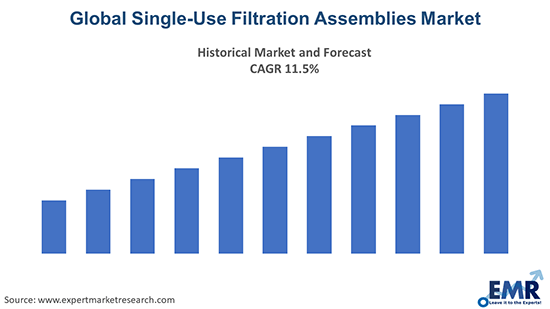
The global single-use filtration assemblies market value in 2023 was USD 5.40 billion and is anticipated to grow at a CAGR of 17.4% during the forecast period of 2024-2032 driven by the increasing adoption of single-use technologies in biopharmaceutical manufacturing across the globe. The global single-use filtration assemblies market share is anticipated to achieve a value of USD 22.88 billion by 2032.
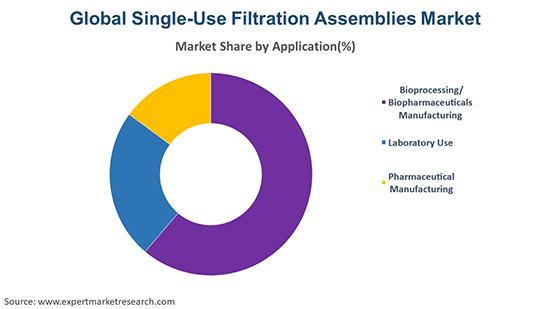
The bioprocessing/biopharmaceuticals manufacturing segment is dominating the application sector. The development of the biotherapeutics market is primarily driving the single-use filtration assemblies market. The Asia Pacific is the fastest-growing region for the single-use filtration assemblies market.
Read more about this report - REQUEST FREE SAMPLE COPY IN PDF
Properties and Applications
Single-us filtration assemblies refer to an alternative to the traditional stainless-steel systems. The conventional stainless-steel systems have higher chances of contamination and these single-use filtration assemblies get rid of all the contaminants through sterilization.
Read more about this report - REQUEST FREE SAMPLE COPY IN PDF
Based on type, the industry can be divided into:
- Resurfacing Hemiarthroplasty
- Reverse Total Shoulder Replacement
- Stemmed Hemiarthroplasty
- Total Shoulder Replacement
The industry can be divided based on its products into:
- Filters
- Filtration Cartridges
- Filtration Membranes
- Manifold
- Cassettes
- Syringe
- Others
The industry can be broadly categorised based on its applications segments into:
- Bioprocessing/ Biopharmaceuticals Manufacturing
- Laboratory Use
- Pharmaceutical Manufacturing
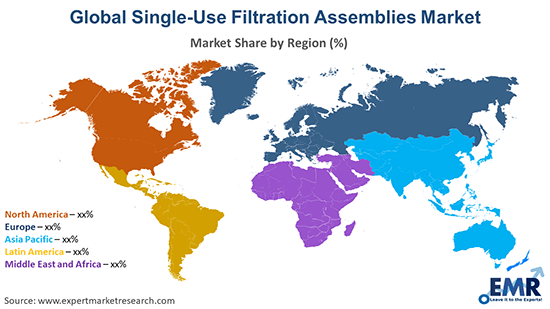
The EMR report looks into the regional markets of single-use filtration assemblies like North America, Latin America, Europe, the Middle East and Africa, and the Asia Pacific regions.
Read more about this report - REQUEST FREE SAMPLE COPY IN PDF
Market Analysis
The growth of the biotherapeutic industry and budget constraints faced by small to medium-sized end-users are essential factors driving the market. Single-use equipment is a cost-saving technique for contract manufacturers, which is why most CMOs are likely to use unitary filter cartridges and tubing systems. One of the main reasons for the market growth is the robustness of venture capital investments in the industry. The availability of life science investment funds is expected to promote the adoption of feasible filtering systems by research laboratories and biopharmaceutical developers, which is expected to aid the growth of the single-use filtration assemblies market.
Competitive Landscape
The report presents a detailed analysis of the following key players in the global single-use filtration assemblies’ market, looking into their capacity, competitive landscape, and latest developments like capacity expansions, plant turnarounds, and mergers and acquisitions:
- Sartorius AG
- The 3M Company
- Repligen Corporation
- Meissner Filtration Products, Inc.
- Thermo Fisher Scientific, Inc.
- Others
The EMR report gives an in-depth insight into the market by providing a SWOT analysis as well as an analysis of Porter’s Five Forces model.
Key Highlights of the Report
| REPORT FEATURES | DETAILS |
| Base Year | 2023 |
| Historical Period | 2017-2023 |
| Forecast Period | 2024-2032 |
| Scope of the Report |
Historical and Forecast Trends, Industry Drivers and Constraints, Historical and Forecast Market Analysis by Segment-
|
| Breakup by Product Type |
|
| Breakup by Type |
|
| Breakup by Applications |
|
| Breakup by Region |
|
| Market Dynamics |
|
| Supplier Landscape |
|
| Companies Covered |
|
| Report Price and Purchase Option | Explore our purchase options that are best suited to your resources and industry needs. |
| Delivery Format | Delivered as an attached PDF and Excel through email, with an option of receiving an editable PPT, according to the purchase option. |
*At Expert Market Research, we strive to always give you current and accurate information. The numbers depicted in the description are indicative and may differ from the actual numbers in the final EMR report.
1 Preface
1.1 Objectives of the Study
1.2 Key Assumptions
1.3 Report Coverage – Key Segmentation and Scope
1.4 Research Methodology
2 Executive Summary
3 Global Single-Use Filtration Assemblies Market Overview
3.1 Global Single-Use Filtration Assemblies Market Historical Value (2017-2023)
3.2 Global Single-Use Filtration Assemblies Market Forecast Value (2024-2032)
4 Global Single-Use Filtration Assemblies Market Landscape
4.1 Global Single-Use Filtration Assemblies Developers Landscape
4.1.1 Analysis by Year of Establishment
4.1.2 Analysis by Company Size
4.1.3 Analysis by Region
4.2 Global Single-Use Filtration Assemblies Product Landscape
4.2.1 Analysis by Product Type
4.2.2 Analysis by Region
4.2.3 Analysis by Applications
5 Global Single-Use Filtration Assemblies Market Dynamics
5.1 Market Drivers and Constraints
5.2 SWOT Analysis
5.3 Porter’s Five Forces Model
5.4 Key Demand Indicators
5.5 Key Price Indicators
5.6 Industry Events, Initiatives, and Trends
5.7 Value Chain Analysis
6 Global Single-Use Filtration Assemblies Market Segmentation
6.1 Global Single-Use Filtration Assemblies Market, by Product Type
6.1.1 Market Overview
6.1.1.1 Filters
6.1.1.2 Filtration Cartridges
6.1.1.3 Filtration Membranes
6.1.1.4 Manifold
6.1.1.5 Cassettes
6.1.1.6 Syringes
6.1.1.7 Others
6.2 Global Single-Use Filtration Assemblies Market, by Type
6.2.1 Market Overview
6.2.2 Membrane Filtration
6.2.2.1 Tangential Flow Filtration / Cross Flow Filtration
6.2.2.2 Ultrafiltration
6.2.2.3 Micro filtration
6.2.3 Depth Filtration
6.2.4 Centrifugation
6.2.5 Others
6.3 Global Single-Use Filtration Assemblies Market, by Applications
6.3.1 Market Overview
6.3.1.1 Pharmaceuticals Manufacturing
6.3.1.2 Bioprocessing or Biopharmaceuticals
6.3.1.3 Laboratory Use
6.3.1.4 Others
6.4 Global Single-Use Filtration Assemblies Market by Region
6.4.1 Market Overview
6.4.2 North America
6.4.3 Europe
6.4.4 Asia Pacific
6.4.5 Latin America
6.4.6 Middle East and Africa
7 North America Single-Use Filtration Assemblies Market
7.1 Market Share by Country
7.2 United States of America
7.3 Canada
8 Europe Single-Use Filtration Assemblies Market
8.1 Market Share by Country
8.2 United Kingdom
8.3 Germany
8.4 France
8.5 Italy
8.6 Others
9 Asia Pacific Single-Use Filtration Assemblies Market
9.1 Market Share by Country
9.2 China
9.3 Japan
9.4 India
9.5 ASEAN
9.6 Australia
9.7 Others
10 Latin America Single-Use Filtration Assemblies Market
10.1 Market Share by Country
10.2 Brazil
10.3 Argentina
10.4 Mexico
10.5 Others
11 Middle East and Africa Single-Use Filtration Assemblies Market
11.1 Market Share by Country
11.2 Saudi Arabia
11.3 United Arab Emirates
11.4 Nigeria
11.5 South Africa
11.6 Others
12 Patent Analysis
12.1 Analysis by Type of Patent
12.2 Analysis by Publication year
12.3 Analysis by Issuing Authority
12.4 Analysis by Patent Age
12.5 Analysis by CPC Analysis
12.6 Analysis by Patent Valuation
12.7 Analysis by Key Players
13 Grants Analysis
13.1 Analysis by year
13.2 Analysis by Amount Awarded
13.3 Analysis by Issuing Authority
13.4 Analysis by Grant Application
13.5 Analysis by Funding Institute
13.6 Analysis by NIH Departments
13.7 Analysis by Recipient Organization
14 Funding Analysis
14.1 Analysis by Funding Instances
14.2 Analysis by Type of Funding
14.3 Analysis by Funding Amount
14.4 Analysis by Leading Players
14.5 Analysis by Leading Investors
14.6 Analysis by Geography
15 Partnership and Collaborations Analysis
15.1 Analysis by Partnership Instances
15.2 Analysis by Type of Partnership
15.3 Analysis by Leading Players
15.4 Analysis by Geography
16 Regulatory Framework
16.1 Regulatory Overview
16.1.1 US FDA
16.1.2 EU EMA
16.1.3 INDIA CDSCO
16.1.4 JAPAN PMDA
16.1.5 Others
17 Supplier Landscape
17.1 3M
17.1.1 Financial Analysis
17.1.2 Product Portfolio
17.1.3 Demographic Reach and Achievements
17.1.4 Mergers and Acquisitions
17.1.5 Certifications
17.2 Danaher Financial Analysis
17.2.1 Product Portfolio
17.2.2 Demographic Reach and Achievements
17.2.3 Mergers and Acquisitions
17.2.4 Certifications
17.3 MEISSNER FILTRATION PRODUCTS, INC.
17.3.1 Financial Analysis
17.3.2 Product Portfolio
17.3.3 Demographic Reach and Achievements
17.3.4 Mergers and Acquisitions
17.3.5 Certifications
17.4 Sartorius AG
17.4.1 Financial Analysis
17.4.2 Product Portfolio
17.4.3 Demographic Reach and Achievements
17.4.4 Mergers and Acquisitions
17.4.5 Certifications
17.5 Repligen Corporation
17.5.1 Financial Analysis
17.5.2 Product Portfolio
17.5.3 Demographic Reach and Achievements
17.5.4 Mergers and Acquisitions
17.5.5 Certifications
17.6 Alpha Plan GmbH
17.6.1 Financial Analysis
17.6.2 Product Portfolio
17.6.3 Demographic Reach and Achievements
17.6.4 Mergers and Acquisitions
17.6.5 Certifications
17.7 Merck KGaA
17.7.1 Financial Analysis
17.7.2 Product Portfolio
17.7.3 Demographic Reach and Achievements
17.7.4 Mergers and Acquisitions
17.7.5 Certifications
17.8 Thermo Fisher Scientific Inc.
17.8.1 Financial Analysis
17.8.2 Product Portfolio
17.8.3 Demographic Reach and Achievements
17.8.4 Mergers and Acquisitions
17.8.5 Certifications
17.9 Medela AG
17.9.1 Financial Analysis
17.9.2 Product Portfolio
17.9.3 Demographic Reach and Achievements
17.9.4 Mergers and Acquisitions
17.9.5 Certifications
17.10 DrM, Dr. Mueller AG
17.10.1 Financial Analysis
17.10.2 Product Portfolio
17.10.3 Demographic Reach and Achievements
17.10.4 Mergers and Acquisitions
17.10.5 Certifications
17.11 Pall Corporation
17.11.1 Financial Analysis
17.11.2 Product Portfolio
17.11.3 Demographic Reach and Achievements
17.11.4 Mergers and Acquisitions
17.11.5 Certifications
17.12 Axiva Sichem Biotech
17.12.1 Financial Analysis
17.12.2 Product Portfolio
17.12.3 Demographic Reach and Achievements
17.12.4 Mergers and Acquisitions
17.12.5 Certifications
17.13 Asahi Kasei Corporation
17.13.1 Financial Analysis
17.13.2 Product Portfolio
17.13.3 Demographic Reach and Achievements
17.13.4 Mergers and Acquisitions
17.13.5 Certifications
17.14 UltraPure International
17.14.1 Financial Analysis
17.14.2 Product Portfolio
17.14.3 Demographic Reach and Achievements
17.14.4 Mergers and Acquisitions
17.14.5 Certifications
17.15 Durva Enterprise
17.15.1 Financial Analysis
17.15.2 Product Portfolio
17.15.3 Demographic Reach and Achievements
17.15.4 Mergers and Acquisitions
17.15.5 Certifications
17.16 A One Engineering Works
17.16.1 Financial Analysis
17.16.2 Product Portfolio
17.16.3 Demographic Reach and Achievements
17.16.4 Mergers and Acquisitions
17.16.5 Certifications
17.17 Amogh Enterprises
17.17.1 Financial Analysis
17.17.2 Product Portfolio
17.17.3 Demographic Reach and Achievements
17.17.4 Mergers and Acquisitions
17.17.5 Certifications
17.18 T.C. SCIENTIFIC GLASS WORKS
17.18.1 Financial Analysis
17.18.2 Product Portfolio
17.18.3 Demographic Reach and Achievements
17.18.4 Mergers and Acquisitions
17.18.5 Certifications
17.19 Gupta Scientific & Glass Works
17.19.1 Financial Analysis
17.19.2 Product Portfolio
17.19.3 Demographic Reach and Achievements
17.19.4 Mergers and Acquisitions
17.19.5 Certifications
18 Global Single-Use Filtration Assemblies Market-Distribution Model (Additional Insight)
18.1 Overview
18.2 Potential Distributors
18.3 Key Parameters for Distribution Partner Assessment
19 Key Opinion Leaders (KOL) Insights (Additional Insight)
20 Company Competitiveness Analysis (Additional Insight)
20.1 Very Small Companies
20.2 Small Companies
20.3 Mid-Sized Companies
20.4 Large Companies
20.5 Very Large Companies
21 Pricing Models and Strategies (Additional Insight)
21.1 Overview
21.2 Cost Model
21.2.1 Manufacturing Cost Analysis
21.2.2 Procurement Cost Analysis
21.2.3 Clinical Trial Cost Factors
21.3 Pricing Strategies
21.3.1 Competitor Pricing Analysis
21.3.2 Key Assessment of Product Attributes
21.3.3 Pricing Benchmark
*Additional insights provided are customisable as per client requirements.
Key Questions Answered in the Report
The single-use filtration assemblies market was valued at USD 5.40 billion in 2023.
The market is expected to grow at a CAGR of 17.4% from 2024 to 2032 to reach a value of USD 22.88 billion by 2032.
The major drivers of the market include the robustness of venture capital investments, availability of life science investment funds, shift in the focus by the manufacturers from small molecule drugs to large molecule drug products, rising expenditure for research and development activities, and rising technological advancements in the healthcare sector.
Factors like the growth of the biotherapeutic industry and budget constraints faced by small to medium-sized end-users are the key trends propelling the market forward.
The major regions in the industry are North America, Latin America, Europe, Middle East and Africa, and Asia Pacific with Asia Pacific accounting for the largest share in the market.
Based on type, the industry can be divided into resurfacing hemiarthroplasty, reverse total shoulder replacement, stemmed hemiarthroplasty, and total shoulder replacement.
The industry can be divided based on its products into filters, filtration cartridges, filtration membranes, manifold, cassettes, and syringe, among others.
The bioprocessing/biopharmaceuticals manufacturing is the dominant application in the industry.
The major players in the industry are Sartorius AG , The 3M Company, Repligen Corporation, Meissner Filtration Products, Inc., and Thermo Fisher Scientific, Inc., among others.
Purchase Options 10% off


Call us
Purchase Full Report
Mini Report
$ 2969
$2699
-
Selected Sections, One User
-
Printing Not Allowed
-
Email Delivery in PDF
-
Free Limited Customisation -
Post Sales Analyst Support -
50% Discount on Next Update
Single User License
$ 5499
$4999
-
All Sections, One User
-
One Print Allowed
-
Email Delivery in PDF
-
Free Limited Customisation -
Post Sales Analyst Support -
50% Discount on Next Update

Five User License
$ 6599
$5999
-
All Sections, Five Users
-
Five Prints Allowed
-
Email Delivery in PDF
-
Free Limited Customisation
-
Post Sales Analyst Support
-
50% Discount on Next Update
Corporate License
$ 7699
$6999
-
All Sections, Unlimited Users
-
Unlimited Prints Allowed
-
Email Delivery in PDF + Excel
-
Free Limited Customisation
-
Post Sales Analyst Support
-
50% Discount on Next Update
Any Question? Speak With An Analyst
View A Sample
Did You Miss Anything, Ask Now
Why Expert Market Research?
Right People
We are technically excellent, strategic, practical, experienced and efficient; our analysts are hand-picked based on having the right attributes to work successfully and execute projects based on your expectations.
Right Methodology
We leverage our cutting-edge technology, our access to trusted databases, and our knowledge of the current models used in the market to deliver you research solutions that are tailored to your needs and put you ahead of the curve.
Right Price
We deliver in-depth and superior quality research in prices that are reasonable, unmatchable, and shows our understanding of your resource structure. We, additionally, offer attractive discounts on our upcoming reports.
Right Support
Our team of expert analysts are at your beck and call to deliver you optimum results that are customised to meet your precise needs within the specified timeframe and help you form a better understanding of the industry.
NEWSLETTER