Navigating Sustainable, Profitable Growth in a Rapidly Changing World

The South Korea aquaponics market growth is driven by rising demand for nutritious food and shifting climatic conditions. This trend underscores the importance of sustainable agriculture practices in response to evolving environmental challenges. Aquaponics, a blend of aquaculture and hydroponics, cultivates crops using organic waste from fish farms. The process involves recycling water between fish and plant systems. Aquaponics-grown produce is noted for its reduced nitrogen content and extended shelf life compared to conventional vegetables. The market is expanding due to growing interest in sustainable agriculture and the demand for organic food.
Fig: Key Parameters for a 2.5 Acres Aquaponics Farm
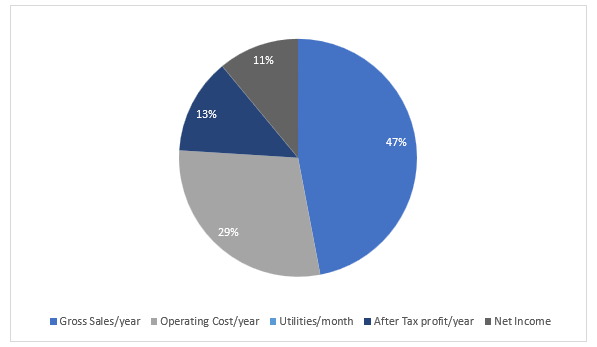
According to estimates, a 2.5-acre aquaponics farm is anticipated to yield approximately 2,500 pounds of fresh organic greens and vegetables daily, along with about 50 tons of fish annually for consumption. Based on daily consumption estimates of 2 pounds of greens and vegetables and 2 pounds of fresh fish per family of five, the aquaponics farm could provide vegetable nutrition to around 1,200 families daily and fish nutrition to 137 families daily over the course of a year.
The aquaponics market is experiencing growth due to increased health consciousness and demand for organic products, amplified by the COVID-19 pandemic. Organically produced foods are perceived as healthier and tastier, free from harmful chemicals and fertilisers. These foods have lower nitrate and saturated fat levels and higher omega-3 fatty acids, potentially reducing the risk of cancer and cardiovascular diseases. This shift in consumer perception is driving the adoption of aquaponics in South Korea.
Climate change is driving the growth of the aquaponics market in South Korea, as adverse weather conditions challenge traditional agriculture. Globally, there is a demand for sustainable alternatives like aquaponics to combat soil erosion, biodiversity loss, and air pollution caused by conventional farming practices. The shift towards sustainable agricultural methods is prompted by concerns over groundwater salinization, reduced water availability, and other environmental impacts.
Read more about this report - REQUEST FREE SAMPLE COPY IN PDF
Market Breakup by Equipment, Component, Growing System, Facility Type, Product Type, and Application:
- Based on equipment, the market can be divided into grow lights, pumps and valves, fish purge systems, in-line water heaters, aeration system, and water quality testing, among others.
- The market is segmented based on component into rearing tank, settling basin, bio-filter, and sump tank, among others.
- By growing systems, the market is segmented into media filled beds, nutrient film technique (NFT), and raft or deep-water culture.
- On the basis of facility type, the market is categorised into poly or glass greenhouses and indoor vertical farms, among others.
- Based on product type, the market is divided into fish, vegetables, herbs, and fruit.
- By application, the market is segmented into commercial and home production, among others.
Key Findings of the Report:
- Aquaponics attracts environmentally conscious individuals due to its significant environmental benefits compared to conventional agriculture, such as using 90% less water.
- The increasing demand for fish, coupled with declining fish populations in natural water bodies, drives the adoption of aquaponics.
- This innovative approach not only conserves water but also addresses the global demand for sustainable protein sources, making it a practical solution to food security challenges.
Key Offerings of the Report:
- The EMR report gives an overview of the South Korea aquaponics market for the periods (2019-2025) and (2026-2035).
- The report also offers historical (2019-2025) and forecast (2026-2035) market information for the equipment, component, growing system, facility type, product type, and application of aquaponics in South Korea.
- The report analyses the market dynamics, covering the key demand and price indicators in the market, along with providing an assessment of the SWOT and Porter’s Five Forces models.
Top Players
- Manna CEA
- Seouchae Farm
The comprehensive report by EMR looks into the market share, capacity, and latest developments like mergers and acquisitions, plant turnarounds, and capacity expansions of the major players.
About Us
Expert Market Research (EMR) is a leading market research and business intelligence company, ensuring its clients remain at the vanguard of their industries by providing them with exhaustive and actionable market data through its syndicated and custom market reports, covering over 15 major industry domains. The company's expansive and ever-growing database of reports, which are constantly updated, includes reports from industry verticals like chemicals and materials, food and beverages, energy and mining, technology and media, consumer goods, pharmaceuticals, agriculture, and packaging.
EMR leverages its state-of-the-art technological and analytical tools, along with the expertise of its highly skilled team of over a 100 analysts and more than 3000 consultants, to help its clients, ranging from Fortune 1000 companies to small and medium sized enterprises, easily grasp the expansive industry data and help them in formulating market and business strategies, which ensure that they remain ahead of the curve.
Contact Us
Expert Market Research
Website: www.expertmarketresearch.com
Email: [email protected]
US & Canada Phone no: +1-415-325-5166
UK Phone no: +44-702-402-579


Pricing Plans
Upto 15% Off
USD
-
$3999 $3599
-
$2499 $2249
-
$4999 $4249
-
$5999 $5099
Request Sample
Report Summary
| REPORT FEATURES | DETAILS |
| Base Year | 2025 |
| Historical Period | 2019-2025 |
| Forecast Period | 2026-2035 |
| Scope of the Report |
Historical and Forecast Trends, Industry Drivers and Constraints, Historical and Forecast Market Analysis by Segment:
|
| Breakup by Equipment |
|
| Breakup by Component |
|
| Breakup by Growing System |
|
| Breakup by Facility Type |
|
| Breakup by Product Type |
|
| Breakup by Application |
|
| Market Dynamics |
|
| Competitive Landscape |
|
| Companies Covered |
|
How To Order
Our step-by-step guide will help you select, purchase, and access your reports swiftly, ensuring you get the information that drives your decisions, right when you need it.

Select License Type
Choose the right license for your needs and access rights.

Click on ‘Buy Now’
Add the report to your cart with one click and proceed to register.

Select Mode of Payment
Choose a payment option for a secure checkout. You will be redirected accordingly.
Single User License
USD 3,999
USD 3,599
tax inclusive*
- All Segments
- Printing Restrictions
- PDF Delivered via Email
- Custom Report Layout
- Post Sales Analysts Support
- Periodic Updates
- Unlimited Prints
Datasheet
USD 2,499
USD 2,249
tax inclusive*
- Selected Segments
- Printing Restrictions
- Excel Spreadsheet Delivered via Email
- Full Report
- Periodic Updates
- Post Sales Analysts Support
- Unlimited Prints
Five User License
USD 4,999
USD 4,249
tax inclusive*
- All Segments
- Five Prints Available
- PDF Delivered via Email
- Limited Free Customization
- Post Sales Analyst Support
- Custom Report Layout
- Periodic Updates
- Unlimited Prints
Corporate License
USD 5,999
USD 5,099
tax inclusive*
- All Segments
- Unlimited Prints Available
- PDF & Excel Delivery via Email
- Limited Free Customization
- Post Sales Analysts Support
- Discount On Next Update
- Custom Report Layout
*Please note that the prices mentioned below are starting prices for each bundle type. Kindly contact our team for further details.*
Flash Bundle
Small Business Bundle
Growth Bundle
Enterprise Bundle
- Life Time Access
- Analyst Support Related to Report
- PDF Version of the Report
- Complimentary Excel Data Set
- Free Analyst Hours
- Complimentary Free 1 Month Subscription to Trade Data Base
- Complimentary One Month Subscription to Price Database (Chemicals only)
- Complimentary PPT Version of the Report
- Complimentary License Upgrade
- Complimentary Power BI Dashboards
- Life Time Access
- Analyst Support Related to Report
- PDF Version of the Report
- Complimentary Excel Data Set
- Free Analyst Hours - 50 Hours
- Complimentary Free 1 Month Subscription to Trade Data Base
- Complimentary One Month Subscription to Price Database (Chemicals only)
- Complimentary PPT Version of the Report
- Complimentary License Upgrade
- Complimentary Power BI Dashboards
- Life Time Access
- Analyst Support Related to Report
- PDF Version of the Report
- Complimentary Excel Data Set
- Free Analyst Hours - 80 Hours
- Complimentary Free 1 Month Subscription to Trade Data Base
- Complimentary One Month Subscription to Price Database (Chemicals only)
- Complimentary PPT Version of the Report
- Complimentary License Upgrade
- Complimentary Power BI Dashboards
- Life Time Access
- Analyst Support Related to Report
- PDF Version of the Report
- Complimentary Excel Data Set
- Free Analyst Hours - 100 Hours
- Complimentary Free 1 Month Subscription to Trade Data Base
- Complimentary One Month Subscription to Price Database (Chemicals only)
- Complimentary PPT Version of the Report
- Complimentary License Upgrade
- Complimentary Power BI Dashboards
*Please note that the prices mentioned below are starting prices for each bundle type. Kindly contact our team for further details.*
Flash Bundle
Number of Reports: 3
20%
tax inclusive*
- 3 Reports Included
- Life Time Acess
- Analyst Support Related to Report
- PDF Version of the Report
- Free 1 Month Subscription to Trade Data Base
- 1 Month Subscription to Price Database (Chemicals only)
- Complimentary Excel Data Set
- PPT Version of the Report
- Power BI Dashboards
- License Upgrade
- Free Analyst Hours
Small Business Bundle
Number of Reports: 5
25%
tax inclusive*
- 5 Reports Included
- Life Time Acess
- Analyst Support Related to Report
- PDF Version of the Report
- Complimentary Excel Data Set
- Free Analyst Hours - 50 Hours
- Free 1 Month Subscription to Trade Data Base
- 1 Month Subscription to Price Database (Chemicals only)
- Complimentary Excel Data Set
- PPT Version of the Report
- Power BI Dashboards
- License Upgrade
Growth Bundle
Number of Reports: 8
30%
tax inclusive*
- 8 Reports Included
- Life Time Acess
- Analyst Support Related to Report
- PDF Version of the Report
- Complimentary Excel Data Set
- Free Analyst Hours - 50 Hours
- Free 1 Month Subscription to Trade Data Base
- 1 Month Subscription to Price Database (Chemicals only)
- License Upgrade
- Free Analyst Hours - 80 Hours
- Power BI Dashboards
Enterprise Bundle
Number of Reports: 10
35%
tax inclusive*
- 10 Reports Included
- Life Time Acess
- Analyst Support Related to Report
- PDF Version of the Report
- Complimentary Excel Data Set
- Free Analyst Hours - 50 Hours
- Free 1 Month Subscription to Trade Data Base
- 1 Month Subscription to Price Database (Chemicals only)
- License Upgrade
- Power BI Dashboards
- Free Analyst Hours - 100 Hours


