Explore Our Diverse Range Of Offerings
From detailed reports to experts services offered in 15+ Industry Domains
Report
Press Release
Blogs
Industry Statistics
Add 2 More Reports For 20% off

Report Overview

The global AIDS treatment market was valued at USD 31.50 Billion in 2025. It is poised to grow at a CAGR of 5.20% during the forecast period of 2026-2035, and reach USD 52.30 Billion by 2035. The market growth is driven by rising HIV prevalence, increasing awareness, government initiatives, improved diagnostics, advanced antiretroviral therapies, and expanding healthcare infrastructure.

Q1 2026 Market Updates

The US-Israel-Iran conflict, which escalated on 28 February 2026, is introducing serious risks to the global AIDS treatment market. The near-closure of the Strait of Hormuz has disrupted roughly 20% of global seaborne trade, while Gulf air-cargo capacity dropped 79% in the immediate aftermath of the conflict, driving a 22% reduction in worldwide air freight capacity. These disruptions are threatening the pharmaceutical supply chains that deliver antiretroviral (ARV) therapies to millions of patients globally.

Gulf countries serve as a critical pharmaceutical transit hub, where drugs and active pharmaceutical ingredients (APIs) from India, Europe, and China routinely pass before reaching Africa, Asia, and the Americas. Commercial shipping activity through the Strait of Hormuz remains approximately 90% below pre-war levels. For the AIDS treatment market, this disruption is particularly concerning because ARV supply chains are designed for continuous delivery, and many formulations include temperature-sensitive biologics that require cold-chain logistics. Cold-chain products, including certain ARV therapies, have narrow quality windows, making their supply chains inherently fragile.

India, which manufactures the majority of the world's generic ARV drugs, relies on Middle Eastern shipping corridors and air hubs such as Dubai and Doha for distributing these medications to sub-Saharan Africa, the region with the highest HIV burden. The rerouting of shipping around the Cape of Good Hope adds 10 to 14 days to delivery timelines and roughly USD 1 million in additional fuel costs per vessel. War-risk insurance premiums have surged twelvefold, and Hapag-Lloyd has imposed surcharges of up to USD 3,500 per container, all of which are inflating the delivered cost of generic ARV medications.

While short-term drug shortages remain limited due to existing inventory buffers in most national health systems, experts warn that these cushions are temporary. If the Strait of Hormuz disruption persists through Q2 2026, shortages of specific ARV formulations could emerge in countries with thin procurement pipelines. Rising energy costs, with Brent crude exceeding USD 126 per barrel, are also increasing manufacturing costs for API producers and generic drug makers, potentially leading to price increases for treatments that global health programmes have worked to make affordable.

Key Takeaways

Government: Governments in sub-Saharan African nations are reviewing national ARV stockpile levels and activating emergency procurement protocols with the Global Fund and PEPFAR to pre-position buffer stocks before shipping disruptions deepen. The WHO is coordinating with member states to identify alternative air freight routes bypassing Gulf hubs for time-sensitive ARV deliveries to high-burden countries. US and European regulatory agencies are expediting approvals for alternative generic ARV manufacturers whose supply chains are less dependent on Middle Eastern transit corridors.

Market: Generic ARV manufacturers in India face 10-15% increases in distribution costs as shipping reroutes and war-risk surcharges inflate the delivered price of medications to African and Asian markets. Global Fund procurement prices for first-line ARV regimens may need upward revision if logistics disruptions persist beyond Q2 2026, potentially reducing the number of patients that fixed budgets can cover. Pharmaceutical transit hubs in the Gulf, which process a significant share of India-to-Africa drug shipments, remain operating at approximately 10% of pre-war capacity.

Procurement: Procurement teams at national health agencies and international organizations are qualifying alternative shipping routes through East African ports and direct India-to-Africa ocean corridors to bypass disrupted Gulf transit points. Cold-chain logistics providers are reporting capacity constraints and premium pricing as demand for temperature-controlled air freight surges amid the 22% reduction in global air cargo availability. Emergency tenders for six-month ARV buffer stocks are being issued by several African health ministries to ensure treatment continuity for patients on lifelong antiretroviral therapy.

Key Market Trends and Insights

  • By types, HIV-1 is anticipated to lead during the forecast period due to its significantly higher global prevalence.
  • By drug types, integrase inhibitors held around 25% of the market share in the historical period.
  • By route of administration, oral administration is likely to lead during the forecast period as it remains the most convenient option for patients.

Market Size and Forecast

  • Market Size (2025): USD 31.50 Billion
  • Projected Market Size (2035): USD 52.30 Billion
  • CAGR (2026-2035): 5.20%
2025

Base Year

2019-2025

Historical Period

2026-2035

Forecast Period

  • According to the Global HIV & AIDS statistics by UNAIDS, approximately 40.8 million people worldwide were living with HIV at the end of 2024.

  • Rising HIV‑affected children globally, with 2.42 million in 2024, intensifies treatment needs, widening gaps and boosting therapy adoption.

  • In October 2025, Germany pledged USD 2.7 million plus USD 1.08 billion to the Global Fund, enhancing HIV treatment access.

Compound Annual Growth Rate

5.2%

Value in USD Billion

2026-2035


*this image is indicative*

AIDS Treatment Market Overview

The growing global burden of AIDS is driving continuous demand for antiretroviral therapies, including combination and pediatric treatments. Rising HIV prevalence, particularly in high-risk populations, coupled with longer patient lifespans due to improved therapies, intensifies the need for accessible and effective treatment options. This sustained demand encourages innovation, boosts adoption of advanced antiretroviral regimens, and expands market opportunities across key regions, supporting significant growth in the global AIDS treatment market. The market reached a value of approximately USD 31.50 Billion in 2025.

AIDS Treatment Market Growth Drivers

Rising Pediatric Burden Accelerating the Market Demand

The growing number of HIV‑affected children is driving market demand, prompting healthcare systems and industry players to expand access and accelerate treatment innovation. In January 2025, EATG reported 2.42 million children living with HIV in 2024, with 712 new infections daily. This surge highlights urgent medical needs, widening the treatment gap, and boosting adoption of effective therapies globally.

AIDS Treatment Market Trends

Key trends shaping the global AIDS treatment market include rising pediatric HIV cases, strategic international funding, advanced antiretroviral therapies, digital health integration, and expanded healthcare infrastructure.

Strategic Investments to Boost the Market Value

Increasing international financial support is shaping market trends. For instance, in October 2025, UNAIDS reported Germany pledged an extra USD 2.7 million in core funding, totaling USD 6 million, plus nearly USD 1.08 billion to the Global Fund. This strong commitment enhances HIV treatment access, strengthens long-term disease control, and fosters market growth by encouraging adoption of innovative treatment solutions worldwide.

AIDS Treatment Market Segmentation

Market Breakup by Types

Market Breakup by Drug Types

  • Nucleoside Reverse Transcriptase Inhibitors (NRTIs)
  • Non-Nucleoside Reverse Transcriptase Inhibitors (NNRTIs)
  • Protease Inhibitors (PIs)
  • Integrase Inhibitors
  • Entry and Fusion Inhibitors
  • Combination Class Drugs

Market Breakup by Route of Administration

  • Oral
  • Parenteral
  • Others

Market Breakup by End User

  • Hospitals
  • Homecare
  • Specialty Clinics
  • Others

Market Breakup by Distribution Channel

  • Hospital Pharmacies
  • Retail Pharmacies
  • Online Pharmacies

Market Breakup by Country

  • United Kingdom
  • Germany
  • France
  • Italy
  • Spain
  • Japan
  • India

AIDS Treatment Market Share

HIV-1 Expected to Dominate the Market Share by Types

The HIV‑1 segment dominates the market, driven by its higher prevalence worldwide. Representing the majority of treatment regimens, HIV‑1 accounts for approximately 85-90% of the market, while HIV‑2 remains limited to select regions, mainly West Africa. The dominance of HIV‑1 is supported by broader therapeutic focus, extensive drug development, and higher global patient population, making it the primary driver of market demand and growth.

AIDS Treatment Market Analysis by Region

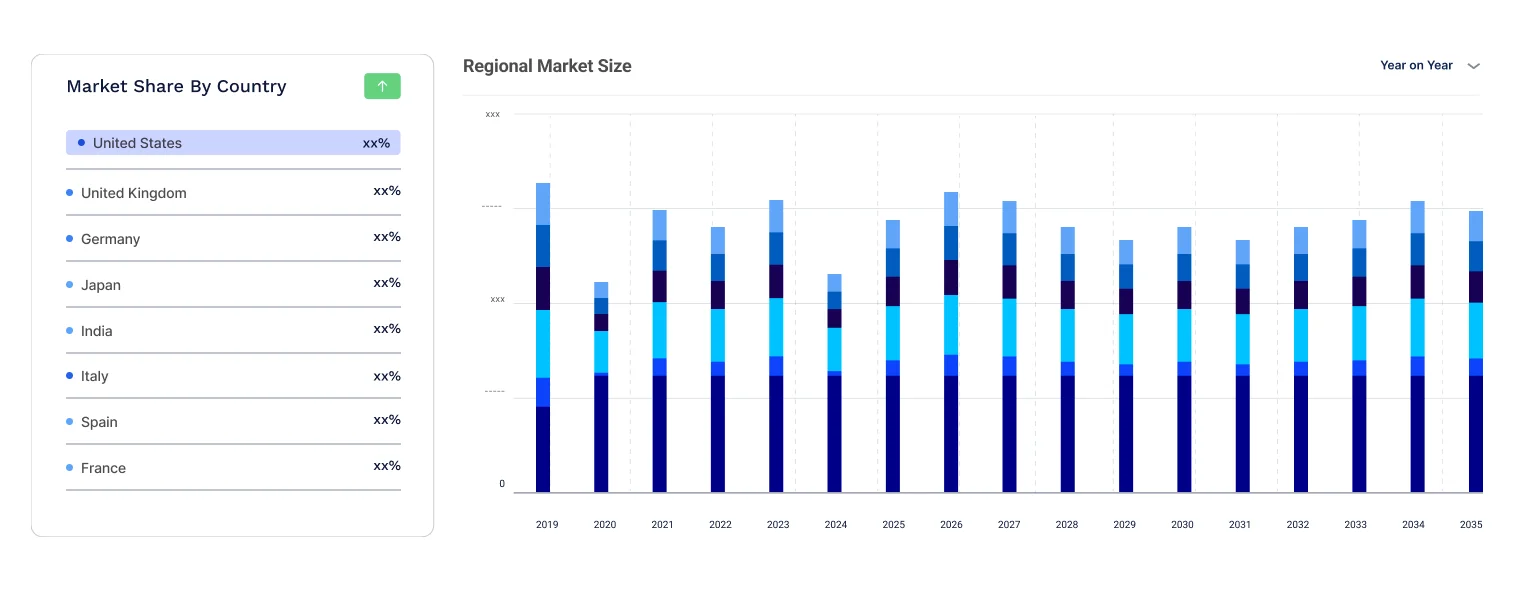
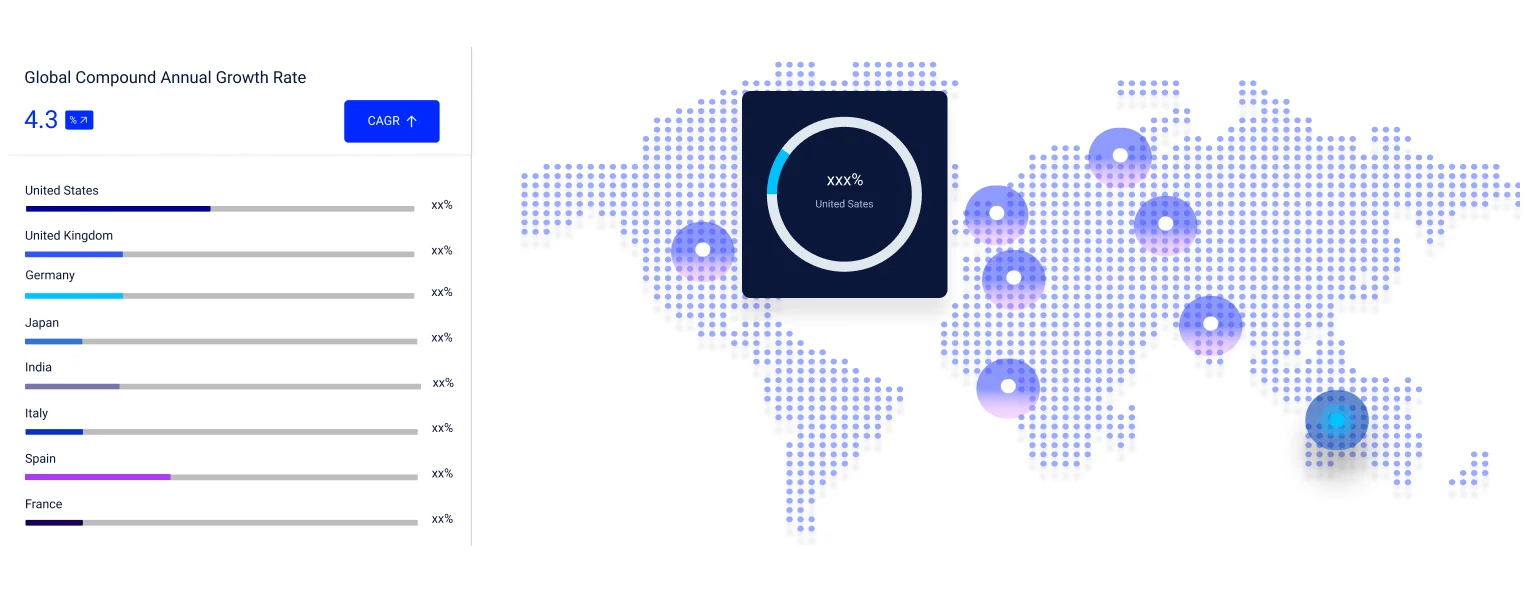
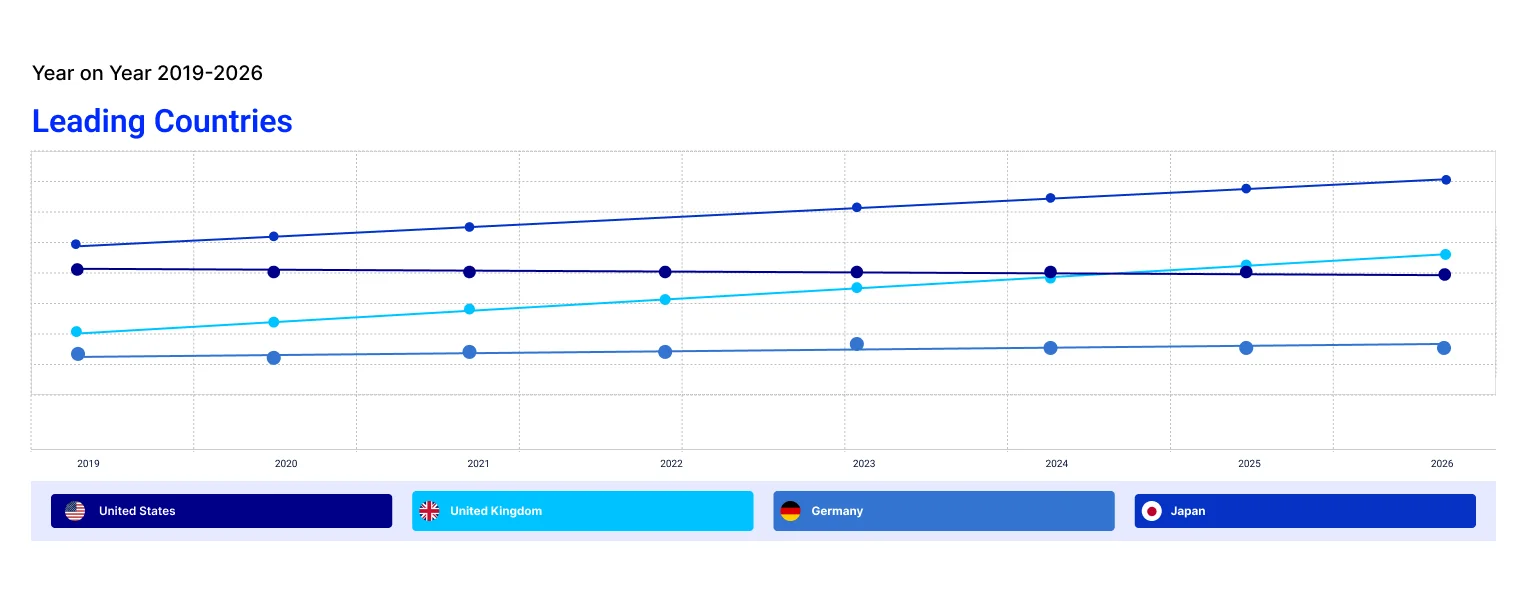
The United States is expected to lead the market, accounting for roughly 40% of total share due to advanced healthcare infrastructure and early adoption of innovative antiretroviral therapies. In Europe, the United Kingdom, Germany, France, Italy, and Spain collectively hold about 27%, while Japan and India contribute approximately 21%, reflecting growing treatment access and expanding public health initiatives in these key countries.

Leading Players in the AIDS Treatment Market

The key features of the market report comprise patent analysis, clinical trials analysis, funding and investment analysis and strategic initiatives by the leading players. The major companies in the market are as follows:

ViiV Healthcare

Headquartered in London, UK, ViiV Healthcare was established in 2009 as a joint venture by GlaxoSmithKline and Pfizer. Specializing in HIV/AIDS therapies, its portfolio includes antiretroviral drugs such as Tivicay, Triumeq, and Juluca, focusing on treatment, prevention, and long-term care for people living with HIV worldwide.

Gilead Sciences, Inc.

Founded in 1987 and headquartered in Foster City, California, USA, Gilead Sciences is a leading biopharmaceutical company. Its AIDS treatment portfolio includes Truvada, Descovy, Biktarvy, and Symtuza, covering antiretroviral therapy, pre-exposure prophylaxis (PrEP), and combination regimens to address HIV infection globally.

Teva Pharmaceutical Industries Ltd.

Established in 1901 and based in Petah Tikva, Israel, Teva Pharmaceuticals is a global generics and specialty medicines leader. In the HIV/AIDS market, it provides generic antiretroviral drugs, combination therapies, and pediatric formulations, enhancing accessibility and affordability of AIDS treatments across emerging and developed markets.

Cipla Ltd.

Founded in 1935 and headquartered in Mumbai, India, Cipla is a pioneer in affordable HIV/AIDS therapies. Its portfolio includes antiretroviral combination drugs, pediatric formulations, and generics, focusing on expanding global access, particularly in low- and middle-income countries, while supporting comprehensive HIV treatment programs worldwide.

*Please note that this is only a partial list; the complete list of key players is available in the full report. Additionally, the list of key players can be customized to better suit your needs.*

Other key players in the market are Johnson & Johnson Innovative Medicine, F. Hoffmann-La Roche Ltd., Merck & Co., Inc., Mylan Pharmaceuticals Inc., Theratechnologies Inc., and Boehringer Ingelheim International GmbH.

Key Questions Answered in the AIDS Treatment Market

  • What was the AIDS treatment market value in 2025?
  • What is the AIDS treatment market forecast outlook for 2026-2035?
  • What major factors aid the demand for AIDS treatment market?
  • How has the market performed so far, and how is it anticipated to perform in the coming years?
  • What are the market’s major drivers, opportunities, and restraints?
  • What are the major AIDS treatment market trends?
  • Which type is expected to dominate the market segment?
  • Which drug type functionality is projected to lead the market segment?
  • Which route of administration is anticipated to drive the market segment?
  • Which end user is likely to dominate the market segment?
  • Which distribution channel is likely to dominate the market segment?
  • Who are the key players in the AIDS treatment market?
  • What are the current unmet needs and challenges in the market?
  • How are partnerships, collaborations, mergers, and acquisitions among the key market players shaping the market dynamics?

*While we strive to always give you current and accurate information, the numbers depicted on the website are indicative and may differ from the actual numbers in the main report. At Expert Market Research, we aim to bring you the latest insights and trends in the market. Using our analyses and forecasts, stakeholders can understand the market dynamics, navigate challenges, and capitalize on opportunities to make data-driven strategic decisions.*

Looking for specific insights?

Get in touch with us for a customized solution tailored to your unique requirements and save upto 35%!

Report Summary

Explore our key highlights of the report and gain a concise overview of key findings, trends, and actionable insights that will empower your strategic decisions.

Key Highlights of the Report

Please note that the figures mentioned in the description serve as estimates and may vary from the actual figures presented in the final report.

REPORT FEATURES DETAILS
Base Year 2025
Historical Period 2019-2025
Forecast Period 2026-2035
Scope of the Report

Historical and Forecast Trends, Industry Drivers and Constraints, Historical and Forecast Market Analysis by Segment:

  • Types
  • Drug Types
  • Route of Administration
  • End User
  • Distribution Channel
  • Region
Breakup by Types
  • HIV-1
  • HIV-2
Breakup by Drug Types
  • Nucleoside Reverse Transcriptase Inhibitors (NRTIs)
  • Non-Nucleoside Reverse Transcriptase Inhibitors (NNRTIs)
  • Protease Inhibitors (PIs)
  • Integrase Inhibitors
  • Entry and Fusion Inhibitors
  • Combination Class Drugs
Breakup by Route of Administration
  • Oral
  • Parenteral
  • Others
Breakup by End User
  • Hospitals
  • Homecare
  • Specialty Clinics
  • Others
Breakup by Distribution Channel
  • Hospital Pharmacies
  • Retail Pharmacies
  • Online Pharmacies
Breakup by Region
  • United States
  • United Kingdom
  • Germany
  • France
  • Italy
  • Spain
  • Japan
  • India
Market Dynamics
  • Market Drivers and Constraints
  • SWOT Analysis
  • PESTEL Analysis
  • Porter’s Five Forces Model 
  • Key Demand Indicators
  • Key Price Indicators
  • Industry Events, Initiatives, and Trends 
  • Value Chain Analysis
Supplier Landscape
  • Market Structure
  • Company Profiles
    • Financial Analysis
    • Product Portfolio
    • Demographic Reach and Achievements
    • Company News and Developments
    • Certifications
Companies Covered
  • ViiV Healthcare
  • Gilead Sciences, Inc.
  • Teva Pharmaceutical Industries Ltd.
  • Cipla Ltd.
  • Johnson & Johnson Innovative Medicine
  • F. Hoffmann-La Roche Ltd.
  • Boehringer Ingelheim International GmbH
  • Merck & Co., Inc.
  • Mylan Pharmaceuticals Inc.
  • Theratechnologies Inc.

Datasheet

10 % Off

USD

3,299

2,969

Single User License

10 % Off

USD

5,499

4,949

Five User License

15 % Off

USD

6,999

5,949

Corporate License

15 % Off

USD

8,199

6,969

Datasheet

One User

USD 3,299

USD 2,969

tax inclusive*

  • Selected Segments
  • Printing Restrictions
  • Excel Spreadsheet Delivered via Email
  • Full Report
  • Periodic Updates
  • Post Sales Analysts Support
  • Unlimited Prints

Single User License

One User

USD 5,499

USD 4,949

tax inclusive*

  • All Segments
  • Printing Restrictions
  • PDF Delivered via Email
  • Custom Report Layout
  • Post Sales Analysts Support
  • Periodic Updates
  • Unlimited Prints

Five User License

Five User

USD 6,999

USD 5,949

tax inclusive*

  • All Segments
  • Five Prints Available
  • PDF Delivered via Email
  • Limited Free Customization
  • Post Sales Analyst Support
  • Custom Report Layout
  • Periodic Updates
  • Unlimited Prints

Corporate License

Unlimited Users

USD 8,199

USD 6,969

tax inclusive*

  • All Segments
  • Unlimited Prints Available
  • PDF & Excel Delivery via Email
  • Limited Free Customization
  • Post Sales Analysts Support
  • Discount On Next Update
  • Custom Report Layout

*Please note that the prices mentioned below are starting prices for each bundle type. Kindly contact our team for further details.*

Bundle Type

Flash Bundle

20% OFF Number of Reports: 3

Small Business Bundle

25% OFF Number of Reports: 5

Growth Bundle

30% OFF Number of Reports: 8

Enterprise Bundle

35% OFF Number of Reports: 10
Overview
  • Life Time Access
  • Analyst Support Related to Report
  • PDF Version of the Report
  • Complimentary Excel Data Set
  • Free Analyst Hours
  • Complimentary Free 1 Month Subscription to Trade Data Base
  • Complimentary One Month Subscription to Price Database (Chemicals only)
  • Complimentary PPT Version of the Report
  • Complimentary License Upgrade
  • Complimentary Power BI Dashboards
  • Life Time Access
  • Analyst Support Related to Report
  • PDF Version of the Report
  • Complimentary Excel Data Set
  • Free Analyst Hours - 50 Hours
  • Complimentary Free 1 Month Subscription to Trade Data Base
  • Complimentary One Month Subscription to Price Database (Chemicals only)
  • Complimentary PPT Version of the Report
  • Complimentary License Upgrade
  • Complimentary Power BI Dashboards
  • Life Time Access
  • Analyst Support Related to Report
  • PDF Version of the Report
  • Complimentary Excel Data Set
  • Free Analyst Hours - 80 Hours
  • Complimentary Free 1 Month Subscription to Trade Data Base
  • Complimentary One Month Subscription to Price Database (Chemicals only)
  • Complimentary PPT Version of the Report
  • Complimentary License Upgrade
  • Complimentary Power BI Dashboards
  • Life Time Access
  • Analyst Support Related to Report
  • PDF Version of the Report
  • Complimentary Excel Data Set
  • Free Analyst Hours - 100 Hours
  • Complimentary Free 1 Month Subscription to Trade Data Base
  • Complimentary One Month Subscription to Price Database (Chemicals only)
  • Complimentary PPT Version of the Report
  • Complimentary License Upgrade
  • Complimentary Power BI Dashboards

*Please note that the prices mentioned below are starting prices for each bundle type. Kindly contact our team for further details.*

Flash Bundle

Number of Reports: 3

20%

tax inclusive*

  • 3 Reports Included
  • Life Time Acess
  • Analyst Support Related to Report
  • PDF Version of the Report
  • Free 1 Month Subscription to Trade Data Base
  • 1 Month Subscription to Price Database (Chemicals only)
  • Complimentary Excel Data Set
  • PPT Version of the Report
  • Power BI Dashboards
  • License Upgrade
  • Free Analyst Hours

Small Business Bundle

Number of Reports: 5

25%

tax inclusive*

  • 5 Reports Included
  • Life Time Acess
  • Analyst Support Related to Report
  • PDF Version of the Report
  • Complimentary Excel Data Set
  • Free Analyst Hours - 50 Hours
  • Free 1 Month Subscription to Trade Data Base
  • 1 Month Subscription to Price Database (Chemicals only)
  • Complimentary Excel Data Set
  • PPT Version of the Report
  • Power BI Dashboards
  • License Upgrade

Growth Bundle

Number of Reports: 8

30%

tax inclusive*

  • 8 Reports Included
  • Life Time Acess
  • Analyst Support Related to Report
  • PDF Version of the Report
  • Complimentary Excel Data Set
  • Free Analyst Hours - 50 Hours
  • Free 1 Month Subscription to Trade Data Base
  • 1 Month Subscription to Price Database (Chemicals only)
  • License Upgrade
  • Free Analyst Hours - 80 Hours
  • Power BI Dashboards

Enterprise Bundle

Number of Reports: 10

35%

tax inclusive*

  • 10 Reports Included
  • Life Time Acess
  • Analyst Support Related to Report
  • PDF Version of the Report
  • Complimentary Excel Data Set
  • Free Analyst Hours - 50 Hours
  • Free 1 Month Subscription to Trade Data Base
  • 1 Month Subscription to Price Database (Chemicals only)
  • License Upgrade
  • Power BI Dashboards
  • Free Analyst Hours - 100 Hours

How To Order

This is a collaborative report by Vishakha Agrawal reflecting perspectives and research-driven insights from Expert Market Research.

Our step-by-step guide will help you select, purchase, and access your reports swiftly, ensuring you get the information that drives your decisions, right when you need it.

License Type

Select License Type

Choose the right license for your needs and access rights.

shopping cart

Click on ‘Buy Now’

Add the report to your cart with one click and proceed to register.

Bookmark Icon

Select Mode of Payment

Choose a payment option for a secure checkout. You will be redirected accordingly.

Strategic Solutions for Informed Decision-Making

Connect For More Information

Our expert team of analysts will offer full support and resolve any queries regarding the report, before and after the purchase.

Our expert team of analysts will offer full support and resolve any queries regarding the report, before and after the purchase.

We employ meticulous research methods, blending advanced analytics and expert insights to deliver accurate, actionable industry intelligence, staying ahead of competitors.

Our skilled analysts offer unparalleled competitive advantage with detailed insights on current and emerging markets, ensuring your strategic edge.

We offer an in-depth yet simplified presentation of industry insights and analysis to meet your specific requirements effectively.

We’re here to help answer any questions about our products and services.

Contact us