Explore Our Diverse Range Of Offerings
From detailed reports to experts services offered in 15+ Industry Domains
Report
Press Release
Blogs
Industry Statistics
Add 2 More Reports For 20% off

Asia Pacific Cosmetics Market Report Overview

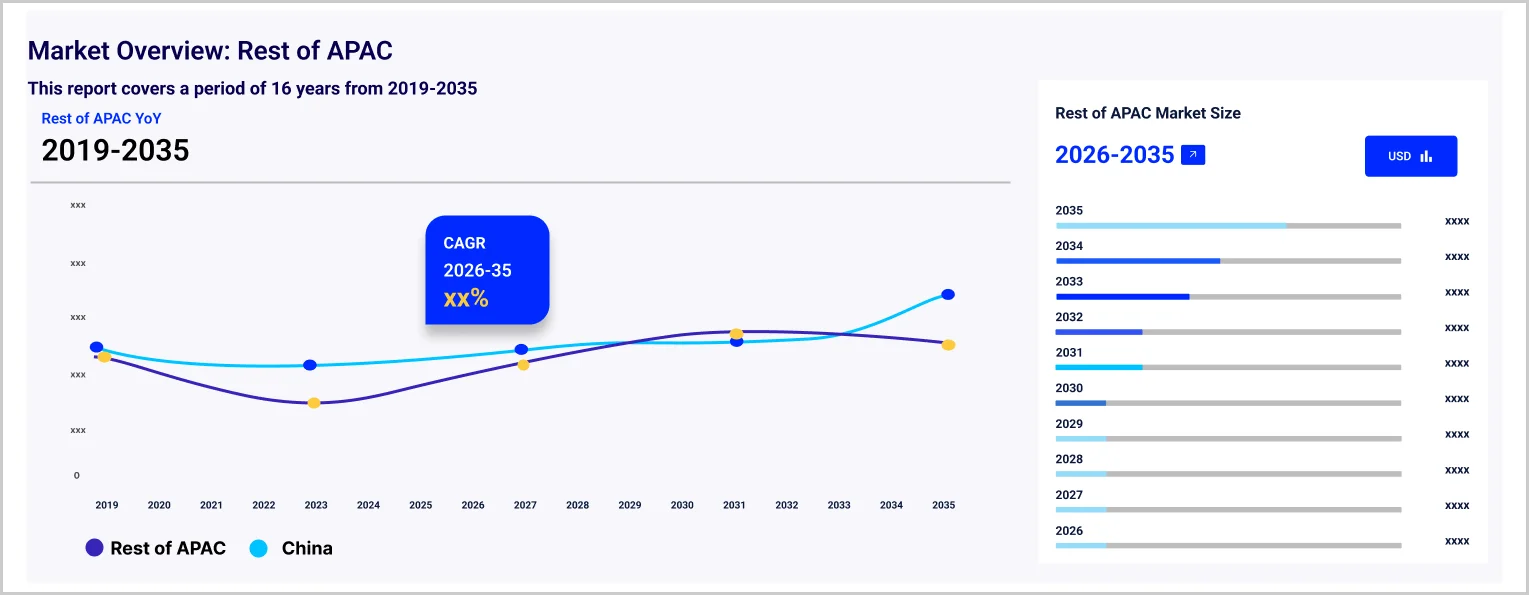
The Asia Pacific cosmetics market size reached USD 102.08 Billion in 2025. The market is expected to grow at a CAGR of 5.02% between 2026 and 2035, reaching USD 166.59 Billion by 2035.

Latest News on the Asia Pacific Cosmetics Market (2026)

April 2026: L’Oréal Reports Strong Q1 Growth Driven by Asia Pacific Cosmetics Demand

In April 2026, L’Oréal reported strong first-quarter revenue growth supported by rising demand across the Asia Pacific Cosmetics Market, particularly in premium skincare, fragrances, makeup, and dermatological beauty products. The company highlighted improving consumer spending trends across China and Southeast Asia, while continued e-commerce expansion and luxury beauty demand helped accelerate regional cosmetics sales growth.

March 2026: L’Oréal Completes Kering Beauté Acquisition to Expand Asia Pacific Luxury Cosmetics Presence

In March 2026, L’Oréal finalized its acquisition of Kering Beauté, including the House of Creed fragrance business and long-term beauty licenses for Balenciaga and Bottega Veneta. Industry experts noted that the move strengthens L’Oréal’s luxury beauty positioning across the Asia Pacific Cosmetics Market, where premium skincare, fragrances, and prestige cosmetics continue witnessing strong consumer demand.

Q1 2026 Market Updates

Geopolitical Impact of Iran, US, and Israel War on the Asia Pacific Cosmetics Market

United States: The Asia Pacific Cosmetics Market, a key segment of the global economy, is experiencing a complex operating environment in Q1 2026 as a direct consequence of the US-Israel-Iran war. 31 force majeure declarations by polymer suppliers, polypropylene and polyethylene price spikes, and chemical manufacturer surcharges of up to 30% are flowing through supply chains. U.S. consumer inflation is projected at 4.2% for 2026, above pre-war forecasts, with fuel costs above USD 4 per gallon compressing household discretionary budgets. Retail supply chains are absorbing the combined impact of 30% higher freight costs, 15-20% packaging material inflation, and rising transport fuel costs, compressing retailer margins. Consumer spending caution is growing as gasoline above USD 4 per gallon and 4.2% projected inflation compress household discretionary budgets.

Iran: Iran's domestic Asia Pacific Cosmetics sector has been effectively suspended by the conflict. US-Israeli strikes on industrial and civilian infrastructure across Tehran, Mashhad, Isfahan, and other major cities have disrupted all commercial activity. Power outages from attacks on electricity generation facilities have halted manufacturing operations, and the collapse of the commercial banking and logistics system has eliminated any residual trade flows. The broader humanitarian crisis, with over 1,900 casualties and 4,000+ civilian buildings damaged, has redirected the entire Iranian economy toward survival rather than production or consumption.

Israel: Israel's Asia Pacific Cosmetics sector is experiencing near-term disruption from wartime conditions. Consumer spending on non-essential categories has declined as millions of Israelis regularly shelter from missile and drone alerts. Supply chain logistics are disrupted by regional airspace closures, elevated war-risk insurance premiums, and the suspension of major carrier services through the region. International business partnerships with Israeli companies have been temporarily suspended. Post-conflict reconstruction and recovery demand is expected to provide meaningful demand acceleration across affected market segments once operational conditions normalise.

2025

Base Year

2019-2025

Historical Period

2026-2035

Forecast Period

  • According to the World Bank, East Asia and the Pacific region account for 1.17 billion women as of 2022.

  • According to data from the General Administration of Customs, the China import volume of beauty cosmetics and toiletries in December 2023 was 8.51 billion yuan.

  • Data from the World Bank revealed GDP per capita of East Asia and the Pacific was about 12,930 dollars as of 2022.

Compound Annual Growth Rate

5.02%

Value in USD Billion

2026-2035


*this image is indicative*

The mass market boosts the Asia Pacific cosmetics market growth due to rising disposable incomes and changing aspirations, the influence of social media, product innovation, retail expansion and urbanisation.

Mass market cosmetics target low- and medium-income populations by focusing more on affordability and accessibility. These products are characterised by their high price competitiveness, targeting consumers with budget-centric mindsets seeking basic skincare, healthcare, and makeup solutions. It provides good value propositions to its consumers by prioritising practicality, convenience, and affordability over luxury.

Companies are significantly working upon international collaborations in order to expand its market reach. For instance, in September 2023, Estee Lauder Companies and New Incubation Ventures invested in Chinese beauty brand Code Mint to prioritise a scientific approach to beauty with its clean skincare line.

Premium cosmetics are positioned at higher price points and provide aspirational superiority to their consumers by offering advanced formulation, luxurious packaging, and exclusive ingredients. They provide high-quality ingredients that do not cause any side effects to consumer skin and provide a sense of assurance to the consumer. They specifically target high-income individuals who are willing to pay the price for quality assurance and branding.

Market Segmentation

Asia Pacific Cosmetics Market Report and Forecast 2026-2035 offers a detailed analysis of the market based on the following segments:

Market Breakup by Product

  • Hair Care
  • Skin and Sun Care
  • Makeup and Colour Cosmetics
  • Fragrances and Deodorants
  • Others

Market Breakup by Gender

  • Male
  • Female
  • Unisex

Market Breakup by Price Range

  • Mass
  • Premium

Market Breakup by Distribution Channel

  • Supermarkets and Hypermarkets
  • Convenience Stores
  • Speciality Stores
  • Online
  • Others

Market Breakup by Region

  • China
  • Japan
  • India 
  • ASEAN
  • Australia
  • Others

Competitive Landscape

The report provides a detailed analysis of the following key players in the market, covering their competitive landscape and the latest developments like mergers and acquisitions, investments, and capacity expansion.

  • L’oreal S.A.
  • The Estée Lauder Companies Inc.
  • Procter & Gamble Co.
  • Beiersdorf AG
  • Groupe Clarins
  • Unilever Plc
  • Kao Corp.
  • Shiseido Co. Ltd.
  • Revlon Inc.
  • Natura & Co.
  • Others

More Insights On

Peru Cosmetics Market

Anti-Aging Cosmetics Market

Anti Acne Cosmetics Market

Dermocosmetics Market

Singapore Cosmetics Market

*While we strive to always give you current and accurate information, the numbers depicted on the website are indicative and may differ from the actual numbers in the main report. At Expert Market Research, we aim to bring you the latest insights and trends in the market. Using our analyses and forecasts, stakeholders can understand the market dynamics, navigate challenges, and capitalize on opportunities to make data-driven strategic decisions.*

Looking for specific insights?

Get in touch with us for a customized solution tailored to your unique requirements and save upto 35%!

Key Questions Answered in the Report

The market was valued at USD 102.08 Billion in 2025.

The market is projected to grow at a CAGR of 5.02% between 2026 and 2035.

The revenue generated from the cosmetics market is expected to reach USD 166.59 Billion in 2035.

Based on gender, the market is divided into male, female and unisex.

The key players in the cosmetics industry are L'Oreal S.A., Estée Lauder Companies Inc., Procter & Gamble Co., Beiersdorf AG, Groupe Clarins, Unilever Plc, Kao Corp., Shiseido Co. Ltd., Revlon Inc., and Natura & Co., among other.

The cosmetic market is categorised based on distribution channels, which include supermarkets and hypermarkets, convenience stores, speciality stores, and online, among others.

Based on the price range, the market is divided into mass and premium categories.

The market based on the product is divided into hair care, skin and sun care, makeup and colour cosmetics, fragrances, deodorants, and others.

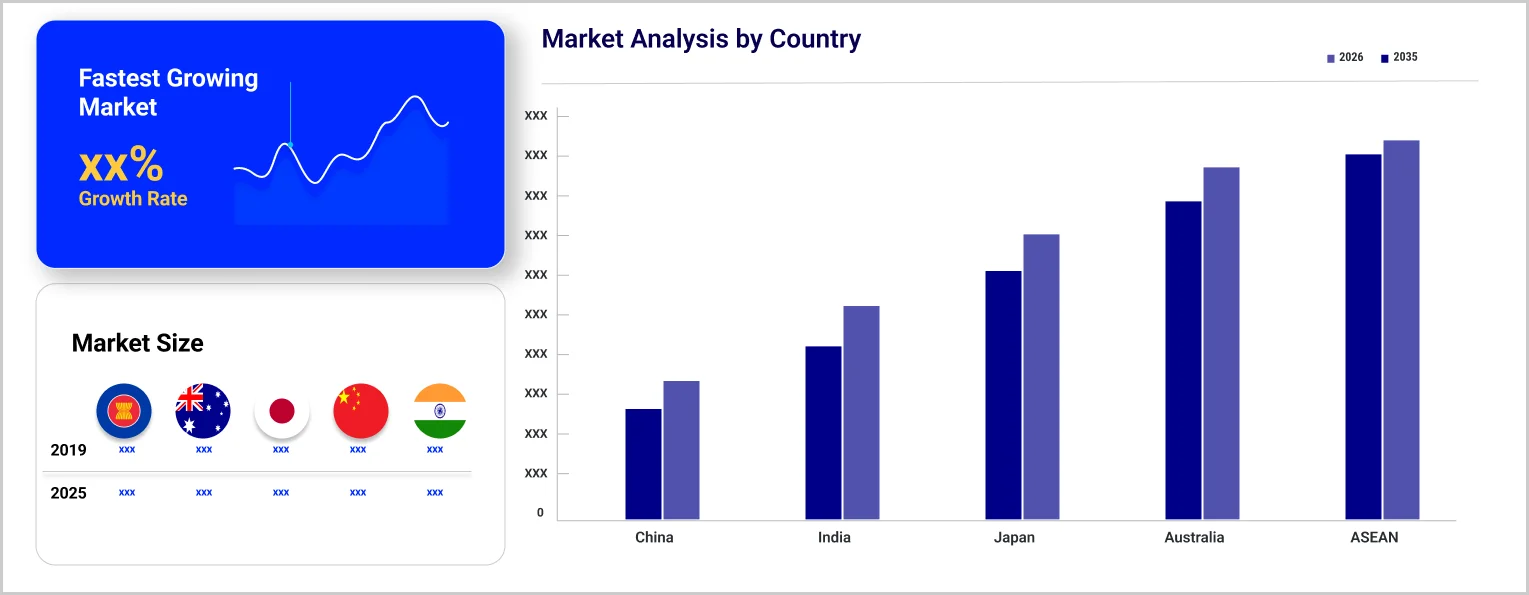
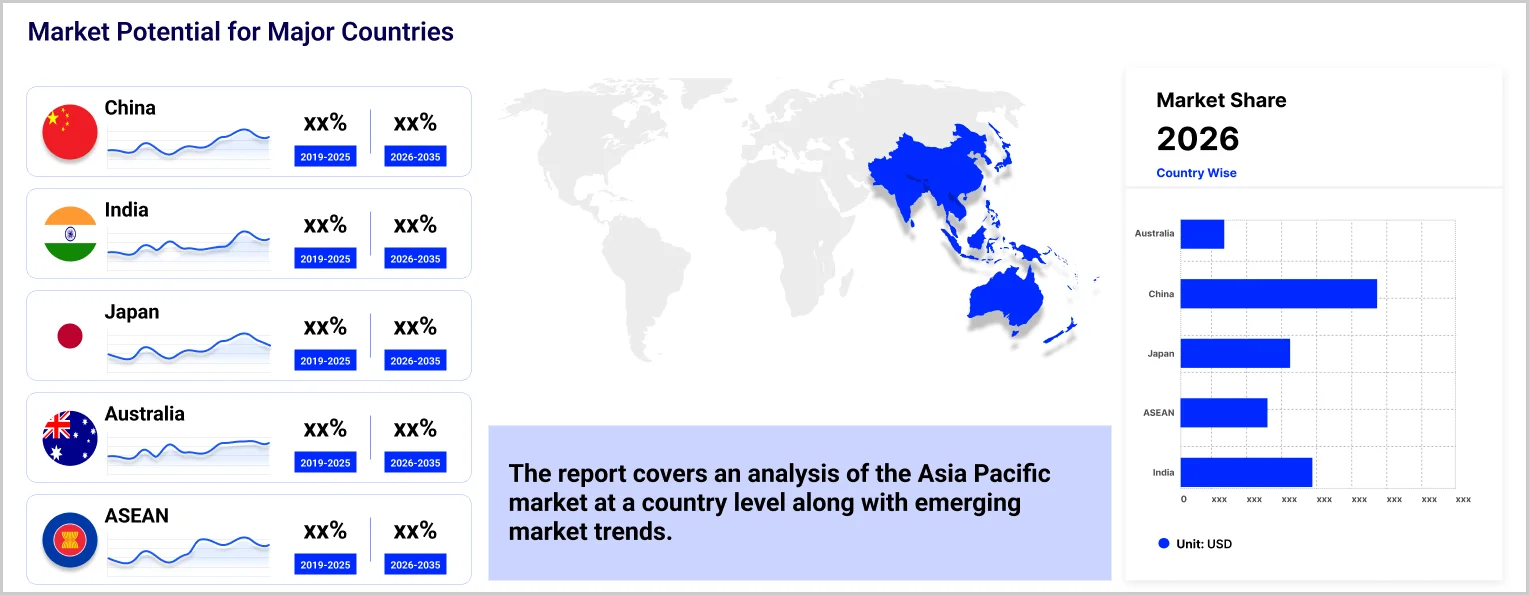
Based on country, the market is broken down into China, Japan, India, ASEAN and Australia.

Report Summary

Explore our key highlights of the report and gain a concise overview of key findings, trends, and actionable insights that will empower your strategic decisions.

Key Highlights of the Report

Please note that the figures mentioned in the description serve as estimates and may vary from the actual figures presented in the final report.

REPORT FEATURES DETAILS
Base Year 2025
Historical Period 2019-2025
Forecast Period 2026-2035
Scope of the Report

Historical and Forecast Trends, Industry Drivers and Constraints, Historical and Forecast Market Analysis by Segment:

  • Product
  • Gender
  • Price Range
  • Distribution Channel
  • Region
Breakup by Product
  • Hair Care
  • Skin and Sun Care
  • Makeup and Colour Cosmetics
  • Fragrances and Deodorants
  • Others
Breakup by Gender
  • Male
  • Female
  • Unisex
Breakup by Price Range
  • Mass
  • Premium
Breakup by Distribution Channel
  • Supermarkets and Hypermarkets
  • Convenience Stores
  • Speciality Stores
  • Online
  • Others
Breakup by Region
  • China
  • Japan
  • India 
  • ASEAN
  • Australia
  • Others
Market Dynamics
  • SWOT Analysis
  • Porter's Five Forces Analysis
  • Key Indicators for Demand
  • Key Indicators for Price
Competitive Landscape
  • Market Structure
  • Company Profiles
    • Company Overview
    • Product Portfolio
    • Demographic Reach and Achievements
    • Certifications
Companies Covered
  • L’oreal S.A.
  • The Estée Lauder Companies Inc.
  • Procter & Gamble Co.
  • Beiersdorf AG
  • Groupe Clarins
  • Unilever Plc
  • Kao Corp.
  • Shiseido Co. Ltd.
  • Revlon Inc.
  • Natura & Co.
  • Others

Single User License

10 % Off

USD

3,999

3,599

Datasheet

10 % Off

USD

2,499

2,249

Five User License

15 % Off

USD

4,999

4,249

Corporate License

15 % Off

USD

5,999

5,099

Single User License

One User

USD 3,999

USD 3,599

tax inclusive*

  • All Segments
  • Printing Restrictions
  • PDF Delivered via Email
  • Custom Report Layout
  • Post Sales Analysts Support
  • Periodic Updates
  • Unlimited Prints

Datasheet

One User

USD 2,499

USD 2,249

tax inclusive*

  • Selected Segments
  • Printing Restrictions
  • Excel Spreadsheet Delivered via Email
  • Full Report
  • Periodic Updates
  • Post Sales Analysts Support
  • Unlimited Prints

Five User License

Five User

USD 4,999

USD 4,249

tax inclusive*

  • All Segments
  • Five Prints Available
  • PDF Delivered via Email
  • Limited Free Customization
  • Post Sales Analyst Support
  • Custom Report Layout
  • Periodic Updates
  • Unlimited Prints

Corporate License

Unlimited Users

USD 5,999

USD 5,099

tax inclusive*

  • All Segments
  • Unlimited Prints Available
  • PDF & Excel Delivery via Email
  • Limited Free Customization
  • Post Sales Analysts Support
  • Discount On Next Update
  • Custom Report Layout

*Please note that the prices mentioned below are starting prices for each bundle type. Kindly contact our team for further details.*

Bundle Type

Flash Bundle

20% OFF Number of Reports: 3

Small Business Bundle

25% OFF Number of Reports: 5

Growth Bundle

30% OFF Number of Reports: 8

Enterprise Bundle

35% OFF Number of Reports: 10
Overview
  • Life Time Access
  • Analyst Support Related to Report
  • PDF Version of the Report
  • Complimentary Excel Data Set
  • Free Analyst Hours
  • Complimentary Free 1 Month Subscription to Trade Data Base
  • Complimentary One Month Subscription to Price Database (Chemicals only)
  • Complimentary PPT Version of the Report
  • Complimentary License Upgrade
  • Complimentary Power BI Dashboards
  • Life Time Access
  • Analyst Support Related to Report
  • PDF Version of the Report
  • Complimentary Excel Data Set
  • Free Analyst Hours - 50 Hours
  • Complimentary Free 1 Month Subscription to Trade Data Base
  • Complimentary One Month Subscription to Price Database (Chemicals only)
  • Complimentary PPT Version of the Report
  • Complimentary License Upgrade
  • Complimentary Power BI Dashboards
  • Life Time Access
  • Analyst Support Related to Report
  • PDF Version of the Report
  • Complimentary Excel Data Set
  • Free Analyst Hours - 80 Hours
  • Complimentary Free 1 Month Subscription to Trade Data Base
  • Complimentary One Month Subscription to Price Database (Chemicals only)
  • Complimentary PPT Version of the Report
  • Complimentary License Upgrade
  • Complimentary Power BI Dashboards
  • Life Time Access
  • Analyst Support Related to Report
  • PDF Version of the Report
  • Complimentary Excel Data Set
  • Free Analyst Hours - 100 Hours
  • Complimentary Free 1 Month Subscription to Trade Data Base
  • Complimentary One Month Subscription to Price Database (Chemicals only)
  • Complimentary PPT Version of the Report
  • Complimentary License Upgrade
  • Complimentary Power BI Dashboards

*Please note that the prices mentioned below are starting prices for each bundle type. Kindly contact our team for further details.*

Flash Bundle

Number of Reports: 3

20%

tax inclusive*

  • 3 Reports Included
  • Life Time Acess
  • Analyst Support Related to Report
  • PDF Version of the Report
  • Free 1 Month Subscription to Trade Data Base
  • 1 Month Subscription to Price Database (Chemicals only)
  • Complimentary Excel Data Set
  • PPT Version of the Report
  • Power BI Dashboards
  • License Upgrade
  • Free Analyst Hours

Small Business Bundle

Number of Reports: 5

25%

tax inclusive*

  • 5 Reports Included
  • Life Time Acess
  • Analyst Support Related to Report
  • PDF Version of the Report
  • Complimentary Excel Data Set
  • Free Analyst Hours - 50 Hours
  • Free 1 Month Subscription to Trade Data Base
  • 1 Month Subscription to Price Database (Chemicals only)
  • Complimentary Excel Data Set
  • PPT Version of the Report
  • Power BI Dashboards
  • License Upgrade

Growth Bundle

Number of Reports: 8

30%

tax inclusive*

  • 8 Reports Included
  • Life Time Acess
  • Analyst Support Related to Report
  • PDF Version of the Report
  • Complimentary Excel Data Set
  • Free Analyst Hours - 50 Hours
  • Free 1 Month Subscription to Trade Data Base
  • 1 Month Subscription to Price Database (Chemicals only)
  • License Upgrade
  • Free Analyst Hours - 80 Hours
  • Power BI Dashboards

Enterprise Bundle

Number of Reports: 10

35%

tax inclusive*

  • 10 Reports Included
  • Life Time Acess
  • Analyst Support Related to Report
  • PDF Version of the Report
  • Complimentary Excel Data Set
  • Free Analyst Hours - 50 Hours
  • Free 1 Month Subscription to Trade Data Base
  • 1 Month Subscription to Price Database (Chemicals only)
  • License Upgrade
  • Power BI Dashboards
  • Free Analyst Hours - 100 Hours

How To Order

This is a collaborative report by Avni Johari and Ketan Gandhi reflecting perspectives and research-driven insights from Expert Market Research.

Our step-by-step guide will help you select, purchase, and access your reports swiftly, ensuring you get the information that drives your decisions, right when you need it.

License Type

Select License Type

Choose the right license for your needs and access rights.

shopping cart

Click on ‘Buy Now’

Add the report to your cart with one click and proceed to register.

Bookmark Icon

Select Mode of Payment

Choose a payment option for a secure checkout. You will be redirected accordingly.

Strategic Solutions for Informed Decision-Making

Connect For More Information

Our expert team of analysts will offer full support and resolve any queries regarding the report, before and after the purchase.

Our expert team of analysts will offer full support and resolve any queries regarding the report, before and after the purchase.

We employ meticulous research methods, blending advanced analytics and expert insights to deliver accurate, actionable industry intelligence, staying ahead of competitors.

Our skilled analysts offer unparalleled competitive advantage with detailed insights on current and emerging markets, ensuring your strategic edge.

We offer an in-depth yet simplified presentation of industry insights and analysis to meet your specific requirements effectively.

We’re here to help answer any questions about our products and services.

Contact us