

Consumer Insights
Uncover trends and behaviors shaping consumer choices today
Procurement Insights
Optimize your sourcing strategy with key market data
Industry Stats
Stay ahead with the latest trends and market analysis.
The Asia Pacific sleepwear market size was valued at USD 5.43 Billion in 2025. The industry is expected to grow at a CAGR of 11.60% during the forecast period of 2026-2035 to reach a value of USD 16.27 Billion by 2035. The increasing use of strategic brand collaborations and licensed IP partnerships to enhance product appeal and reach diverse consumer segments is boosting the market growth.
Asia Pacific sleepwear market expansion is being driven by the rise in consumers' desire for comfortable and stylish clothing that can be a part of their daily lives. Initially, sleepwear was only associated with bedtime, but now the range of designs inspired by athleisure has made it suitable for casual lounging, travel, etc. Also, the growing usage of digital shopping platforms enables brands to connect with more customers and give personalized experiences, thereby facilitating overall market growth and increasing brand loyalty between the premium and mid-tier segments.
Leading brands in the Asia Pacific sleepwear market are collaborating with renowned pop culture figures and lifestyle IP to make their sleepwear more fashionable and approachable. Consequently, this has turned sleepwear from simple clothing to a form of self-expression that the younger generation is particularly attracted to. These kinds of partnerships enable the sleepwear lines to be distinguished, raise brand recognition, and trigger more demand even in a highly competitive market.
For instance, in July 2024, Clovia partnered with the cartoon character Garfield to launch a fun sleepwear line with Garfield images printed on 100% cotton T-shirts and pajama pants aimed at comfort-seeking millennials and Gen Z. Clovia broadcasted the news on its social media, effectively combining pop culture nostalgia with practical clothing design. Meanwhile, global lifestyle giant UNIQLO came up with new ways to improve its AIRism and LifeWear product ranges that include garments made of breathable fabric and designed for optimum comfort in addition to being ideal for sleepwear and loungewear.
China's textile and apparel exports rose to approximately USD 67 billion in the first quarter of 2026, signalling a steady recovery after a weak 2025 and reinforcing Asia's manufacturing leadership. A noticeable uptick in yarn and fabric imports points to raw material restocking by mills serving downstream sleepwear producers across the region, supporting wider product availability and competitive pricing for branded nightwear collections, as reported by Nikkei Asia.
The Intertextile Shanghai Home Textiles Spring Edition, held from 11 to 13 March 2026 at the National Exhibition and Convention Center, gathered more than 360 exhibitors showcasing sustainable bedding, smart fabrics and sleep-oriented innovations. Reflecting China's rapidly evolving sleep economy, the fair introduced a dedicated Sleep Aid Display Area, accelerating product development across the region's sleepwear and home comfort segment, according to the South China Morning Post.
India, Bangladesh, and China are at the forefront of textile manufacturing and commerce.
China stands as the largest e-commerce market globally, with the Alibaba group's e-commerce branches Taobao, Alibaba.com, and Tmall leading the way.
By 2032, it is projected that the Asia Pacific digital advertising market will achieve a value of US$ 365.8 billion, demonstrating a CAGR of 7.37%.
Compound Annual Growth Rate
11.6%
Value in USD Billion
2026-2035
| Asia Pacific Sleepwear Market Report Summary | Description | Value |
| Base Year | USD Billion | 2025 |
| Historical Period | USD Billion | 2019-2025 |
| Forecast Period | USD Billion | 2026-2035 |
| Market Size 2025 | USD Billion | 5.43 |
| Market Size 2035 | USD Billion | 16.27 |
| CAGR 2019-2025 | Percentage | XX% |
| CAGR 2026-2035 | Percentage | 11.60% |
| CAGR 2026-2035 - Market by Country | India | 12.8% |
| CAGR 2026-2035 - Market by Country | China | 11.9% |
| CAGR 2026-2035 - Market by End Use | Women | 12.9% |
| CAGR 2026-2035 - Market by Distribution Channel | Online Channels | 19.6% |
| 2025 Market Share by Country | Australia | 4.8% |
Trent Limited, parent of Westside which retails sleepwear and loungewear, reported FY26 consolidated revenue of Rs 20,074 crore (up 17% YoY) at its April 22, 2026 board meeting. The Tata Group company added 60 Westside and 212 Zudio outlets during FY26, taking its total fashion footprint to 1,286 stores across 321 cities.
Apparel Group announced a strategic partnership with Cotton On on February 17, 2026 to launch the Australian fashion and lifestyle brand — whose assortment spans sleepwear and loungewear — across India through a phased omnichannel model. Apparel Group operates 300+ stores across 50 Indian cities, while Cotton On runs 1,300 stores in over 20 countries.
Cosmopolitan India published a feature on January 13, 2026 on the rise of homegrown sleepwear and loungewear labels, citing Anush Jain (Co-founder, Life & Jam) and Umashan Naidoo (Head Customer and Beauty, Westside), reflecting the category's transformation into a design-led, lifestyle-oriented Indian apparel segment.
Asia Pacific has emerged to be a lucrative destination for premium lifestyle labels, where comfort, fabric innovation, and experiential branding are the core elements. Airlines, hospitality groups, and lifestyle brands are shifting the perspective of sleepwear towards wellness and travel comfort rather than solely as an at-home wear category. This is a crucial trend in the Asia Pacific sleepwear market that helps in supporting higher-value demand and material-led differentiation in the whole region. For instance, in January 2024, Emirates brought out premium business class loungewear, produced from a breathable modal fabric, which amplifies sleepwear's premium, reusable, and lifestyle-oriented appeal across Asia Pacific travel corridors.
The increasing emphasis on premiumization and design-led collaborations is turning around the global sleepwear market by changing the perception of nightwear from a lifestyle and home-centric apparel category to a necessity. Brands are working with top-quality materials, creating coordinated collections, and forging cross-category partnerships to boost emotional value, durability, and everyday relevance. These tactics lead to repeat purchases, justify the price increase, and broaden consumer engagement across age groups and usage occasions. For instance, in December 2025, Hanna Andersson joined hands with Oeuf to bring out a design-oriented sleepwear line, thus giving a strong reinforcement to this premium, lifestyle-driven market shift.
The Asia Pacific sleepwear market is expanding at a fast pace as more brands are transforming sleepwear from a mere necessity to a lifestyle and experiential product. It shows the creative ways in which the clothing lines are merged with pop culture and themed merchandise through the collaborations of renowned brands like Starbucks Japan x Gelato Pique. These initiatives not only increase customer engagement but also drive premium purchases and enhance brand loyalty, hence collectively leading to market growth by uniting comfort, style, and retail experiential trends.
Strategic brand collaborations and omnichannel distribution are becoming the main growth drivers for the sleepwear market in the Asia Pacific region. Through collaborations with popular brands, companies not only increase the attractiveness of their products but also make the products available to a larger audience, and therefore, they create unique consumer value propositions. Launching products simultaneously online and offline allows customers to get to know the product through the quality in-store experience while also having the support of convenience and accessibility, thus a stronger market penetration. For example, 6IXTY8IGHT teamed up with Chupa Chups in August 2024 to offer an exclusive summer collection in Indonesia.
The demand in the Asia Pacific sleepwear market is witnessing a rise because of brands constantly innovating and expanding their product ranges to cater to various consumer preferences. Companies are launching new lines that combine comfort, style, and functionality, which are attracting both the casual and upscale segments. Besides that, top-rated sleepwear brands are introducing eye masks and other accessories of the same line to make the overall experience of using their products more enjoyable. For instance, in May 2024, Selenightco, a local luxury sleepwear brand, celebrated its 3-year anniversary by launching new sleepwear styles and 100% mulberry silk eye masks. These products are sold both online and in-store, thereby reinforcing the loyalty of customers and extending the market footprint.
The EMR’s report titled “Asia Pacific Sleepwear Market Report and Forecast 2026-2035” offers a detailed analysis of the market based on the following segments:
Market Breakup by End User
Key Insights: The Asia Pacific sleepwear market caters to into men, women, and kids, each segment driving growth through specific products. Women's sleepwear leads the market in demand, as brands like Marks & Spencer, H&M, and Victoria's Secret are coming up with cozy, fashionable collections that target the lifestyle-conscious consumers. Men's sleepwear is gaining popularity with casual and sportswear designs by Hanesbrand, Jockey International, and Bonds. Kids' sleepwear is witnessing growth through character-themed designs and safe fabrics from licensed collections, which attract both parents and children, thus increasing the market coverage.
Market Breakup by Distribution Channel
Key Insights: Distribution channels in the Asia Pacific sleepwear market are going through a growth spurt that includes hypermarkets/supermarkets, online channels, and others. Hypermarkets/supermarkets like Reliance Retail and Aditya Birla Fashion and Retail are taking care of product visibility on a massive scale. Online channels such as Amazon, Myntra, and Zalora are main contributors to direct consumer launches and unique sleepwear collections of Uniqlo, H&M, and Trent Limited. Others, including brand-owned stores and specialty outlets, are the places where premium lines can cater to the niche segments, thus increasing market penetration and brand recognition simultaneously in the entire region.
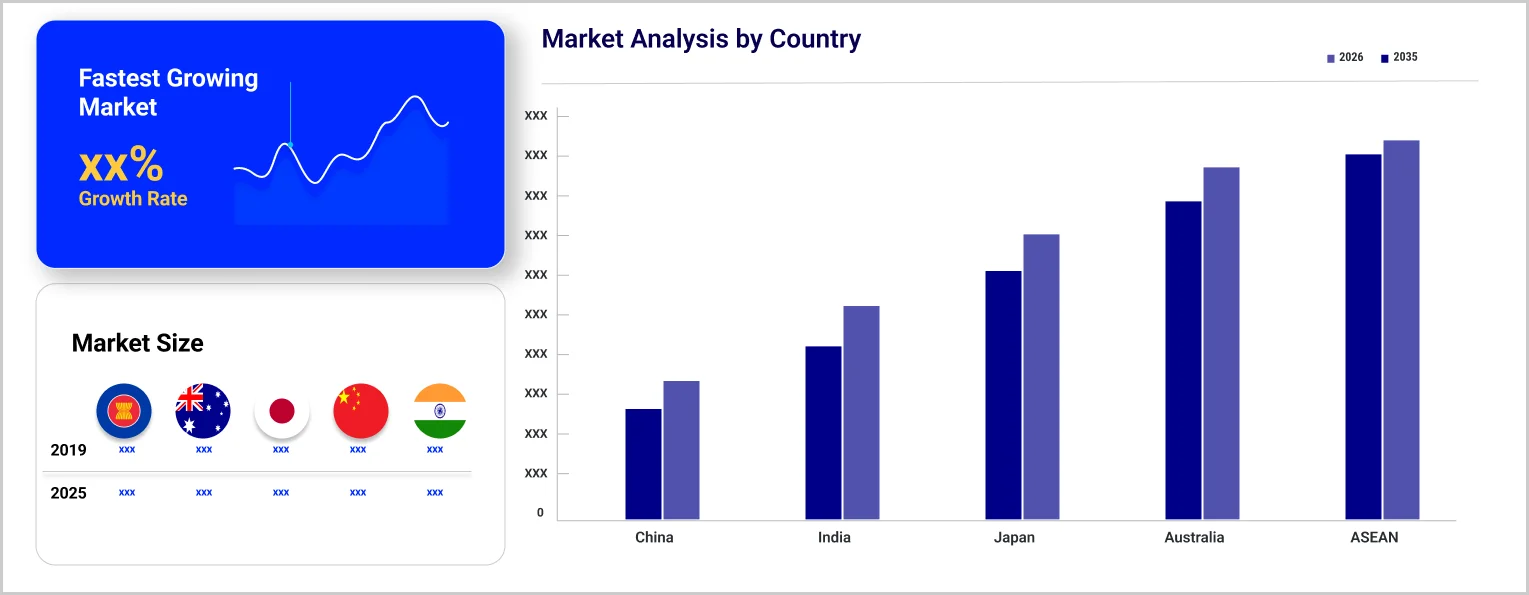
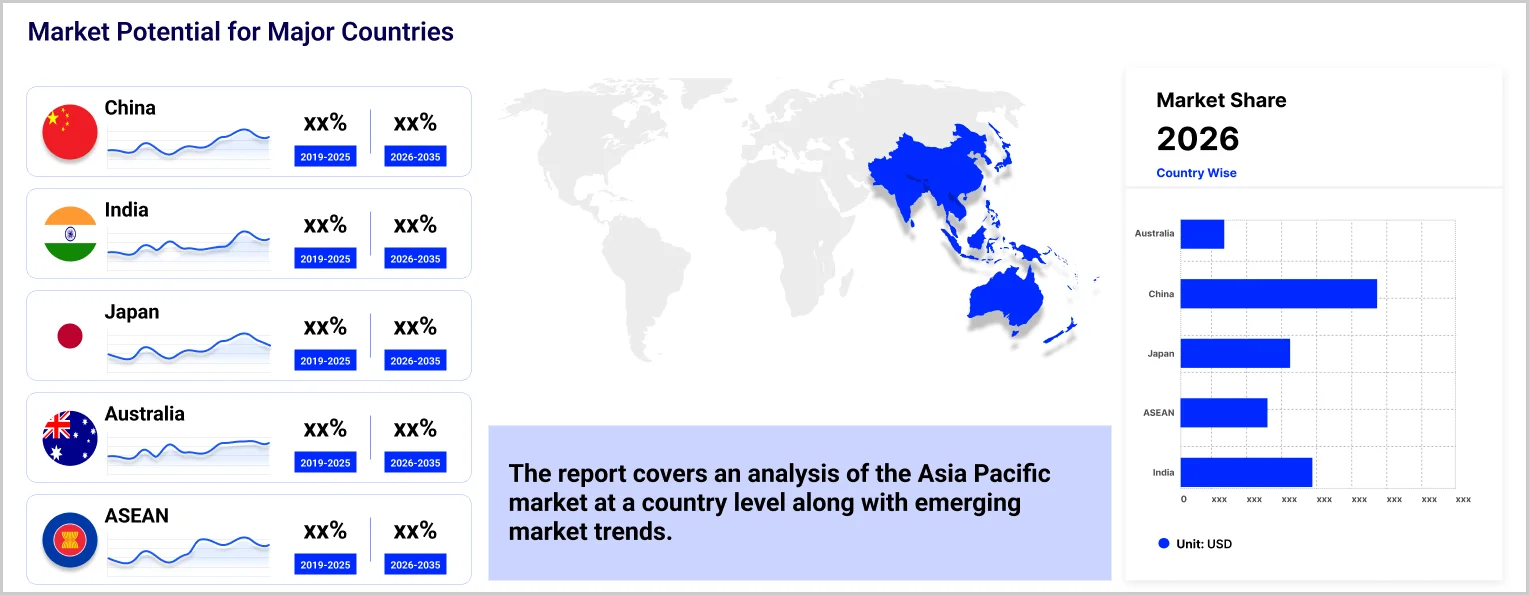
Market Breakup by Country
Key Insights: The Asia Pacific sleepwear market landscape is divided into different regions, namely China, Japan, India, ASEAN, Australia, and others, all of them have a unique set of factors driving the market growth in each one. The China market is thriving from e-commerce and continuous innovation that especially benefits brands such as Page Industries and Victoria's Secret. Japan remains a very loyal market for high-quality lifestyle sleepwear items from MUJI and Calvin Klein. The Indian market is rapidly developing with brands PURPLE PANDA FASHIONS and Rupa & Company, which are well supported by the retail sector. For the ASEAN markets, the factors influencing the growth are an increase in disposable income and urbanization, whereas in Australia, there is a stable demand led by Bonds and Hanes Australasia, and the other smaller countries contribute only a minor share.
| CAGR 2026-2035 - Market by | Country |
| India | 12.8% |
| China | 11.9% |
| Japan | XX% |
| ASEAN | XX% |
| Australia | XX% |
| Others | XX% |
By end-user, women show robust growth driven by wellness-focused sleepwear adoption
The Asia Pacific sleepwear market witnesses significant demand from women as the consumers are progressively turning to nightwear that offers a combination of comfort, wellness, and functional performance. Market players are investing in technologies and materials that are environmentally friendly and innovations that are design-led to cater to the needs of sleep quality, temperature control, and recovery. This change is leading to health-oriented feature integration into regular sleepwear. In April 2024, DAGi partnered with CELLIANT® to launch women’s sleepwear sets using infrared-infused CELLIANT® Viscose fabric designed to support restorative sleep and physical recovery.
As customers begin to associate sleepwear with lifestyle requirements rather than just a basic garment, the shift towards branded men's essentials is growing the revenue of the Asia Pacific sleepwear market. The increase in preference for comfort, quality, and brand assurance is motivating established menswear players to bring this mostly unbranded category into the formal market. This strategy also enables brands to extend wardrobe relevance beyond occasion wear and drive repeat purchases. For example, in October 2024, Raymond Lifestyle Limited launched Sleepz by Raymond, positioning men’s sleepwear as a core growth pillar and targeting significant revenue contribution by FY2027.
By distribution channel, online category amasses significant revenue amid premium and lifestyle positioning
The online distribution channel accounts for a significant share of the Asia Pacific sleepwear market is rapidly becoming a significant growth driver as upscale sleepwear brands use D2C platforms as well as the existing marketplaces to grow at a higher pace, have more control over their brand storytelling, and reach digitally savvy consumers. E-commerce allows highly targeted marketing, fast product launches, and obtaining consumer feedback directly, which is very effective for lifestyle categories such as sleepwear. This strategy is reflected in Ammarzo’s expansion into luxury sleepwear, launched exclusively via its D2C website and Myntra in 2024, reinforcing the role of online channels in accelerating category penetration and revenue growth.
The supermarket and hypermarket hold the largest share of the Asia Pacific sleepwear market sales through the provision of affordable, mass-market nightwear by means of high-traffic retail formats. Major players like Walmart, Carrefour, Tesco, Reliance Retail, and AEON are extending their private-label sleepwear collections to meet the requirements of price-sensitive consumers and families. Due to their scale, they can offer competitive prices, seasonal assortments, and frequent promotions, while their vast store networks and in-store visibility make sleepwear a regular lifestyle purchase rather than just an occasional apparel buy.
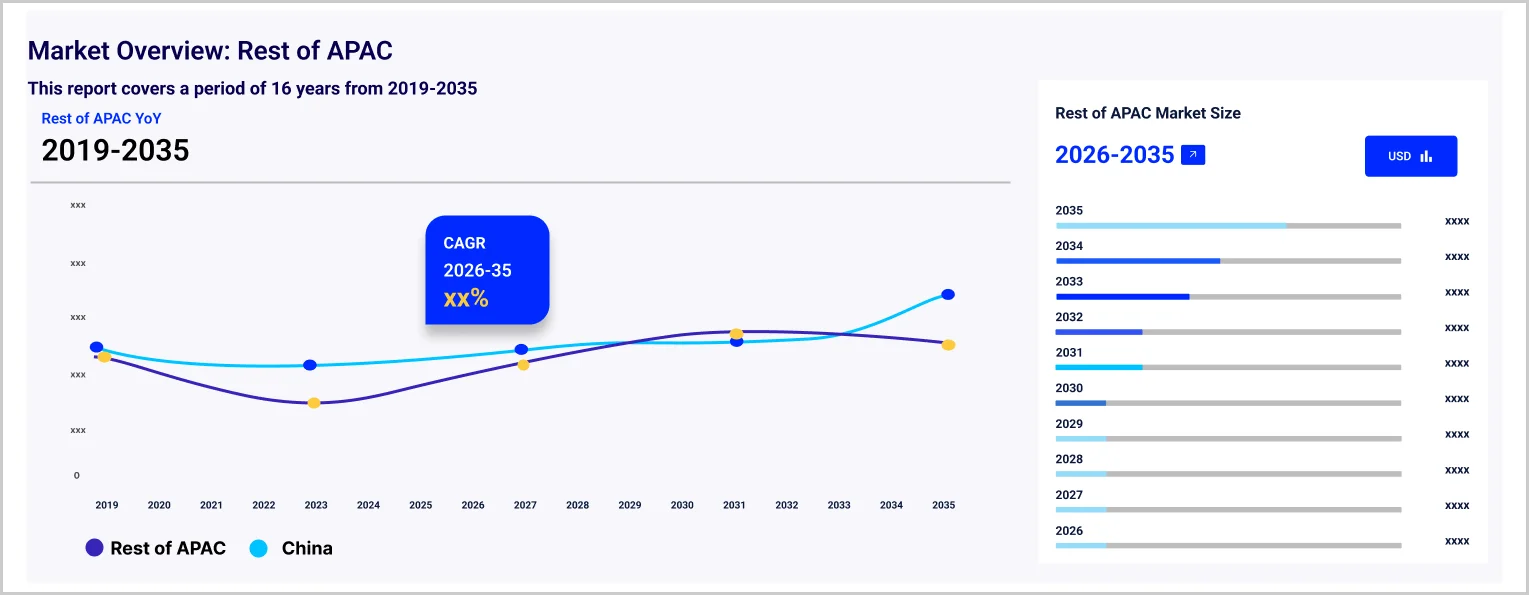
By country, China leads the market growth driven by strong consumer shift toward sustainable home-wear
China leads the demand in the Asia Pacific sleepwear market driven by the consistent demand among younger and urban families, and is catering to the enhanced consumer preference in China for comfort-centric, breathable, and sustainably manufactured sleepwear. To satisfy the growing demand for homewear that is not only comfortable but also stylish in a subtle way, market players are embracing natural fibers, functional silhouettes, and wellness-oriented positioning. This movement is also demonstrated by Unusual Babe Undercover's January 2026 product launch, where they unveiled a cotton-based sleepwear and loungewear collection that focuses on ethical sourcing and improved breathability.
| 2025 Market Share by | Country |
| Australia | 4.8% |
| China | XX% |
| Japan | XX% |
| India | XX% |
| ASEAN | XX% |
| Others | XX% |
ASEAN significantly fuels the Asia Pacific sleepwear market growth with a pronounced shift in the demand pattern for sustainable and performance-driven sleep and home textile products. Manufacturers and brands are increasingly adopting circular fibers to meet both the evolving consumer and the export market expectations. ASEAN’s role as a major textile manufacturing hub makes innovation in breathable, moisture-managing, and eco-friendly materials commercially critical. This trend is reinforced by Eastman Naia™ expanding its All Night Comfort platform with Naia™ Renew-based bedding fills and sleepwear at Heimtextil 2026 in the month of January, strengthening sustainable textile adoption across regional supply chains.
Asia Pacific sleepwear market players are consolidating the overall sleepwear market through the launching of branded portfolios, lifestyle positioning investments, and targeting underpenetrated segments. Traditionally, fashion apparel companies are moving away from seasonal fashion towards essential-driven categories, focusing on comfort, fabric innovation, and everyday utility. Smart brand extensions, mass premium pricing, and a broader offline footprint are the main tools that companies are using to formalize demand in largely unorganized markets and to accelerate category premiumization.
Besides that, top sleepwear companies in Asia Pacific are taking advantage of digital channels, data-led merchandising, and faster product refresh cycles to meet consumers' needs that keep changing. Omnichannel distribution investments, influencer-led visibility, and targeted regional expansion are some ways that are enhancing customer reach and brand recall. At the same time, collaborations with fabric technology partners and focused marketing around wellness and sleep quality are reinforcing sleepwear’s shift toward a lifestyle-oriented product category, thereby fueling the Asia Pacific sleepwear market expansion.
Marks and Spencer Group Plc is one of the major British retailers, which was established in 1884. Today, its head office is situated in London, United Kingdom. The company mainly operates in clothing, home products, and food areas. Besides a wide range of sleepwear and lifestyle apparel that combines comfort with top quality, it also offers these products.
Page Industries Limited was established in 1994, and its head office is in Mysuru, India. The company is the wholly owned licensee of Jockey International in India, Sri Lanka, Nepal, Bangladesh, and the United Arab Emirates. It produces and markets innerwear, loungewear, and sleepwear, highly focusing on the innovation and quality of fabrics.
Reliance Industries Limited is the leading conglomerate in the petrochemical, retail, and textile sectors. Established in 1966, the company has its corporate office in Mumbai, India. In the lifestyle and apparel segment, the company concentrates on sleepwear and casual wear, thus staying close to the ever-changing needs of Indian consumer markets and emerging as a leading firm in the Asia Pacific sleepwear market.
Purple Panda Fashions Limited, established in 2015 and headquartered in Mumbai, India, is a company that principally deals in women's and men's apparel, including sleepwear and loungewear. The company brands its products as trendy and comfort-driven, and it has been gradually gaining its market share in the Indian fashion retail sector.
*Please note that this is only a partial list; the complete list of key players is available in the full report. Additionally, the list of key players can be customized to better suit your needs.*
Other players in the market include Trent Limited, Private Lives, The Kaftan Company, XYXX, Lunya, and Leela Hospitality Pvt. Ltd., among others.
Explore the latest trends shaping the Asia Pacific Sleepwear Market 2026-2035 with our in-depth report. Gain strategic insights, future forecasts, and key market developments that can help you stay competitive. Download a free sample report or contact our team for customized consultation on Asia Pacific sleepwear market trends 2026.
Upto 15% Off
USD
$2499 $2249
$3999 $3599
$4999 $4249
$5999 $5099


*While we strive to always give you current and accurate information, the numbers depicted on the website are indicative and may differ from the actual numbers in the main report. At Expert Market Research, we aim to bring you the latest insights and trends in the market. Using our analyses and forecasts, stakeholders can understand the market dynamics, navigate challenges, and capitalize on opportunities to make data-driven strategic decisions.*
The market is projected to grow at a CAGR of 11.60% between 2026 and 2035.
Key strategies driving the market include expanding into high-growth markets, strategic brand collaborations and licensing partnerships, innovative comfort-focused products, and omnichannel distribution to enhance reach and consumer engagement.
The key trends aiding the market expansion include the rising use of sustainable production practices and growing number of social media influencers.
The major countries considered in the market are China, Japan, India, ASEAN, and Australia, among others.
The different end users of sleepwear include men, women, and kids.
The key players in the market include Marks and Spencer Group Plc, Page Industries Limited, Reliance Industries Limited, PURPLE PANDA FASHIONS LIMITED, Trent Limited, Private Lives, The Kaftan Company, XYXX, Lunya, and Leela Hospitality Pvt. Ltd., among others
In 2025, the Asia Pacific sleepwear market reached an approximate value of USD 5.43 Billion.
The market is estimated to witness a healthy growth in the forecast period of 2026-2035 to reach about USD 16.27 Billion by 2035.
Challenges include intense competition, rapidly changing consumer preferences, supply chain disruptions, and diverse regulatory requirements across the region.
Explore our key highlights of the report and gain a concise overview of key findings, trends, and actionable insights that will empower your strategic decisions.
| REPORT FEATURES | DETAILS |
| Base Year | 2025 |
| Historical Period | 2019-2025 |
| Forecast Period | 2026-2035 |
| Scope of the Report |
Historical and Forecast Trends, Industry Drivers and Constraints, Historical and Forecast Market Analysis by Segment:
|
| Breakup by End User |
|
| Breakup by Distribution Channel |
|
| Breakup by Region |
|
| Market Dynamics |
|
| Competitive Landscape |
|
| Companies Covered |
|
Datasheet
One User
USD 2,499
USD 2,249
tax inclusive*
Single User License
One User
USD 3,999
USD 3,599
tax inclusive*
Five User License
Five User
USD 4,999
USD 4,249
tax inclusive*
Corporate License
Unlimited Users
USD 5,999
USD 5,099
tax inclusive*
*Please note that the prices mentioned below are starting prices for each bundle type. Kindly contact our team for further details.*
Flash Bundle
Small Business Bundle
Growth Bundle
Enterprise Bundle
*Please note that the prices mentioned below are starting prices for each bundle type. Kindly contact our team for further details.*
Flash Bundle
Number of Reports: 3
20%
tax inclusive*
Small Business Bundle
Number of Reports: 5
25%
tax inclusive*
Growth Bundle
Number of Reports: 8
30%
tax inclusive*
Enterprise Bundle
Number of Reports: 10
35%
tax inclusive*
How To Order

Select License Type
Choose the right license for your needs and access rights.

Click on ‘Buy Now’
Add the report to your cart with one click and proceed to register.

Select Mode of Payment
Choose a payment option for a secure checkout. You will be redirected accordingly.
Strategic Solutions for Informed Decision-Making
Gain insights to stay ahead and seize opportunities.

Get insights & trends for a competitive edge.

Track prices with detailed trend reports.

Analyse trade data for supply chain insights.

Leverage cost reports for smart savings

Enhance supply chain with partnerships.

Connect For More Information
Our expert team of analysts will offer full support and resolve any queries regarding the report, before and after the purchase.
Our expert team of analysts will offer full support and resolve any queries regarding the report, before and after the purchase.
We employ meticulous research methods, blending advanced analytics and expert insights to deliver accurate, actionable industry intelligence, staying ahead of competitors.
Our skilled analysts offer unparalleled competitive advantage with detailed insights on current and emerging markets, ensuring your strategic edge.
We offer an in-depth yet simplified presentation of industry insights and analysis to meet your specific requirements effectively.


