

Consumer Insights
Uncover trends and behaviors shaping consumer choices today
Procurement Insights
Optimize your sourcing strategy with key market data
Industry Stats
Stay ahead with the latest trends and market analysis.
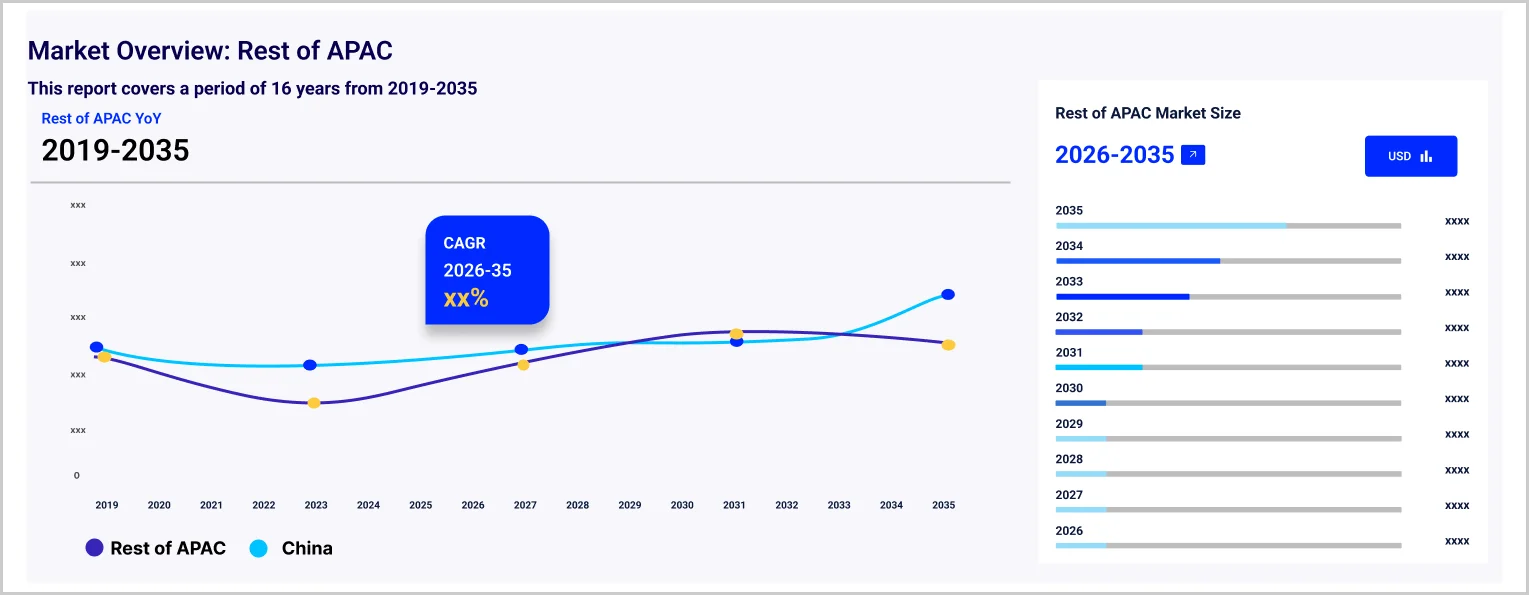
The Asia Pacific tablet market reached approximately 41.24 Million Units in 2025. The market is projected to grow at a CAGR of 7.40% between 2026 and 2035, reaching a volume of around 84.21 Million Units by 2035.
It is projected that by the year 2030, the internet economy of Southeast Asia will attain a value of $1 trillion, propelled by a rapidly expanding population of digital consumers and applications.
In 2023, the government of Uttar Pradesh in India set aside a budget of Rs 3,600 crore for providing tablets and smartphones free of charge to the younger generation.
In 2022, the Chinese Ministry of Industry and Information Technology reported that the country led in terms of production and sales of consumer electronics, buoyed by its brand-building capacity and innovations.
Compound Annual Growth Rate
7.4%
Value in Million Units
2026-2035
| Asia Pacific Tablet Market Report Summary | Description | Value |
| Base Year | Million Units | 2025 |
| Historical Period | Million Units | 2019-2025 |
| Forecast Period | Million Units | 2026-2035 |
| Market Size 2025 | Million Units | 41.24 |
| Market Size 2035 | Million Units | 84.21 |
| CAGR 2019-2025 | Percentage | XX% |
| CAGR 2026-2035 | Percentage | 7.40% |
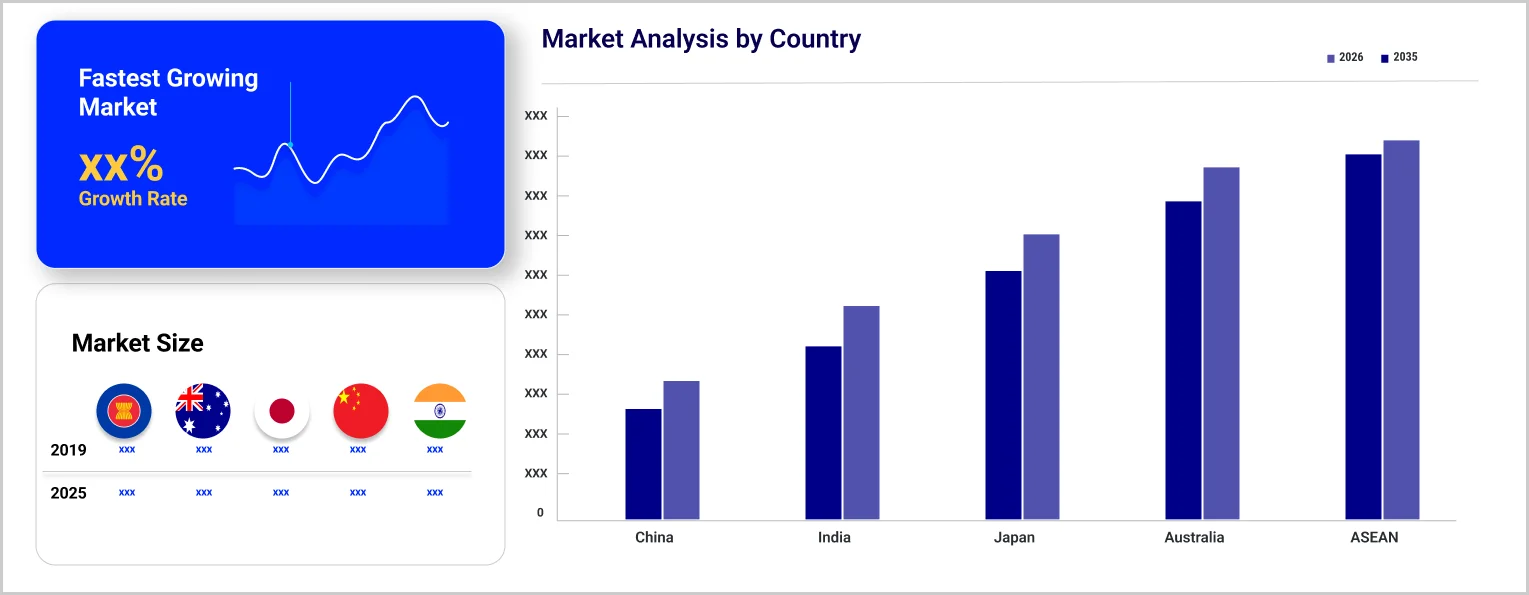
| CAGR 2026-2035 - Market by Country | India | 8.3% |
| CAGR 2026-2035 - Market by Country | ASEAN | 7.6% |
| CAGR 2026-2035 - Market by Operating System | Android | 11.1% |
| CAGR 2026-2035 - Market by Distribution Channel | Online | 15.1% |
| 2025 Market Share by Country | Australia | 5.8% |
In 2021, the Asia Pacific region had the largest student presence, with 28 million new online learners signing up for a total of 68 million courses. In Southeast Asia, there were a total of 1.3 million online learners. Tablets are favoured by students due to their lightweight and portable nature, allowing easy access to learning materials from different locations. The increasing popularity of online learning has led to a higher demand for tablets, as they support interactive learning through educational apps, multimedia content, and interactive textbooks, ultimately enhancing the overall learning experience.
The rise of e-commerce platforms such as Amazon, Flipkart, and others has simplified the process for consumers to buy tablets, providing a wide array of options, competitive prices, and convenient delivery choices. Business-to-business e-commerce in the Asia Pacific has been growing at an average annual rate of 15%, surpassing the global average of 14.5% in gross merchandise value growth each year. Projections for the Southeast Asian e-commerce market indicate a substantial increase by 2030, with Vietnam, Thailand, and the Philippines anticipated to more than double their e-commerce market worth. Additionally, the emergence of digital payment methods and financing alternatives on e-commerce platforms has further streamlined the purchasing experience for consumers, surging tablet sales.
“Asia Pacific Tablet Market Report and Forecast 2026-2035” offers a detailed analysis of the market based on the following segments:
Market Breakup by Operating System
Market Breakup by Screen Size
Market Breakup by End-Use
Market Breakup by Distribution Channel
Market Breakup by Country
| CAGR 2026-2035 - Market by | Country |
| India | 8.3% |
| ASEAN | 7.6% |
| China | XX% |
| Japan | XX% |
| Australia | XX% |
| Others | XX% |
Based on distribution channel, the market is segmented into online and offline. The online segment is projected to grow at a CAGR of 15.1% during the forecast period of 2026-2035. The popularity of tablet sales through online channels has experienced a significant surge in recent years. This trend can be attributed to several key factors, primarily the convenience that online shopping offers to consumers. With just a few clicks, shoppers can browse a vast array of tablet models, compare features, read reviews, and make informed purchasing decisions from the comfort of their own homes.
Major market players are focusing on the adoption of cutting-edge technologies to gain a competitive edge.
Upto 15% Off
USD
$2499 $2249
$3999 $3599
$4999 $4249
$5999 $5099


*While we strive to always give you current and accurate information, the numbers depicted on the website are indicative and may differ from the actual numbers in the main report. At Expert Market Research, we aim to bring you the latest insights and trends in the market. Using our analyses and forecasts, stakeholders can understand the market dynamics, navigate challenges, and capitalize on opportunities to make data-driven strategic decisions.*
In 2025, the market reached an approximate volume of 41.24 Million Units.
The market is estimated to grow at a CAGR of 7.40% between 2026 and 2035.
The market is estimated to witness a healthy growth during 2026-2035 to reach around 84.21 Million Units by 2035.
The market is being driven by rising disposable income and the growth of online learning platforms.
The key trends aiding the market expansion include rising remote work culture, rapid digital transformation, and growth of the e-commerce sector.
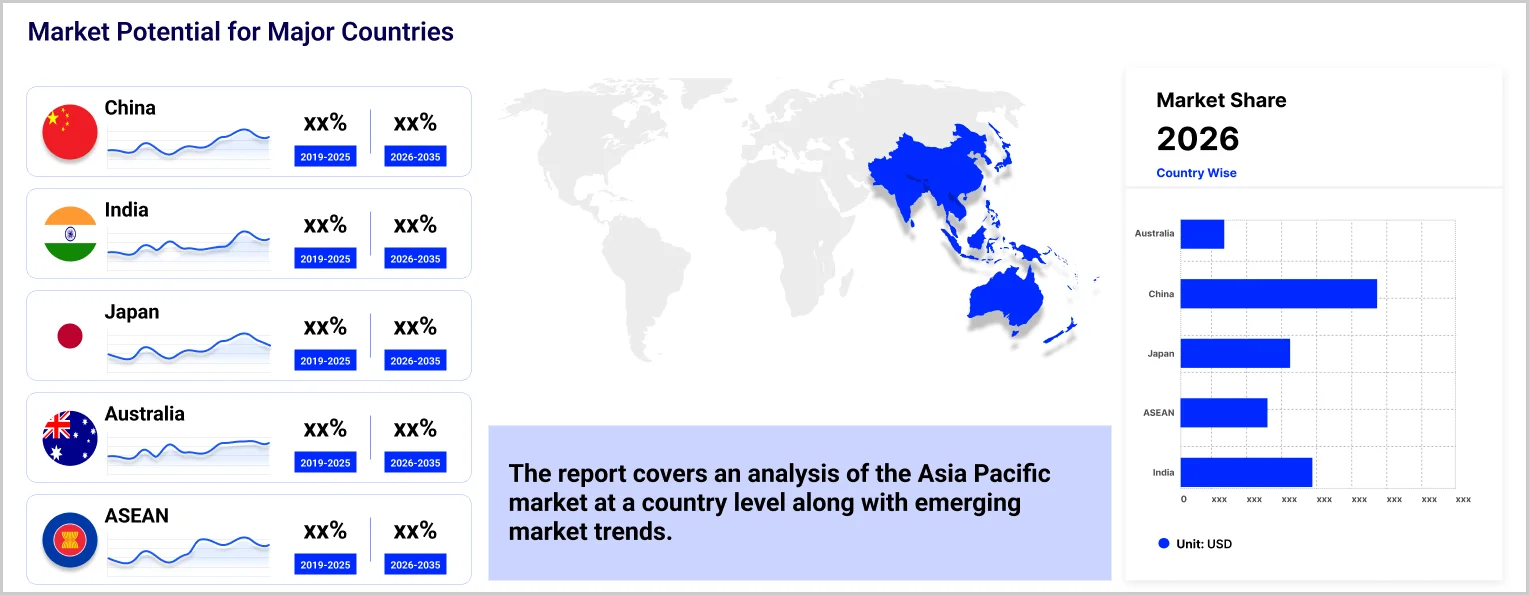
The major countries considered in the market are China, Japan, India, ASEAN, and Australia, among others.
The major distribution channels of tablet include online and offline.
The major players in the market are Apple Inc., Lenovo Group Ltd., Samsung Electronics Co. Ltd., AsusTek Computer Inc., LG Corporation, Acer Inc., Xiaomi Group, Nokia Corporation, Hewlett Packard Enterprise Development LP, and Microsoft Corporation, among others.
Explore our key highlights of the report and gain a concise overview of key findings, trends, and actionable insights that will empower your strategic decisions.
| REPORT FEATURES | DETAILS |
| Base Year | 2025 |
| Historical Period | 2019-2025 |
| Forecast Period | 2026-2035 |
| Scope of the Report |
Historical and Forecast Trends, Industry Drivers and Constraints, Historical and Forecast Market Analysis by Segment:
|
| Breakup by Operating System |
|
| Breakup by Screen Size |
|
| Breakup by End-Use |
|
| Breakup by Distribution Channel |
|
| Breakup by Region |
|
| Market Dynamics |
|
| Competitive Landscape |
|
| Companies Covered |
|
Datasheet
One User
USD 2,499
USD 2,249
tax inclusive*
Single User License
One User
USD 3,999
USD 3,599
tax inclusive*
Five User License
Five User
USD 4,999
USD 4,249
tax inclusive*
Corporate License
Unlimited Users
USD 5,999
USD 5,099
tax inclusive*
*Please note that the prices mentioned below are starting prices for each bundle type. Kindly contact our team for further details.*
Flash Bundle
Small Business Bundle
Growth Bundle
Enterprise Bundle
*Please note that the prices mentioned below are starting prices for each bundle type. Kindly contact our team for further details.*
Flash Bundle
Number of Reports: 3
20%
tax inclusive*
Small Business Bundle
Number of Reports: 5
25%
tax inclusive*
Growth Bundle
Number of Reports: 8
30%
tax inclusive*
Enterprise Bundle
Number of Reports: 10
35%
tax inclusive*
How To Order

Select License Type
Choose the right license for your needs and access rights.

Click on ‘Buy Now’
Add the report to your cart with one click and proceed to register.

Select Mode of Payment
Choose a payment option for a secure checkout. You will be redirected accordingly.
Strategic Solutions for Informed Decision-Making
Gain insights to stay ahead and seize opportunities.

Get insights & trends for a competitive edge.

Track prices with detailed trend reports.

Analyse trade data for supply chain insights.

Leverage cost reports for smart savings

Enhance supply chain with partnerships.

Connect For More Information
Our expert team of analysts will offer full support and resolve any queries regarding the report, before and after the purchase.
Our expert team of analysts will offer full support and resolve any queries regarding the report, before and after the purchase.
We employ meticulous research methods, blending advanced analytics and expert insights to deliver accurate, actionable industry intelligence, staying ahead of competitors.
Our skilled analysts offer unparalleled competitive advantage with detailed insights on current and emerging markets, ensuring your strategic edge.
We offer an in-depth yet simplified presentation of industry insights and analysis to meet your specific requirements effectively.


