

Consumer Insights
Uncover trends and behaviors shaping consumer choices today
Procurement Insights
Optimize your sourcing strategy with key market data
Industry Stats
Stay ahead with the latest trends and market analysis.
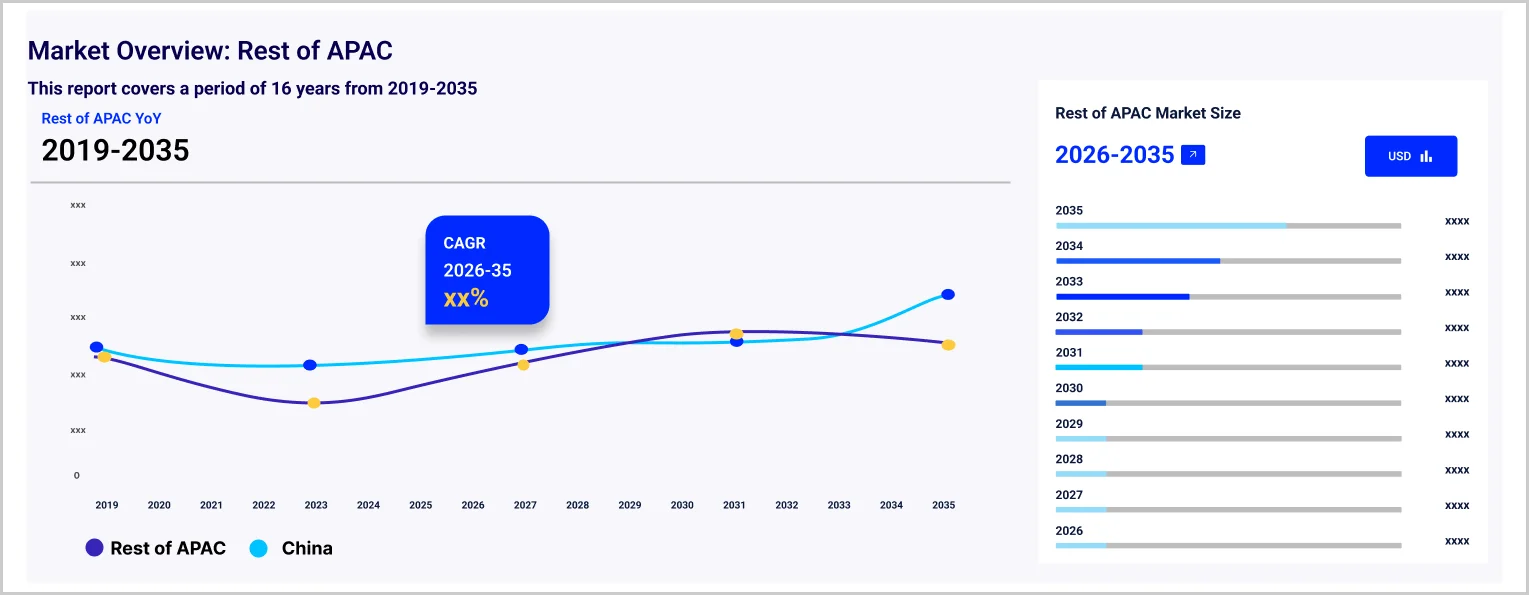
The Asia Pacific third-party logistics (3PL) market size reached approximately USD 417.66 Billion in 2025. The market is projected to grow at a CAGR of 6.90% between 2026 and 2035, reaching a value of around USD 813.95 Billion by 2035.
The adoption of software solutions, such as cloud ERP and SCMs is contributing to the growth of the market.
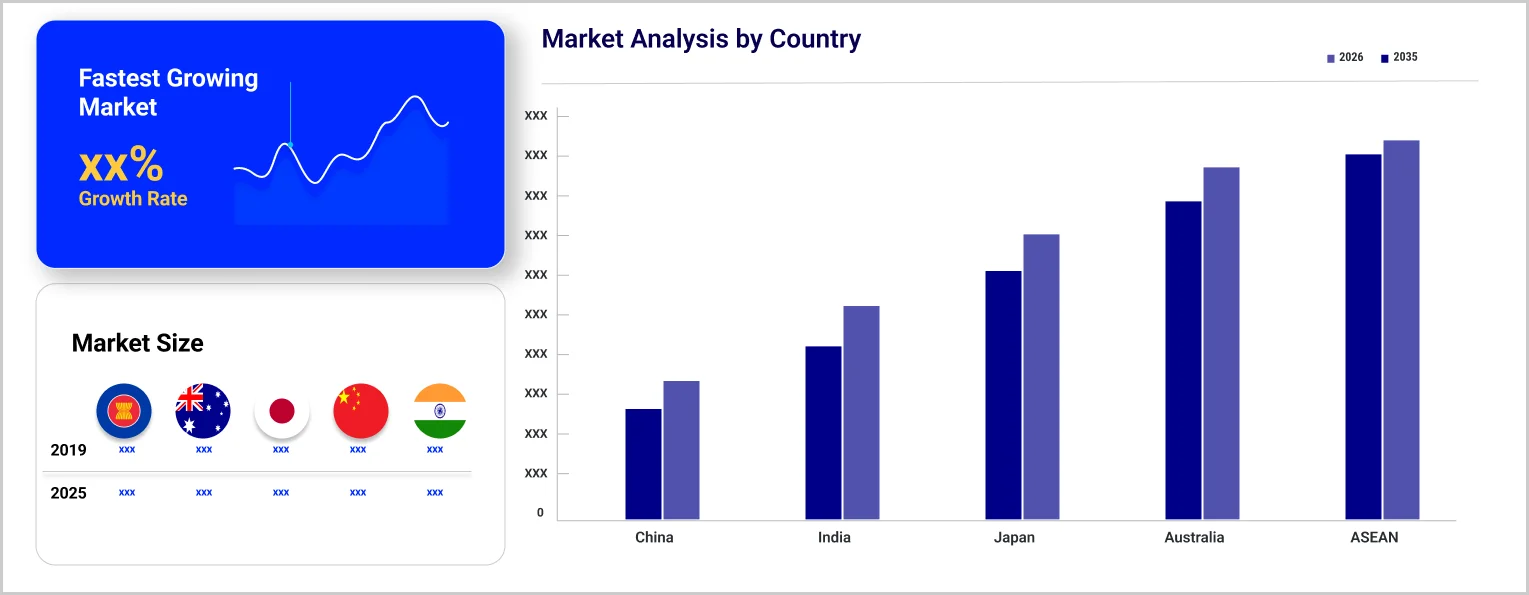
China is witnessing a significant number of mergers among third-party logistics players, further contributing to the market development.
It is estimated that by 2030, India is poised to be a global powerhouse of e-commerce, reaching about 500 million buyers by 2030.
Compound Annual Growth Rate
6.9%
Value in USD Billion
2026-2035
Technologies such as GPS route planning technology and AI are revolutionising the Asia Pacific third-party logistics (3PL) market, as they can accurately optimize routes based on speed, cost, and driver rest time. Moreover, the adoption of comprehensive databases is aiding 3PLs in packing products at optimal carrying capacity and also helps to better keep track of extra space during transportation operations. This further results in lowered operating costs for the companies. Currently, the average e-commerce penetration rate (excluding food and beverage) in Southeast Asia is 20%, which is further anticipated to increase over the upcoming years. This further contributes to the growth of the Asia Pacific third-party logistics (3PL) market.
Reportedly, about 29.6% of activity in major airport submarkets is by 3PL logistics companies. The increasing number of organisations setting up office spaces near major airports, the improved convenience and the shorter time offered by airways are contributing to the increasing distribution of goods through air transport.
China is considered a top e-commerce market on a global scale, constituting about 50% of the world’s transactions. In 2021, China’s cross-border e-commerce imports and exports increased 15 year-on-year to USD 273 billion. The improved convenience offered by e-commerce is further leading to the expansion of the 3PL market in China.
"Asia Pacific Third-Party Logistics (3PL) Market Report and Forecast 2026-2035" offers a detailed analysis of the market based on the following segments:
Market Breakup by Service
Market Breakup by Transport
Market Breakup by End Use
Market Breakup by Country
The market players are increasingly focusing on the integration of advanced technologies to offer improved 3PL services.
Upto 15% Off
USD
$2499 $2249
$3999 $3599
$4999 $4249
$5999 $5099


*While we strive to always give you current and accurate information, the numbers depicted on the website are indicative and may differ from the actual numbers in the main report. At Expert Market Research, we aim to bring you the latest insights and trends in the market. Using our analyses and forecasts, stakeholders can understand the market dynamics, navigate challenges, and capitalize on opportunities to make data-driven strategic decisions.*
The market reached a value of approximately USD 417.66 Billion in 2025.
The market is estimated to grow at a CAGR of 6.90% between 2026 and 2035.
The market is estimated to witness a healthy growth during 2026-2035 to reach around USD 813.95 Billion by 2035.
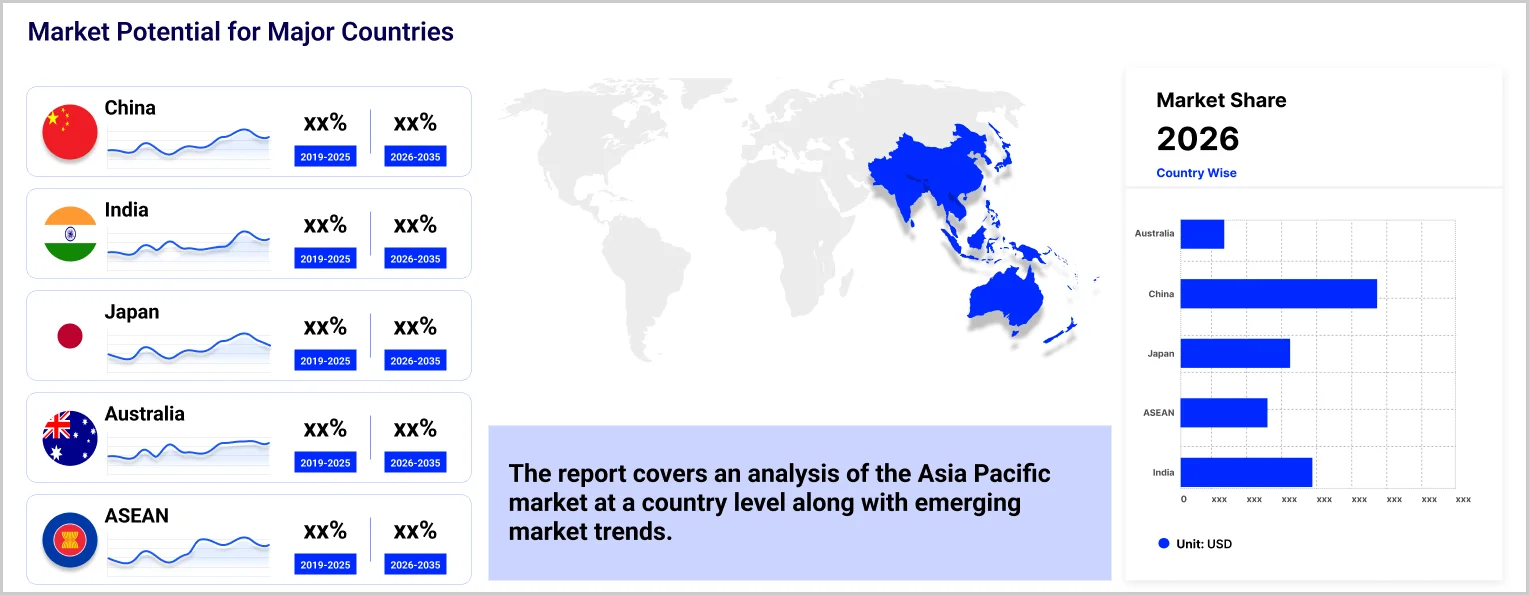
The growth of the 3PL market in the Asia Pacific is primarily fuelled by the expansion of e-commerce, growing technological advancements, and the growth of air transport logistics.
China, Japan, India, ASEAN, and Australia are the key countries analysed in the market report.
The major transportation methods include railways, roadways, waterways, and airways.
The major end uses are retail, healthcare, manufacturing, automotive, and others.
The major players in the market are FedEx Corp, Deutsche Post AG (DHL), Schenker AG, CH Robinson Worldwide Inc, CEVA Logistics S.A, Nippon Express Holdings Inc., Toll Holdings Limited, Kintetsu World Express, Inc., CJ Logistics Corporation, and Linfox Pty Ltd, among others.
Explore our key highlights of the report and gain a concise overview of key findings, trends, and actionable insights that will empower your strategic decisions.
| REPORT FEATURES | DETAILS |
| Base Year | 2025 |
| Historical Period | 2019-2025 |
| Forecast Period | 2026-2035 |
| Scope of the Report |
Historical and Forecast Trends, Industry Drivers and Constraints, Historical and Forecast Market Analysis by Segment:
|
| Breakup by Service |
|
| Breakup by Transport |
|
| Breakup by End Use |
|
| Breakup by Region |
|
| Market Dynamics |
|
| Competitive Landscape |
|
| Companies Covered |
|
Datasheet
One User
USD 2,499
USD 2,249
tax inclusive*
Single User License
One User
USD 3,999
USD 3,599
tax inclusive*
Five User License
Five User
USD 4,999
USD 4,249
tax inclusive*
Corporate License
Unlimited Users
USD 5,999
USD 5,099
tax inclusive*
*Please note that the prices mentioned below are starting prices for each bundle type. Kindly contact our team for further details.*
Flash Bundle
Small Business Bundle
Growth Bundle
Enterprise Bundle
*Please note that the prices mentioned below are starting prices for each bundle type. Kindly contact our team for further details.*
Flash Bundle
Number of Reports: 3
20%
tax inclusive*
Small Business Bundle
Number of Reports: 5
25%
tax inclusive*
Growth Bundle
Number of Reports: 8
30%
tax inclusive*
Enterprise Bundle
Number of Reports: 10
35%
tax inclusive*
How To Order

Select License Type
Choose the right license for your needs and access rights.

Click on ‘Buy Now’
Add the report to your cart with one click and proceed to register.

Select Mode of Payment
Choose a payment option for a secure checkout. You will be redirected accordingly.
Strategic Solutions for Informed Decision-Making
Gain insights to stay ahead and seize opportunities.

Get insights & trends for a competitive edge.

Track prices with detailed trend reports.

Analyse trade data for supply chain insights.

Leverage cost reports for smart savings

Enhance supply chain with partnerships.

Connect For More Information
Our expert team of analysts will offer full support and resolve any queries regarding the report, before and after the purchase.
Our expert team of analysts will offer full support and resolve any queries regarding the report, before and after the purchase.
We employ meticulous research methods, blending advanced analytics and expert insights to deliver accurate, actionable industry intelligence, staying ahead of competitors.
Our skilled analysts offer unparalleled competitive advantage with detailed insights on current and emerging markets, ensuring your strategic edge.
We offer an in-depth yet simplified presentation of industry insights and analysis to meet your specific requirements effectively.


