

Consumer Insights
Uncover trends and behaviors shaping consumer choices today
Procurement Insights
Optimize your sourcing strategy with key market data
Industry Stats
Stay ahead with the latest trends and market analysis.
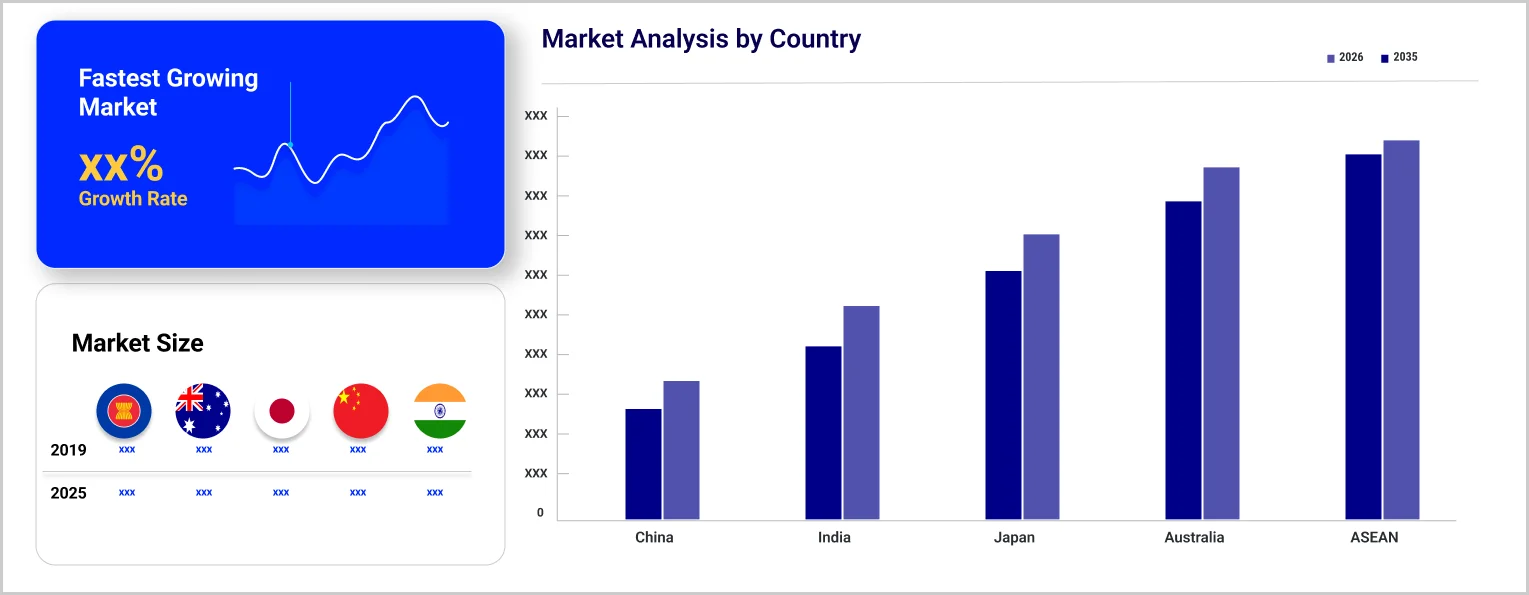
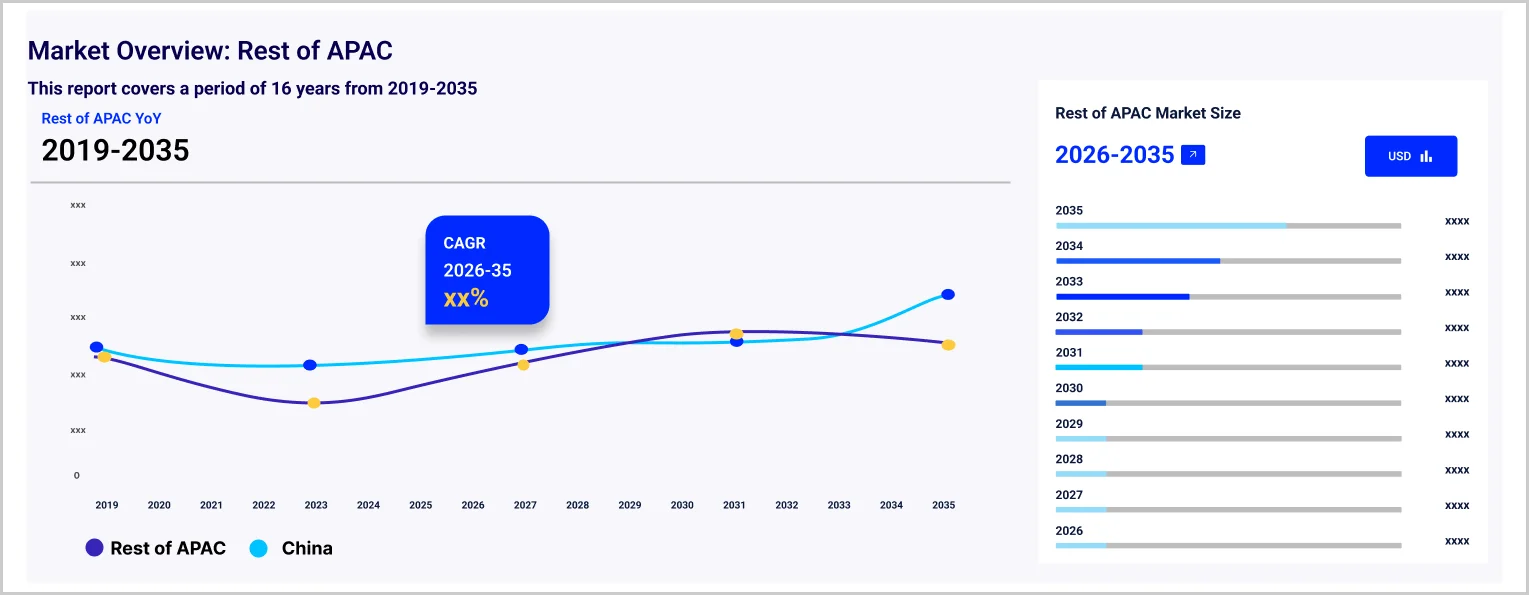
The Asia Pacific vibration sensors market size is projected to grow at a CAGR of 10.10% between 2026 and 2035. The market is being driven by the rising use of vibration sensors in the power sector.
Compound Annual Growth Rate
10.1%
2026-2035
Read more about this report - REQUEST FREE SAMPLE COPY IN PDF
To prevent significant transmission and distribution losses, the power industry extensively adopts vibration sensors. Vibration sensors help in detecting aerodynamic asymmetry, rotor imbalances, and surface roughness, thereby enhancing the efficiency of power distribution and performing stress and strain assessment to boost the performance of the power distribution lines. This is expected to drive the Asia Pacific vibration sensors market growth.
The shift towards predictive maintenance models in the construction and infrastructure development industry is expected to further drive the demand for vibration sensors. This is because they help in detecting potential issues which cause machine downtime and changes in machine behaviour, thereby affecting the output/quality of work. A variety of accelerometers, proximity probes, and velocity sensors are used to detect machine performance continuously, which enhances overall productivity and efficiency. This is likely to favour the Asia Pacific vibration sensors market expansion.
Improvements in underlying technologies such as integrated circuits are expected to fuel the Asia Pacific vibration sensors market development. The integration of artificial intelligence technology into vibration sensors’ chips is expected to enhance the speed of discovery and processing of data while minimising power consumption, fuelling the market expansion in the coming years.
Read more about this report - REQUEST FREE SAMPLE COPY IN PDF
"Asia Pacific Vibration Sensors Market Report and Forecast 2026-2035" offers a detailed analysis of the market based on the following segments:
Market Breakup by Product
Market Breakup by Material
Market Breakup by Technology
Market Breakup by End Use
Market Breakup by Country
The key Asia Pacific vibration sensors product market players are:-
The Asia Pacific vibration sensors market faces significant operational challenges rooted in the region's uneven industrial development. Integrating advanced vibration monitoring systems with legacy machinery, which remains prevalent across older manufacturing facilities in Southeast Asia and South Asia, poses considerable technical complexity. A persistent shortage of skilled engineers capable of interpreting vibration data and implementing condition-based maintenance programmes limits effective adoption, particularly among small and mid-sized industrial operators. Additionally, the rapid proliferation of IoT-connected sensors introduces cybersecurity vulnerabilities that industrial operators must address as sensor networks expand across critical infrastructure.
Price sensitivity remains a substantial restraint, especially across emerging economies within the region where capital expenditure on predictive maintenance technology competes with more immediate operational priorities. The availability of low-cost sensor alternatives from domestic manufacturers creates margin pressure on established players offering precision-grade instruments. Regulatory fragmentation across Asia Pacific jurisdictions further complicates cross-border product standardisation and certification, slowing procurement timelines for multinational industrial operators.
Despite these constraints, the market holds considerable growth potential. Accelerating Industry 4.0 adoption across China, Japan, South Korea, and India is generating strong demand for real-time condition monitoring solutions. Expanding renewable energy infrastructure, particularly wind energy, requires continuous vibration monitoring for turbine health management. Government-backed manufacturing modernisation initiatives and rising automotive and aerospace sector investment across the region further broaden the application base for next-generation vibration sensing technologies.Sonnet 4.6 High
Upto 15% Off
USD
$2499 $2249
$3999 $3599
$4999 $4249
$5999 $5099


*While we strive to always give you current and accurate information, the numbers depicted on the website are indicative and may differ from the actual numbers in the main report. At Expert Market Research, we aim to bring you the latest insights and trends in the market. Using our analyses and forecasts, stakeholders can understand the market dynamics, navigate challenges, and capitalize on opportunities to make data-driven strategic decisions.*
The market is projected to grow at a CAGR of 10.10% between 2026 and 2035.
The different products in the market include accelerometers, velocity sensors, displacement sensors, and proximity probes.
The different technologies in the market include piezoresistive, strain gauge, optical sensor, and hand probe, among others.
The different materials used in vibration sensors are doped silicon, piezoelectric ceramics, and quartz.
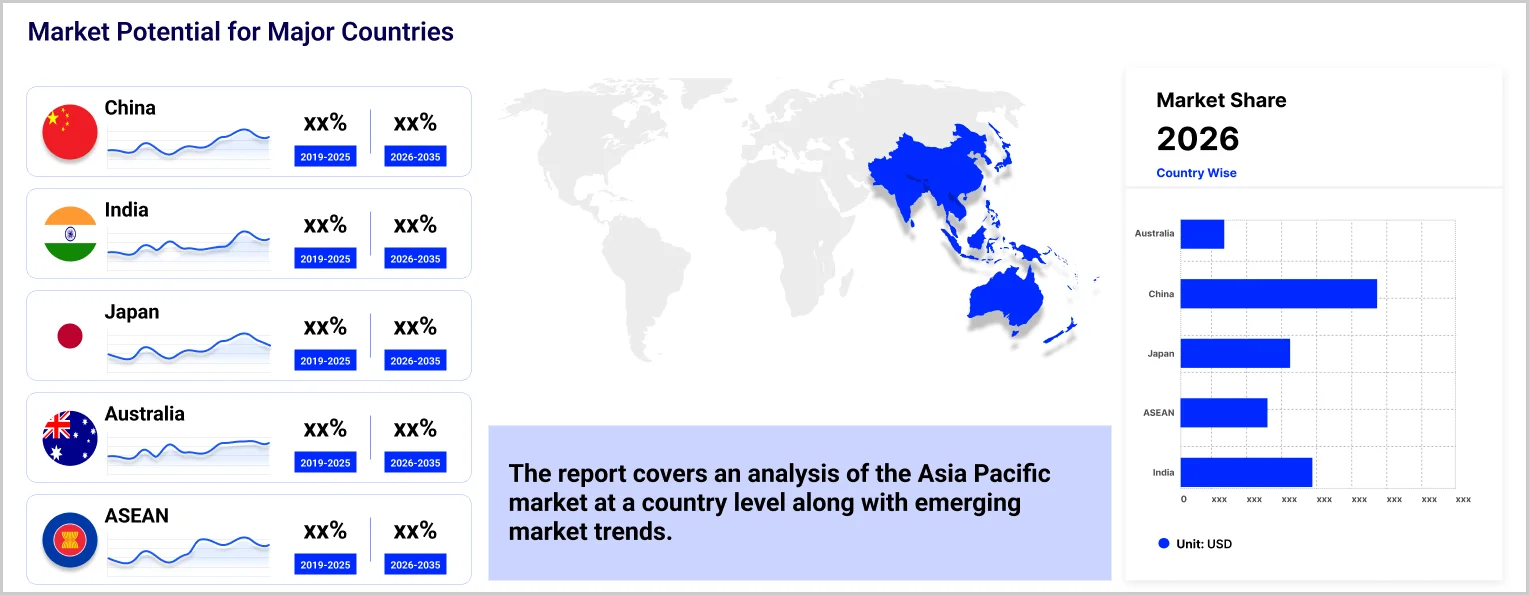
The major regions in the market include China, Japan, India, ASEAN, and Australia, among others.
The key market players are Yokogawa Electric Corp., Rockwell Automation Inc., Emerson Electric Co., TE Connectivity Ltd., Honeywell International Inc., Texas Instruments Inc., Analog Devices, Inc., NXP Semiconductors N.V., SKF AB, Hansford Sensors Ltd., and Murata Manufacturing Co., Ltd., among others.
Explore our key highlights of the report and gain a concise overview of key findings, trends, and actionable insights that will empower your strategic decisions.
| REPORT FEATURES | DETAILS |
| Base Year | 2025 |
| Historical Period | 2019-2025 |
| Forecast Period | 2026-2035 |
| Scope of the Report |
Historical and Forecast Trends, Industry Drivers and Constraints, Historical and Forecast Market Analysis by Segment:
|
| Breakup by Product |
|
| Breakup by Material |
|
| Breakup by Technology |
|
| Breakup by End Use |
|
| Breakup by Region |
|
| Market Dynamics |
|
| Competitive Landscape |
|
| Companies Covered |
|
Datasheet
One User
USD 2,499
USD 2,249
tax inclusive*
Single User License
One User
USD 3,999
USD 3,599
tax inclusive*
Five User License
Five User
USD 4,999
USD 4,249
tax inclusive*
Corporate License
Unlimited Users
USD 5,999
USD 5,099
tax inclusive*
*Please note that the prices mentioned below are starting prices for each bundle type. Kindly contact our team for further details.*
Flash Bundle
Small Business Bundle
Growth Bundle
Enterprise Bundle
*Please note that the prices mentioned below are starting prices for each bundle type. Kindly contact our team for further details.*
Flash Bundle
Number of Reports: 3
20%
tax inclusive*
Small Business Bundle
Number of Reports: 5
25%
tax inclusive*
Growth Bundle
Number of Reports: 8
30%
tax inclusive*
Enterprise Bundle
Number of Reports: 10
35%
tax inclusive*
How To Order

Select License Type
Choose the right license for your needs and access rights.

Click on ‘Buy Now’
Add the report to your cart with one click and proceed to register.

Select Mode of Payment
Choose a payment option for a secure checkout. You will be redirected accordingly.
Strategic Solutions for Informed Decision-Making
Gain insights to stay ahead and seize opportunities.

Get insights & trends for a competitive edge.

Track prices with detailed trend reports.

Analyse trade data for supply chain insights.

Leverage cost reports for smart savings

Enhance supply chain with partnerships.

Connect For More Information
Our expert team of analysts will offer full support and resolve any queries regarding the report, before and after the purchase.
Our expert team of analysts will offer full support and resolve any queries regarding the report, before and after the purchase.
We employ meticulous research methods, blending advanced analytics and expert insights to deliver accurate, actionable industry intelligence, staying ahead of competitors.
Our skilled analysts offer unparalleled competitive advantage with detailed insights on current and emerging markets, ensuring your strategic edge.
We offer an in-depth yet simplified presentation of industry insights and analysis to meet your specific requirements effectively.


