Reports

Sale

Australia and New Zealand Laptop Market

Australia and New Zealand Laptop Market Size, Share, Trends: By Type: Traditional, 2-in-1; By Screen Size: Up to 10.9" Inch, 11" to 12.9" Inch, 13" to 14.9" Inch, 15.0" to 16.9" Inch, More than 17" Inch; By Price: Up to USD 500, USD 501 to USD 1,000, USD 1,001 to USD 1,500, Others; By End Use; Regional Analysis; Competitive Landscape; 2024-2032

Australia and New Zealand Laptop Market Outlook

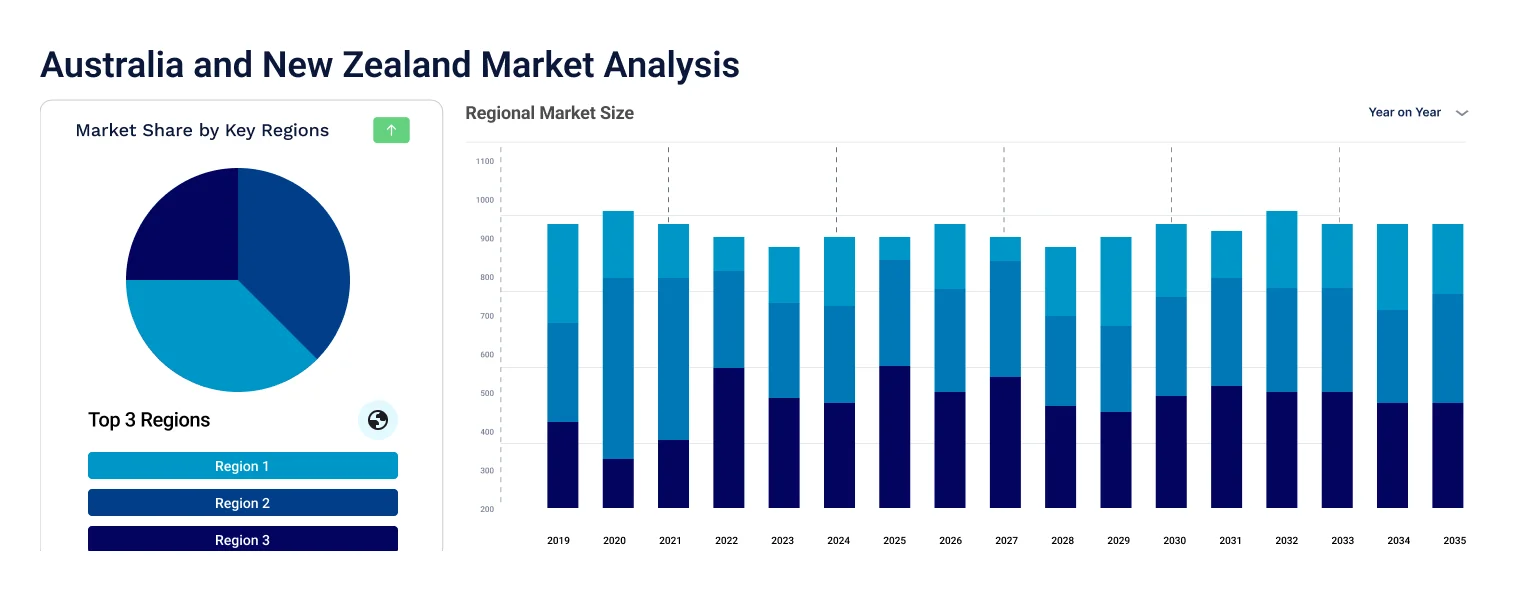
The Australia and New Zealand laptop market size reached USD 3.54 billion in 2023. The market is expected to grow at a CAGR of 2.97% between 2024 and 2032, reaching USD 4.58 billion by 2032.


Key Takeaways:

  • Recent data from the World Bank reveals Australia's internet adoption at 96%, propelling the laptop market's expansion.
  • The Australian Bureau of Statistics reports a 64.1% employment rate in February 2024, heightening the demand for laptops.
  • The Department of Foreign Affairs and Trade notes Australia's thriving gaming sector, which generated $226.5 million in revenue in 2021.


The 15.0" to 16.9" laptops contribute to the Australia and New Zealand laptop market growth by achieving a balance between screen size and portability

These models are typically lighter and more compact than larger laptops, ensuring easier mobility while providing a comfortable screen size for various tasks. Laptops within the 15.0" to 16.9" range find a delicate equilibrium between screen size and portability, being more lightweight and compact. Perfect for travellers requiring productivity, they fit well into bags and confined areas. With a friendly price point, they attract students and professionals seeking well-rounded features without high expenses.


Laptops exceeding 17" excel in productivity, providing generous multitasking space for professionals in design or data analysis. They offer immersive entertainment for gamers and cinema enthusiasts, assist in graphic work with their expansive screens, and improve cooling for demanding tasks. Moreover, they provide comfortable typing experiences and frequently support hardware upgrades, lengthening their usefulness.


By July 2023, LG's sophisticated Gram Style laptop launched in Canada, was initially unveiled at CES 2023. This laptop maintains the core features expected from LG's Gram series, such as its lightweight build, but introduces an extra touch of elegance. The Gram Style is undeniably attractive due to its iridescent finish, which changes hues under varying lighting conditions.


Australia and New Zealand Laptop Market


Market Segmentation

Australia and New Zealand Laptop Market Report and Forecast 2024-2032 offers a detailed analysis of the market based on the following segments:


Market Breakup by Type

  • Traditional
  • 2-in-1


Market Breakup by Screen Size

  • Up To 10.9” Inch
  • 11” To 12.9” Inch
  • 13” To 14.9” Inch
  • 15.0” To 16.9”
  • More Than 17”


Market Breakup by Price

  • Up to USD 500
  • USD 501 to USD 1000
  • USD 1001 to USD 1500
  • Others


Market Breakup by End Use

  • Personal
  • Business
  • Gaming


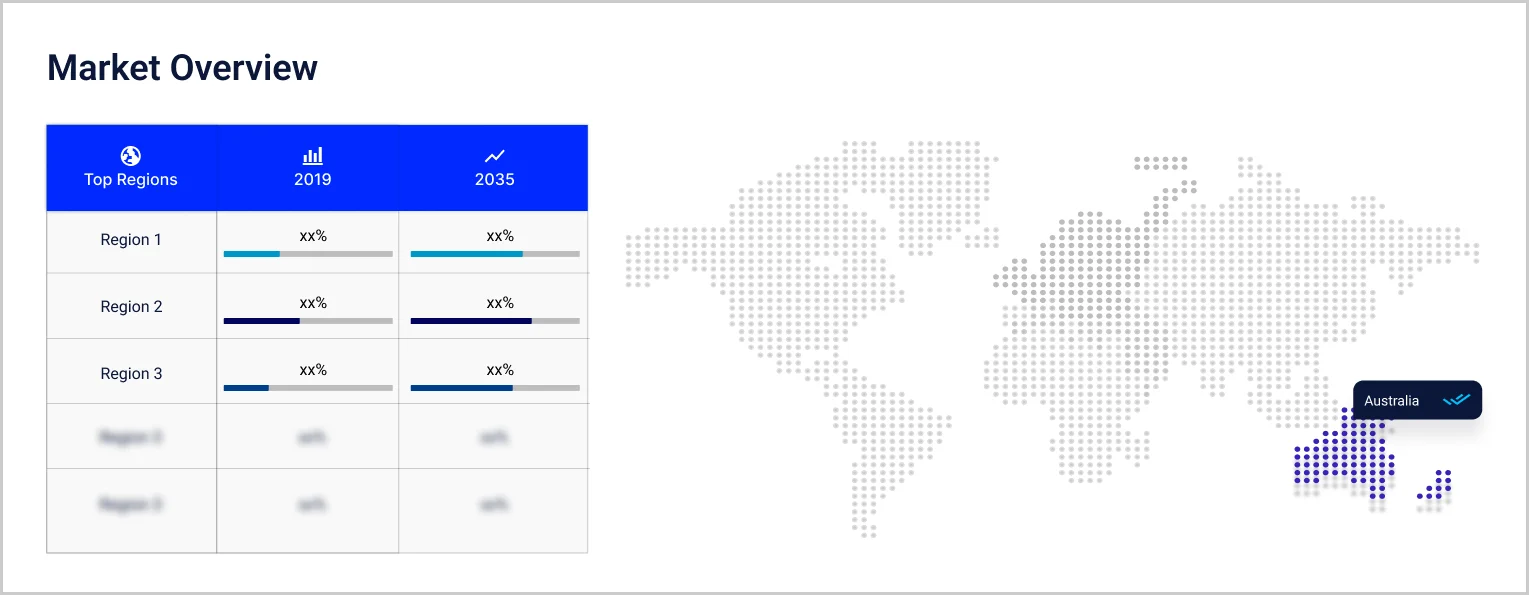
Market Breakup by Country

  • Australia
  • New Zealand


The Australia and New Zeland laptop market key players are Apple Inc., Samsung Electronics Co., Ltd., Microsoft Corporation, Lenovo Group Ltd., ASUSTeK Computer Inc., HP Inc., Dell Inc., Acer Inc., Micro-Star INT’L Co., Ltd., and Razer Inc. among others.


Key Highlights of the Report

REPORT FEATURES DETAILS
Base Year 2023
Historical Period 2018-2023
Forecast Period 2024-2032
Scope of the Report

Historical and Forecast Trends, Industry Drivers and Constraints, Historical and Forecast Market Analysis by Segment:

  • Type
  • Screen Size
  • Price
  • End Use
  • Region
Breakup by Type
  • Traditional
  • 2-in-1
Breakup by Screen Size
  • Up To 10.9” Inch
  • 11” To 12.9” Inch
  • 13” To 14.9” Inch
  • 15.0” To 16.9”
  • More Than 17”
Breakup by Price
  • Up to USD 500
  • USD 501 to USD 1000
  • USD 1001 to USD 1500
  • Others
Breakup by End Use
  • Personal
  • Business
  • Gaming
Breakup by Region
  • Australia
  • New Zealand
Market Dynamics
  • SWOT Analysis
  • Porter's Five Forces Analysis
  • Key Indicators for Demand
  • Key Indicators for Price
Competitive Landscape
  • Market Structure
  • Company Profiles
    • Company Overview
    • Product Portfolio
    • Demographic Reach and Achievements
    • Certifications
Companies Covered
  • Apple Inc.
  • Samsung Electronics Co., Ltd.
  • Microsoft Corporation
  • GIGA-BYTE Technology Co., Ltd.
  • ASUSTeK Computer Inc.
  • HP Inc.
  • Dell Inc.
  • Acer Inc.
  • Razer Inc.
  • Micro-Star INT'L CO., LTD.
  • Others


*At Expert Market Research, we strive to always give you current and accurate information. The numbers depicted in the description are indicative and may differ from the actual numbers in the final EMR report.

1    Preface
2    Report Coverage – Key Segmentation and Scope
3    Report Description

    3.1    Market Definition and Outlook
    3.2    Properties and Applications
    3.3    Market Analysis
    3.4    Key Players
4    Key Assumptions
5    Executive Summary

    5.1    Overview
    5.2    Key Drivers    
    5.3    Key Developments
    5.4    Competitive Structure
    5.5    Key Industrial Trends
6    Market Snapshot
7    Opportunities and Challenges in the Market
8    Asia Pacific Laptop Market Overview

    8.1    Key Industry Highlights
    8.2    Asia Pacific Laptop Historical Market (2018-2023) 
    8.3    Asia Pacific Laptop Market Forecast (2024-2032)
    8.4    Asia Pacific Laptop Market Share by Region
        8.4.1    China
        8.4.2    Japan
        8.4.3    India
        8.4.4    ASEAN
        8.4.5    Australia
        8.4.6    Others
9    Australia and New Zealand Laptop Market Overview
    9.1    Key Industry Highlights
    9.2    Australia and New Zealand Laptop Historical Market (2018-2023) 
    9.3    Australia and New Zealand Laptop Market Forecast (2024-2032)
10    Australia and New Zealand Laptop Market by Type
    10.1    Traditional
        10.1.1    Historical Trend (2018-2023)
        10.1.2    Forecast Trend (2024-2032)
    10.2    2-in-1
        10.2.1    Historical Trend (2018-2023)
        10.2.2    Forecast Trend (2024-2032)
11    Australia and New Zealand Laptop Market by Screen Size
    11.1    Up to 10.9” Inch
        11.1.1    Historical Trend (2018-2023)
        11.1.2    Forecast Trend (2024-2032)
    11.2    11” to 12.9” Inch
        11.2.1    Historical Trend (2018-2023)
        11.2.2    Forecast Trend (2024-2032)
    11.3    13” to 14.9” Inch
        11.3.1    Historical Trend (2018-2023)
        11.3.2    Forecast Trend (2024-2032)
    11.4    15.0” to 16.9”
        11.4.1    Historical Trend (2018-2023)
        11.4.2    Forecast Trend (2024-2032)
    11.5    More than 17”
        11.5.1    Historical Trend (2018-2023)
        11.5.2    Forecast Trend (2024-2032)
12    Australia and New Zealand Laptop Market by Price
    12.1    Up to USD 500
        12.1.1    Historical Trend (2018-2023)
        12.1.2    Forecast Trend (2024-2032)
    12.2    USD 501 to USD 1000
        12.2.1    Historical Trend (2018-2023)
        12.2.2    Forecast Trend (2024-2032)
    12.3    USD 1001 to USD 1500
        12.3.1    Historical Trend (2018-2023)
        12.3.2    Forecast Trend (2024-2032)
    12.4    Others
13    Australia and New Zealand Laptop Market by End Use
    13.1    Personal
        13.1.1    Historical Trend (2018-2023)
        13.1.2    Forecast Trend (2024-2032)
    13.2    Business
        13.2.1    Historical Trend (2018-2023)
        13.2.2    Forecast Trend (2024-2032)
    13.3    Gaming
        13.3.1    Historical Trend (2018-2023)
        13.3.2    Forecast Trend (2024-2032)
14    Australia and New Zealand Laptop Market by Country
    14.1    Australia
        14.1.1    Historical Trend (2018-2023)
        14.1.2    Forecast Trend (2024-2032)
    14.2    New Zealand
        14.2.1    Historical Trend (2018-2023)
        14.2.2    Forecast Trend (2024-2032)
15    Market Dynamics
    15.1    SWOT Analysis
        15.1.1    Strengths
        15.1.2    Weaknesses
        15.1.3    Opportunities
        15.1.4    Threats
    15.2    Porter’s Five Forces Analysis
        15.2.1    Supplier’s Power
        15.2.2    Buyer’s Power
        15.2.3    Threat of New Entrants
        15.2.4    Degree of Rivalry
        15.2.5    Threat of Substitutes
    15.3    Key Indicators of Demand
    15.4    Key Indicators of Price
16    Competitive Landscape
    16.1    Market Structure
    16.2    Company Profiles
        16.2.1    Apple Inc.
            16.2.1.1    Company Overview
            16.2.1.2    Product Portfolio
            16.2.1.3    Demographic Reach and Achievements
            16.2.1.4    Certifications
        16.2.2    Samsung Electronics Co., Ltd.
            16.2.2.1    Company Overview
            16.2.2.2    Product Portfolio
            16.2.2.3    Demographic Reach and Achievements
            16.2.2.4    Certifications
        16.2.3    Microsoft Corporation
            16.2.3.1    Company Overview
            16.2.3.2    Product Portfolio
            16.2.3.3    Demographic Reach and Achievements
            16.2.3.4    Certifications
        16.2.4    GIGA-BYTE Technology Co., Ltd.
            16.2.4.1    Company Overview
            16.2.4.2    Product Portfolio
            16.2.4.3    Demographic Reach and Achievements
            16.2.4.4    Certifications
        16.2.5    ASUSTeK Computer Inc.
            16.2.5.1    Company Overview
            16.2.5.2    Product Portfolio
            16.2.5.3    Demographic Reach and Achievements
            16.2.5.4    Certifications
        16.2.6    HP Inc.
            16.2.6.1    Company Overview
            16.2.6.2    Product Portfolio
            16.2.6.3    Demographic Reach and Achievements
            16.2.6.4    Certifications
        16.2.7    Dell Inc.
            16.2.7.1    Company Overview
            16.2.7.2    Product Portfolio
            16.2.7.3    Demographic Reach and Achievements
            16.2.7.4    Certifications
        16.2.8    Acer Inc.
            16.2.8.1    Company Overview
            16.2.8.2    Product Portfolio
            16.2.8.3    Demographic Reach and Achievements
            16.2.8.4    Certifications
        16.2.9    Razer Inc.
            16.2.9.1    Company Overview
            16.2.9.2    Product Portfolio
            16.2.9.3    Demographic Reach and Achievements
            16.2.9.4    Certifications
        16.2.10    Micro-Star INT'L CO., LTD.
            16.2.10.1    Company Overview
            16.2.10.2    Product Portfolio
            16.2.10.3    Demographic Reach and Achievements
            16.2.10.4    Certifications
        16.2.11    Others
17    Key Trends and Developments in the Market


List of Key Figures and Tables

1.    Asia Pacific Laptop Market: Key Industry Highlights, 2018 and 2032
2.    Australia and New Zealand Laptop Market: Key Industry Highlights, 2018 and 2032
3.    Australia and New Zealand Laptop Historical Market: Breakup by Type (USD Billion), 2018-2023
4.    Australia and New Zealand Laptop Market Forecast: Breakup by Type (USD Billion), 2024-2032
5.    Australia and New Zealand Laptop Historical Market: Breakup by Screen Size (USD Billion), 2018-2023
6.    Australia and New Zealand Laptop Market Forecast: Breakup by Screen Size (USD Billion), 2024-2032
7.    Australia and New Zealand Laptop Historical Market: Breakup by Price (USD Billion), 2018-2023
8.    Australia and New Zealand Laptop Market Forecast: Breakup by Price (USD Billion), 2024-2032
9.    Australia and New Zealand Laptop Historical Market: Breakup by End Use (USD Billion), 2018-2023
10.    Australia and New Zealand Laptop Market Forecast: Breakup by End Use (USD Billion), 2024-2032
11.    Australia and New Zealand Laptop Historical Market: Breakup by Country (USD Billion), 2018-2023
12.    Australia and New Zealand Laptop Market Forecast: Breakup by Country (USD Billion), 2024-2032
13.    Australia and New Zealand Laptop Market Structure

Key Questions Answered in the Report

The market was valued at USD 3.54 billion in 2023.

The market is projected to grow at a CAGR of 2.97% between 2024 and 2032.

The revenue generated from the laptop market is expected to reach USD 4.58 billion in 2032.

The laptop market is categorised according to the type, which includes traditional and 2-in-1.

The key players are Apple Inc., Samsung Electronics Co., Ltd., Microsoft Corporation, Schenker Technologies GmbH, ASUSTeK Computer Inc., HP Inc., Dell Inc., Acer Inc., Micro-Star INT’L Co., Ltd., and Razer Inc. among others.

Based on the end use, the market is divided into personal, business and gaming.

The market is broken down into Canada and New Zealand.

Purchase Full Report

Mini Report

$ 2199     $1999
  • Selected Sections, One User
  • Printing Not Allowed
  • Email Delivery in PDF
  • Free Limited Customisation
  • Post Sales Analyst Support
  • 50% Discount on Next Update

Single User License

$ 3299     $2999
  • All Sections, One User
  • One Print Allowed
  • Email Delivery in PDF
  • Free Limited Customisation
  • Post Sales Analyst Support
  • 50% Discount on Next Update
most popular

Five User License

$ 4399     $3999
  • All Sections, Five Users
  • Five Prints Allowed
  • Email Delivery in PDF
  • Free Limited Customisation
  • Post Sales Analyst Support
  • 50% Discount on Next Update

Corporate License

$ 5499     $4999
  • All Sections, Unlimited Users
  • Unlimited Prints Allowed
  • Email Delivery in PDF + Excel
  • Free Limited Customisation
  • Post Sales Analyst Support
  • 50% Discount on Next Update

Any Question? Speak With An Analyst

Contact Analyst

View A Sample

Request Sample

Did You Miss Anything, Ask Now

Request Customisation
Why Expert Market Research?

Right People

We are technically excellent, strategic, practical, experienced and efficient; our analysts are hand-picked based on having the right attributes to work successfully and execute projects based on your expectations.

Right Methodology

We leverage our cutting-edge technology, our access to trusted databases, and our knowledge of the current models used in the market to deliver you research solutions that are tailored to your needs and put you ahead of the curve.

Right Price

We deliver in-depth and superior quality research in prices that are reasonable, unmatchable, and shows our understanding of your resource structure. We, additionally, offer attractive discounts on our upcoming reports.

Right Support

Our team of expert analysts are at your beck and call to deliver you optimum results that are customised to meet your precise needs within the specified timeframe and help you form a better understanding of the industry.

NEWSLETTER