

Consumer Insights
Uncover trends and behaviors shaping consumer choices today
Procurement Insights
Optimize your sourcing strategy with key market data
Industry Stats
Stay ahead with the latest trends and market analysis.
The Brazil footwear market reached a value of USD 18.51 Billion in 2025, and it’s projected to grow at a CAGR of around 5.60% across 2026-2035. Sandals and sneakers stay everyday staples, online shopping keeps climbing, athleisure has gone mainstream, and the local factory base runs deep. Together, those forces should push the market to USD 31.92 Billion by 2035.
Compound Annual Growth Rate
5.6%
Value in USD Billion
2026-2035
Read more about this report - REQUEST FREE SAMPLE COPY IN PDF
| Brazil Footwear Market Report Summary | Description | Value |
| Base Year | USD Billion | 2025 |
| Historical Period | USD Billion | 2019-2025 |
| Forecast Period | USD Billion | 2026-2035 |
| Market Size 2025 | USD Billion | 18.51 |
| Market Size 2035 | USD Billion | 31.92 |
| CAGR 2019-2025 | Percentage | XX% |
| CAGR 2026-2035 | Percentage | 5.60% |
| CAGR 2026-2035 - Market by Region | Minas Gerais | 8.5% |
| CAGR 2026-2035 - Market by Region | Bahia | 7.8% |
| CAGR 2026-2035 - Market by Type | Non-Athletic | 6.2% |
| CAGR 2026-2035 - Market by End-User | Women | 6.3% |
| Market Share by Region | São Paulo | 31.4% |
The Brazil footwear market is changing fast. Digital retail, sustainability, and shifting export routes are reshaping how brands make and sell shoes. Global sportswear giants now go head-to-head with long-established local manufacturers. And consolidation and trade pressure keep redrawing the map, rewarding the brands that adapt quickly.
Alpargatas, the company behind Havaianas, posted record revenue of about R$4.6 billion for 2025. That cemented its lead in Brazil’s sandals and flip-flops space, as the brand leaned into premium lines and widened its footwear distribution at home and abroad.
Azzas 2154, the group formed by the 2024 Arezzo and Soma merger, closed an Arezzo shoe plant in southern Brazil during 2025. The move sharpened its focus on premium women’s footwear across a network of more than 1,000 stores.
Adidas leaned further into its local-for-local model in Brazil through 2025, making more footwear at home to cut lead times and inventory risk. That got sneakers and athletic ranges to market faster across its Brazilian retail and wholesale channels.
Grendene, the maker of Melissa, Ipanema, and Rider, held its place as the Brazil’s largest footwear exporter by value through 2024. It scaled up production of injected-plastic sandals and expanded the distribution into the Americas, Europe, and the Middle East.
Online retail is reshaping the Brazil footwear market, and it’s now the fastest-growing channel. E-commerce shoe sales should rise about 7 percent a year, with sellers like Netshoes and Centauro reaching shoppers in smaller cities and younger buyers.
Sustainability is feeding Brazil footwear market growth, with eco sneakers gaining ground. Brazilian-rooted brands Veja, sold locally as Vert, and Cariuma build shoes from wild rubber, organic cotton, and bamboo, tapping demand for responsibly made footwear among style-conscious buyers.
US tariffs are redrawing the Brazil footwear industry’s export map. After Washington’s 50 percent duty kicked in during August 2025 and hit Franca’s shoe cluster, producers shifted volumes toward China and Asian buyers, helping Brazil close 2025 with record exports.
Athleisure keeps lifting the Brazil footwear market, with athletic styles in steady demand. Vulcabras-owned Olympikus leads in sports footwear, while Nike, Adidas, and Puma fight it out on running and lifestyle sneakers, backed by Brazil’s big base of sports fans.
Strong home demand is holding up the Brazil footwear market. Abicalçados pointed to resilient 2025 sales, and the renewed Brazilian Footwear program put over R$32 million behind export promotion across two years, reinforcing yearly output of roughly 930 million pairs.
The report of Expert Market Research’s titled "Brazil Footwear Market Report and Forecast 2026-2035" offers a detailed analysis of the market based on the following segments:
Market Breakup by Type
Key Insight: Non-athletic footwear is the leader in the Brazil footwear market, and it’s easy to see why. The country lives in sandals and flip-flops, and the warm climate only reinforces that. Brands like Havaianas, Ipanema, and Melissa keep the category strong at every income level. Athletic footwear, though, is growing faster, helped by the athleisure wave and names such as Nike, Adidas, and Olympikus.
Market Breakup by End User
Key Insight: Women make up the biggest end-user group in the Brazil footwear market. They buy more often, follow fashion closely, and have a deep local supply of styles from Arezzo, Schutz, and Azaleia to pick from. Men are a steady group, split between athletic sneakers and casual shoes. Children’s footwear is smaller, but it holds up well thanks to frequent replacement as kids grow.
Market Breakup by Distribution Channel
Key Insight: Offline retail still takes most of the Brazil footwear market. Specialist chains, department stores, and the simple habit of trying shoes on before buying keep it ahead, with Centauro leading physical sales. Online, though, is the fast mover. It’s growing at around 7 percent a year, as marketplaces, brand apps, and pure-play sellers like Netshoes reach into interior cities and younger shoppers.
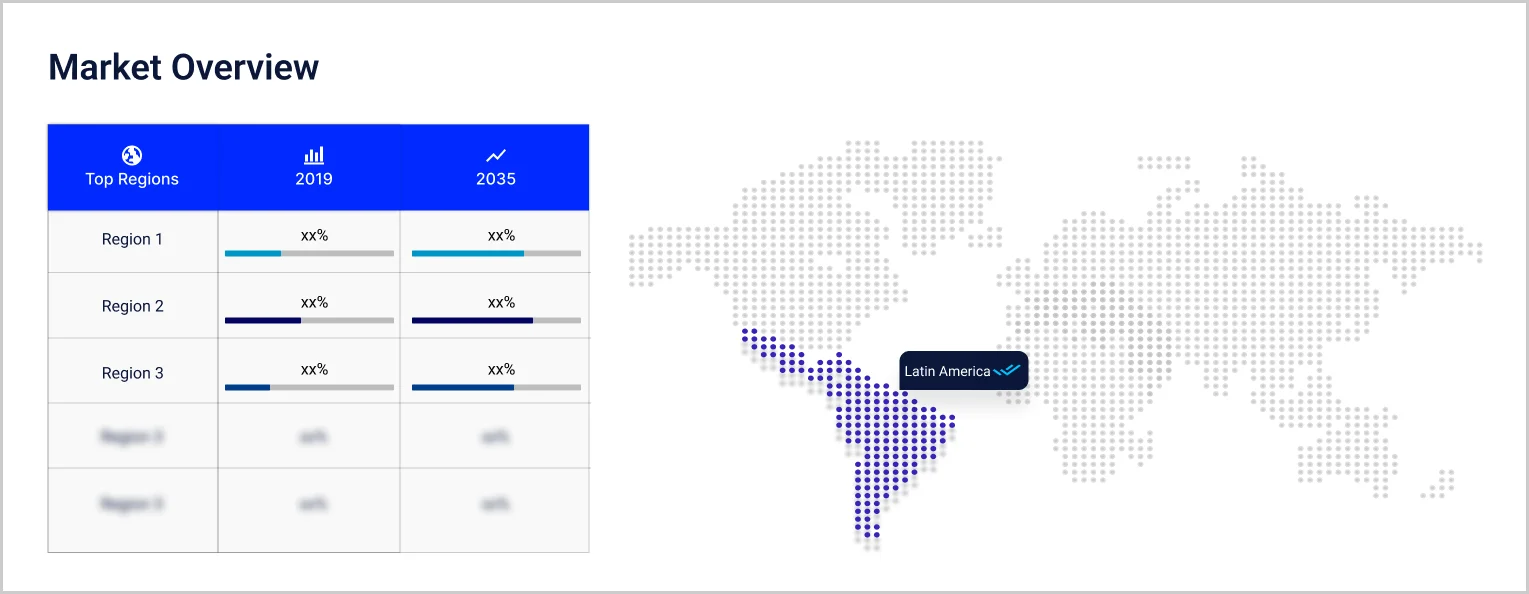
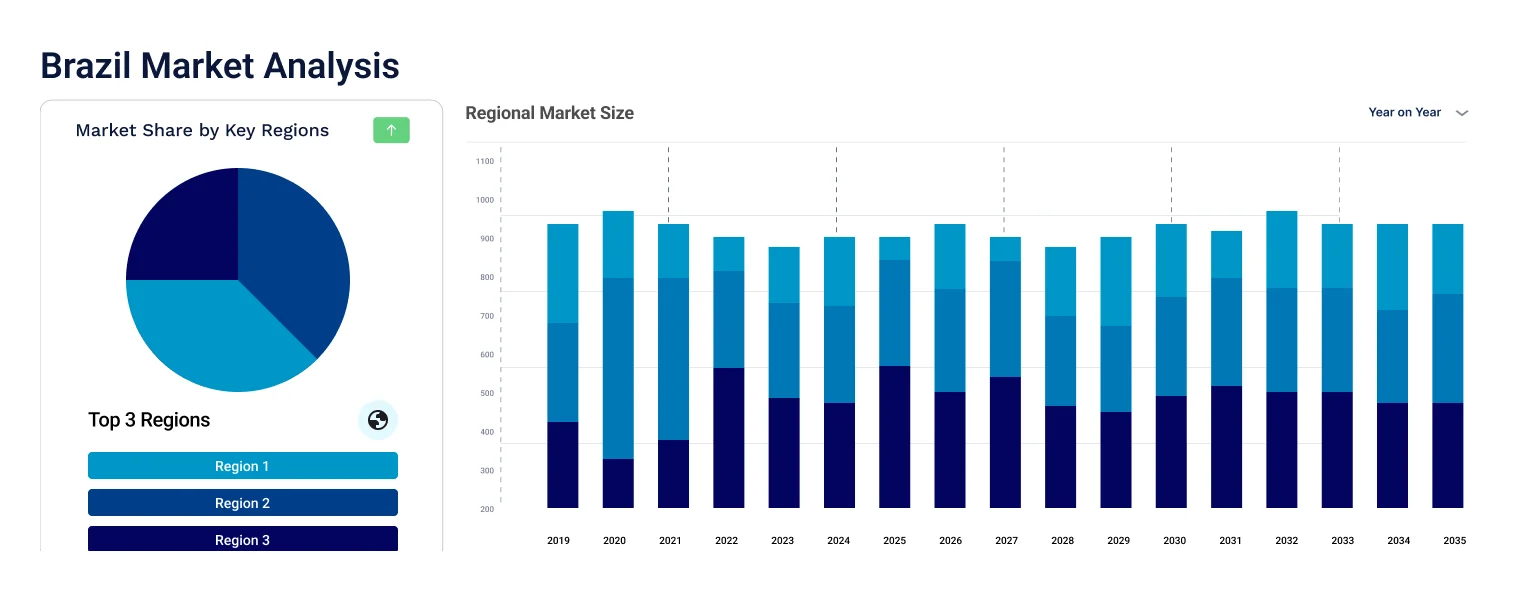
Market Breakup by Region
Key Insight: São Paulo sits at the heart of the Brazil footwear market. It has the biggest consumer base, the highest incomes, the densest retail network, and the historic shoe-making cluster of Franca. Rio Grande do Sul carries real industrial weight too, thanks to the Vale dos Sinos belt around Novo Hamburgo, which supplies much of the country’s production and exports. Minas Gerais is coming up fast, Rio de Janeiro adds fashion-led city demand, and Bahia anchors the northeast, where rising incomes and new malls keep shoe sales ticking along.
By Type, non-athletic footwear dominates the market due to Brazil’s sandal culture and warm climate
Non-athletic footwear holds the largest share of the Brazil footwear market. It reflects a culture built around sandals, flip-flops, and easy casual styles that suit the heat. Local icons like Havaianas, Ipanema, and Melissa give the category huge reach across income tiers, and Grendene’s injected-plastic know-how keeps prices low and volumes high.
Athletic footwear is the faster-growing type. Athleisure and a large, active population are the main reasons. Nike, Adidas, and Puma compete hard with Vulcabras-owned Olympikus, the home favourite in sports shoes. And through 2025, Adidas expanded local-for-local production to get sneakers out faster, a sign of how global players keep doubling down on Brazil.
By End User, women account for the dominant share of the market due to fashion-led demand and higher purchase frequency
Women are the dominant end-user group in the Brazil footwear market. Frequent purchases, strong fashion interest, and a deep supply of women’s designs all play a part. Labels like Arezzo, Schutz, and Azaleia serve this base across heels, flats, sandals, and sneakers, and the fast pace of new trends keeps shoppers coming back.
Men and children make up the rest. Men lean toward athletic sneakers and hard-wearing casual shoes, with sports brands and value chains both chasing them. Children’s footwear is smaller, but it’s steady, driven by how often growing kids need new pairs. In 2025, more e-commerce simply made it easier for families to compare and buy.
By Distribution Channel, offline retail accounts for the dominant share of the market due to established stores and try-on preference
Offline retail still takes the dominant share of the Brazil footwear market. Specialist chains, department stores, and independent shops form the backbone, and plenty of shoppers want to try shoes for fit before they pay. Big retailers like Centauro keep strong nationwide footprints, and stores remain key to brand experience and impulse buys.
The online channel is the quickest to grow, rising around 7 percent a year toward the early 2030s. Pure-play seller Netshoes, marketplaces, and brand-owned apps widen access well beyond the big capitals. Through 2025, footwear brands kept pouring money into direct digital sales and faster delivery, and that keeps changing how people buy.
Read more about this report - REQUEST FREE SAMPLE COPY IN PDF
São Paulo dominates the market due to its large population, high incomes, and historic footwear cluster
São Paulo leads the Brazil footwear market. It pairs the country’s biggest consumer base and highest incomes with Franca, the historic shoe-making hub. The state holds the major retail networks, the brand head offices, and the densest store coverage anywhere in Brazil. Strong malls and deep e-commerce logistics keep demand steady, so it’s the first stop for both global sportswear brands and the leading local makers.
Rio Grande do Sul is a heavyweight for the Brazil footwear market. The Vale dos Sinos belt around Novo Hamburgo has long been the centre of the country’s shoe production and exports. Skilled workers and tight supplier clusters keep output flowing. Through 2025, Abicalçados-backed export promotion and rising local demand helped the state, even as US tariffs pushed producers toward Asian buyers.
The Brazil footwear market is fragmented and fiercely competitive. Global sportswear brands sit alongside deep-rooted local manufacturers. Nike, Adidas, Puma, Asics, Skechers, and Under Armour drive sports and lifestyle, while VF Corporation and Crocs add casual and outdoor depth. At home, groups like Grendene, Alpargatas, Vulcabras, and Azzas 2154 hold strong positions of their own.
Competition is heating up around e-commerce, sustainability, and speed-to-market. Global players are making more shoes locally and selling more online, while Brazilian makers lean on scale, low costs, and brand heritage to defend their turf.
Nike, Inc. was founded in 1964 and is based in Beaverton, Oregon. It’s the world’s largest athletic footwear and apparel company. In Brazil, it sits at the front of the sports and lifestyle segments, with running, basketball, training, and sneaker lines sold through retail partners, brand stores, and its own digital channels. Strong branding, athlete deals, and steady innovation keep it near the top.
Adidas AG dates back to 1949 and is based in Herzogenaurach, Germany. It’s one of the world’s leading sportswear makers. In Brazil, the company has gone local-for-local, making more shoes at home to cut lead times and react faster to demand. Franchises like Originals and its running lines, along with wide distribution, keep it prominent in the market.
Skechers U.S.A., Inc was founded in 1992 and is based in Manhattan Beach, California. It’s a well-known lifestyle and performance brand built on comfort at accessible prices. In Brazil, it has grown through its own stores, retail partners, and e-commerce, winning over shoppers who want everyday comfort and value. That mix has earned it a steady, loyal following.
VF Corporation was founded in 1899 and is based in Denver, Colorado. Its footwear brands include Vans, Timberland, and The North Face. In Brazil, VF covers casual, skate, and outdoor footwear through these labels, selling via stores, wholesale partners, and online. That spread of brands gives it real reach with younger, fashion-led, and outdoor-minded buyers.
Other key players in the market are Crocs, Inc., PUMA SE, Asics Corp., Under Armour, Inc., Burberry Limited, LVMH Moet Hennessy Louis Vuitton SE, and others.
*Please note that this is only a partial list; the complete list of key players is available in the full report. Additionally, the list of key players can be customized to better suit your needs.*
Get a real edge with our Brazil Footwear Market report for 2026-2035. It’s packed with detail on footwear types, end-user demand, channel shifts, and what the leading players are doing, so you can act with confidence. Whether you’re stepping into Brazil’s footwear sector or fine-tuning your plan, download your free sample today and see what’s possible.
Upto 15% Off
USD
$2499 $2249
$3999 $3599
$4999 $4249
$5999 $5099


*While we strive to always give you current and accurate information, the numbers depicted on the website are indicative and may differ from the actual numbers in the main report. At Expert Market Research, we aim to bring you the latest insights and trends in the market. Using our analyses and forecasts, stakeholders can understand the market dynamics, navigate challenges, and capitalize on opportunities to make data-driven strategic decisions.*
The market is estimated to grow at a CAGR of 5.60% between 2026 and 2035.
The market is being driven by the rising disposable incomes and growing fashion consciousness among consumers.
The key trends aiding the market expansion include the production of smart footwear and the growth of e-commerce platforms.
The major regions considered in the market are São Paulo, Minas Gerais, Rio de Janeiro, Bahia, and Rio Grande do Sul.
The major distribution channels of footwear include online and offline.
The major players in the market are Nike, Inc., Adidas AG, Skechers U.S.A., Inc, VF Corporation, Crocs, Inc., PUMA SE, Asics Corp., Under Armour®, Inc., Burberry Limited, and LVMH Moet Hennessy Louis Vuitton SE, among others.
In 2025, the market attained a value of nearly USD 18.51 Billion.
The market is estimated to witness a healthy growth in the forecast period of 2026-2035 to reach about USD 31.92 Billion by 2035.
Explore our key highlights of the report and gain a concise overview of key findings, trends, and actionable insights that will empower your strategic decisions.
| REPORT FEATURES | DETAILS |
| Base Year | 2025 |
| Historical Period | 2019-2025 |
| Forecast Period | 2026-2035 |
| Scope of the Report |
Historical and Forecast Trends, Industry Drivers and Constraints, Historical and Forecast Market Analysis by Segment:
|
| Breakup by Type |
|
| Breakup by End User |
|
| Breakup by Distribution Channel |
|
| Breakup by Region |
|
| Market Dynamics |
|
| Competitive Landscape |
|
| Companies Covered |
|
Datasheet
One User
USD 2,499
USD 2,249
tax inclusive*
Single User License
One User
USD 3,999
USD 3,599
tax inclusive*
Five User License
Five User
USD 4,999
USD 4,249
tax inclusive*
Corporate License
Unlimited Users
USD 5,999
USD 5,099
tax inclusive*
*Please note that the prices mentioned below are starting prices for each bundle type. Kindly contact our team for further details.*
Flash Bundle
Small Business Bundle
Growth Bundle
Enterprise Bundle
*Please note that the prices mentioned below are starting prices for each bundle type. Kindly contact our team for further details.*
Flash Bundle
Number of Reports: 3
20%
tax inclusive*
Small Business Bundle
Number of Reports: 5
25%
tax inclusive*
Growth Bundle
Number of Reports: 8
30%
tax inclusive*
Enterprise Bundle
Number of Reports: 10
35%
tax inclusive*
How To Order

Select License Type
Choose the right license for your needs and access rights.

Click on ‘Buy Now’
Add the report to your cart with one click and proceed to register.

Select Mode of Payment
Choose a payment option for a secure checkout. You will be redirected accordingly.
Strategic Solutions for Informed Decision-Making
Gain insights to stay ahead and seize opportunities.

Get insights & trends for a competitive edge.

Track prices with detailed trend reports.

Analyse trade data for supply chain insights.

Leverage cost reports for smart savings

Enhance supply chain with partnerships.

Connect For More Information
Our expert team of analysts will offer full support and resolve any queries regarding the report, before and after the purchase.
Our expert team of analysts will offer full support and resolve any queries regarding the report, before and after the purchase.
We employ meticulous research methods, blending advanced analytics and expert insights to deliver accurate, actionable industry intelligence, staying ahead of competitors.
Our skilled analysts offer unparalleled competitive advantage with detailed insights on current and emerging markets, ensuring your strategic edge.
We offer an in-depth yet simplified presentation of industry insights and analysis to meet your specific requirements effectively.


