

Consumer Insights
Uncover trends and behaviors shaping consumer choices today
Procurement Insights
Optimize your sourcing strategy with key market data
Industry Stats
Stay ahead with the latest trends and market analysis.

The global clean labelled food additives market size is estimated to grow in the forecast period of 2026-2035 at a CAGR of 7.50%.
Base Year
Historical Period
Forecast Period
Compound Annual Growth Rate
7.5%
2026-2035
*this image is indicative*
| Global Clean Labelled Food Additives Market Report Summary | Description | Value |
| Base Year | USD Million | 2025 |
| Historical Period | USD Million | 2019-2025 |
| Forecast Period | USD Million | 2026-2035 |
| Market Size 2025 | USD Million | XX |
| Market Size 2035 | USD Million | XX |
| CAGR 2019-2025 | Percentage | XX% |
| CAGR 2026-2035 | Percentage | 7.50% |
| CAGR 2026-2035 - Market by Region | Latin America | 8.1% |
| CAGR 2026-2035 - Market by Country | China | 8.0% |
| CAGR 2026-2035 - Market by Country | USA | 7.9% |
| CAGR 2026-2035 - Market by Type | Natural Preservatives | 8.3% |
| CAGR 2026-2035 - Market by Application | Beverages | 8.2% |
| Market Share by Country 2025 | Italy | 2.7% |
The Asia Pacific region is expected to hold a significant share in the clean labelled food additives market during the forecast period on account of surging living standards of consumers. In this region, the consumers are progressively taking time to verify the ingredient list of products before purchasing. The surge in demand for convenience goods coupled with clean labels is further expected to fuel the market growth across the region.
China accounts for the largest market in the Asia-Pacific region due to the rising awareness of clean labelled ingredients. There is an increasing focus of key players in the Asia Pacific on encouraging the advantages of clean label ingredients. This is because of the increasing interest of consumers in following healthy eating habits coupled with a rise in awareness of ingredients utilised in the food products.
Read more about this report - REQUEST FREE SAMPLE COPY IN PDF
Global Clean Labelled Food Additives Market Report and Forecast 2026-2035 offers a detailed analysis of the market based on the following segments:
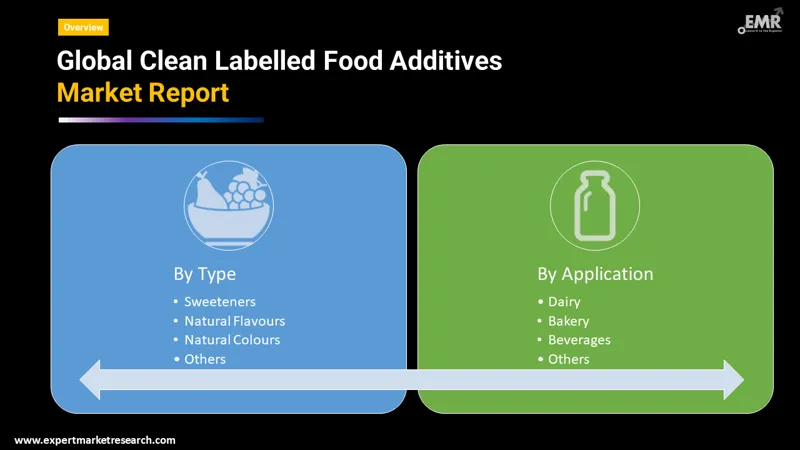
Market Breakup by Type
Market Breakup by Application
Market Breakup by Region
Read more about this report - REQUEST FREE SAMPLE COPY IN PDF
| CAGR 2026-2035 - Market by | Country |
| China | 8.0% |
| USA | 7.9% |
| Mexico | 7.8% |
| UK | 7.7% |
| Saudi Arabia | 7.2% |
| Canada | XX% |
| Germany | 6.9% |
| Italy | XX% |
| Japan | XX% |
| India | XX% |
| Australia | XX% |
| Brazil | XX% |
| France | 6.6% |
The clean labelled food additives market is projected to witness growth on account of the surging demand for eating healthier meals along with surging awareness among consumers for health consciousness. Government regulatory bodies of various countries are getting engaged in labelling the products from various industries owing to the increasing number of artificial products in the industry boosting market growth.
The Food and Drug Administration (FDA) of the United States for example, is accountable for ensuring that foods traded in the country are safe, wholesome and properly labelled. Moreover, various food service providers like restaurants are shifting toward the clean-label trend which is further expected to propel the market demand during the forecast period.


The report presents a detailed analysis of the following key players in the global clean labelled food additives market, looking into their capacity, market shares, and latest developments like capacity expansions, plant turnarounds, and mergers and acquisitions:
The comprehensive report looks into the macro and micro aspects of the market. The EMR report gives an in-depth insight into the market by providing a SWOT analysis as well as an analysis of Porter’s Five Forces model.
Upto 15% Off
USD
$2499 $2249
$3999 $3599
$4999 $4249
$5999 $5099


*While we strive to always give you current and accurate information, the numbers depicted on the website are indicative and may differ from the actual numbers in the main report. At Expert Market Research, we aim to bring you the latest insights and trends in the market. Using our analyses and forecasts, stakeholders can understand the market dynamics, navigate challenges, and capitalize on opportunities to make data-driven strategic decisions.*
Get in touch with us for a customized solution tailored to your unique requirements and save upto 35%!
The global market is assessed to grow at a CAGR of 7.50% between 2026 and 2035.
The major market drivers are the growing food and beverage industry and surging awareness among consumers for health consciousness.
The key market trends include the growing shift toward the clean-label trend and surging consciousness regarding food and beverage products being consumed.
The major regions in the market identified by the EMR report are North America, Europe, Asia Pacific, Latin America, the Middle East, and Africa.
The various types in the market include sweeteners, natural flavours, natural colours, natural preservatives, and starch, among others.
The various applications in the market include dairy, snacks and cereals, beverages, meat and meat-based products, sauce and condiments, and bakery, among others.
The major players in the market are Kerry Group plc, Archer Daniels Midland Company, Koninklijke DSM N.V., Cargill, Incorporated, Corbion NV, Tate & Lyle PLC, among others.
Explore our key highlights of the report and gain a concise overview of key findings, trends, and actionable insights that will empower your strategic decisions.
| REPORT FEATURES | DETAILS |
| Base Year | 2025 |
| Historical Period | 2019-2025 |
| Forecast Period | 2026-2035 |
| Scope of the Report |
Historical and Forecast Trends, Industry Drivers and Constraints, Historical and Forecast Market Analysis by Segment:
|
| Breakup by Type |
|
| Breakup by Application |
|
| Breakup by Region |
|
| Market Dynamics |
|
| Competitive Landscape |
|
| Companies Covered |
|
Datasheet
One User
USD 2,499
USD 2,249
tax inclusive*
Single User License
One User
USD 3,999
USD 3,599
tax inclusive*
Five User License
Five User
USD 4,999
USD 4,249
tax inclusive*
Corporate License
Unlimited Users
USD 5,999
USD 5,099
tax inclusive*
*Please note that the prices mentioned below are starting prices for each bundle type. Kindly contact our team for further details.*
Flash Bundle
Small Business Bundle
Growth Bundle
Enterprise Bundle
*Please note that the prices mentioned below are starting prices for each bundle type. Kindly contact our team for further details.*
Flash Bundle
Number of Reports: 3
20%
tax inclusive*
Small Business Bundle
Number of Reports: 5
25%
tax inclusive*
Growth Bundle
Number of Reports: 8
30%
tax inclusive*
Enterprise Bundle
Number of Reports: 10
35%
tax inclusive*
How To Order

Select License Type
Choose the right license for your needs and access rights.

Click on ‘Buy Now’
Add the report to your cart with one click and proceed to register.

Select Mode of Payment
Choose a payment option for a secure checkout. You will be redirected accordingly.
Strategic Solutions for Informed Decision-Making
Gain insights to stay ahead and seize opportunities.

Get insights & trends for a competitive edge.

Track prices with detailed trend reports.

Analyse trade data for supply chain insights.

Leverage cost reports for smart savings

Enhance supply chain with partnerships.

Connect For More Information
Our expert team of analysts will offer full support and resolve any queries regarding the report, before and after the purchase.
Our expert team of analysts will offer full support and resolve any queries regarding the report, before and after the purchase.
We employ meticulous research methods, blending advanced analytics and expert insights to deliver accurate, actionable industry intelligence, staying ahead of competitors.
Our skilled analysts offer unparalleled competitive advantage with detailed insights on current and emerging markets, ensuring your strategic edge.
We offer an in-depth yet simplified presentation of industry insights and analysis to meet your specific requirements effectively.


Share