

Consumer Insights
Uncover trends and behaviors shaping consumer choices today
Procurement Insights
Optimize your sourcing strategy with key market data
Industry Stats
Stay ahead with the latest trends and market analysis.
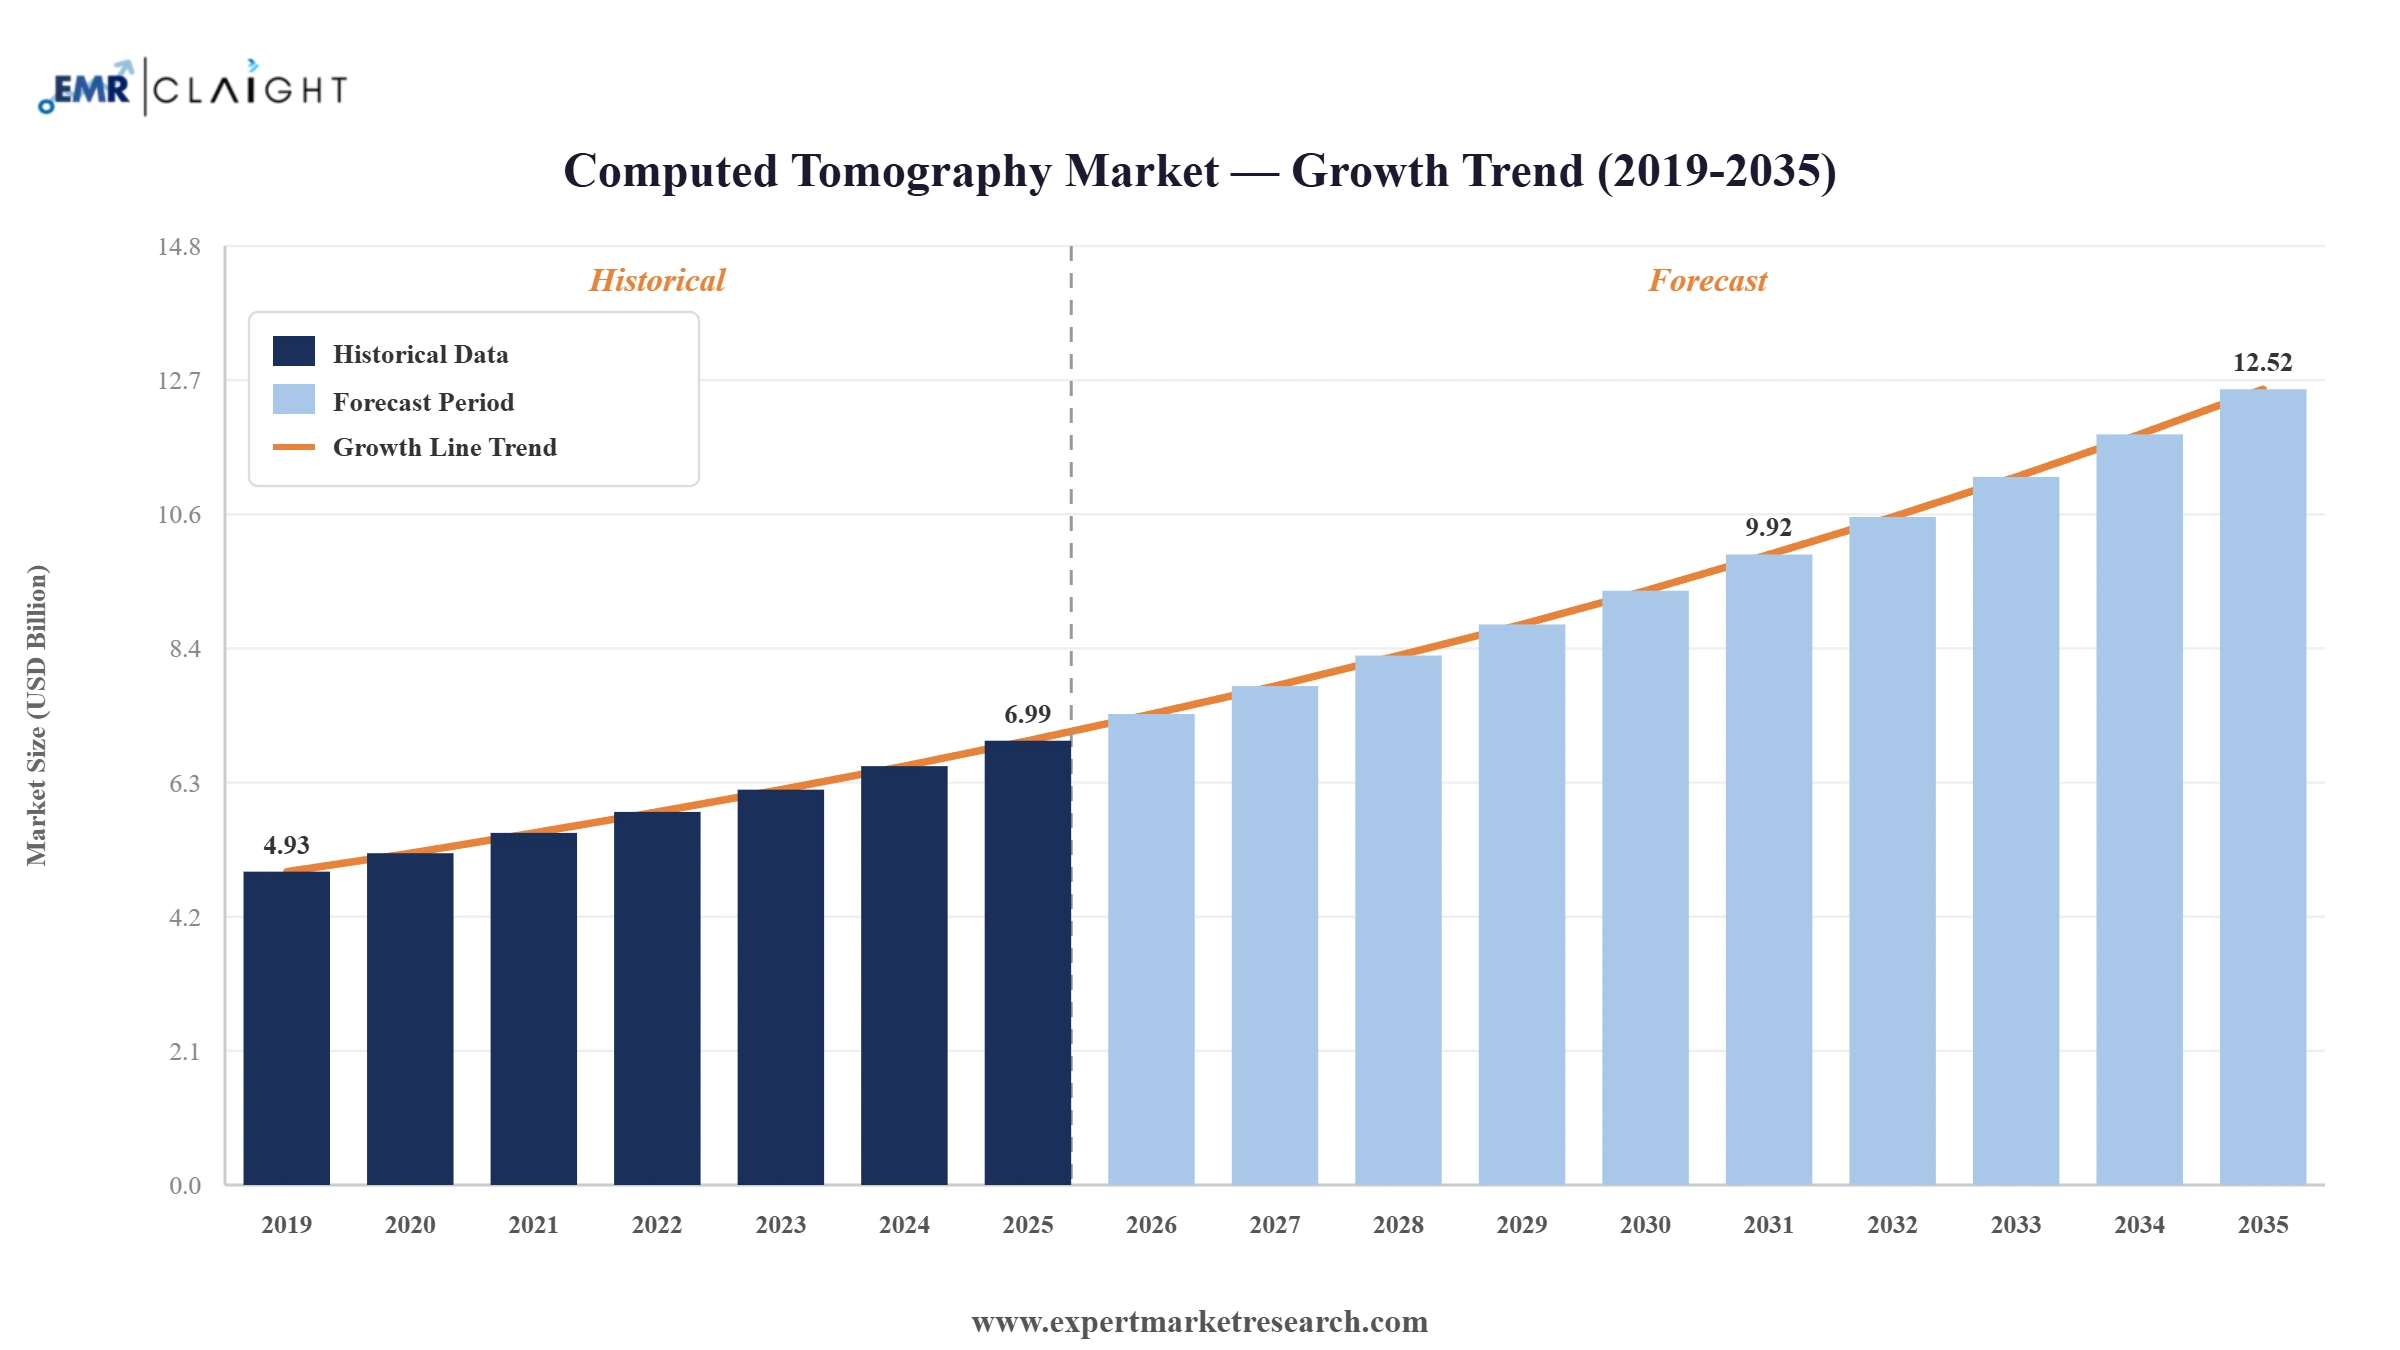
The global computed tomography market was valued at USD 6.99 Billion in 2025. The industry is expected to grow at a CAGR of 6.00% during the forecast period of 2026-2035 to attain a valuation of USD 12.52 Billion by 2035, driven by the rising demand for diagnostics.
Read more about this report - REQUEST FREE SAMPLE COPY IN PDF
Computed Tomography (CT) or Computerised Axial Tomography (CAT) scan is an imaging modality that uses X-rays to form cross-sectional images of the body. This technique is also called as computerised axial tomography or computerized tomography.
In the CT scan, a picture is being created that depicts the bones, organs, and other tissues in a thin slice of the body. The computer programs are used to create these pictures, which can be visualized in the two dimensional and three-dimensional view. This is mainly utilized for the diagnostic purposes in the detection of the several disorders including circulatory diseases, such as blood clots, blood vessel aneurysms, coronary artery disease, spinal disorders, inflammatory diseases, kidney and bladder stones, and injuries to the internal organs.
The modern CT machines take the continuous pictures in a helical fashion rather than the original individual pictures being taken by the traditional machines. Thus, this has facilitated the faster and accurate results and aid in the detection of the minor abnormalities present in the body.
Computed Tomography Market Report and Forecast 2026-2035 offers a detailed analysis of the market based on the following segments:
Market Breakup by Technology
Market Breakup by Application
Market Breakup by Modality
Market Breakup by End User
Market Breakup by Regions


Read more about this report - REQUEST FREE SAMPLE COPY IN PDF
CT scan is one of the most important tests conducted for diagnosis, especially after accidents, for scanning bone, soft tissue, and blood vessels and for understanding the severity of the damage. The growth of the computed tomography scans market is primarily driven by the rapid technological developments in the market. The rising prevalence of chronic diseases, like orthopaedics, cancer, cardiovascular, and neurological conditions has further increased the demand for CT scans. Advancements in technology for CT scan leads to better diagnoses, which saves the patients from unnecessary medical procedures, and expenses. It also speeds up the treatment procedure by providing the physician with clear anatomical images, leading to faster treatment procedure and recovery thereafter.
The computed tomography market, based on application, is dominated by the oncology segment due to the rapidly rising prevalence of cancer across the globe. Cancers of all type are rising due to the changing lifestyles of the people and thus the demand for cancer tests is also rising rapidly. Early diagnosis can help the patients tackle the disease at the earliest.
Orthopaedics and neurology segments are also likely to account for significant shares due to the rising cases of accidents, along with the rising geriatric population across the globe. The rising interest of the youth in sports has also increased the number of different injuries, especially ligament tears, which further highlights the importance of CT scans.
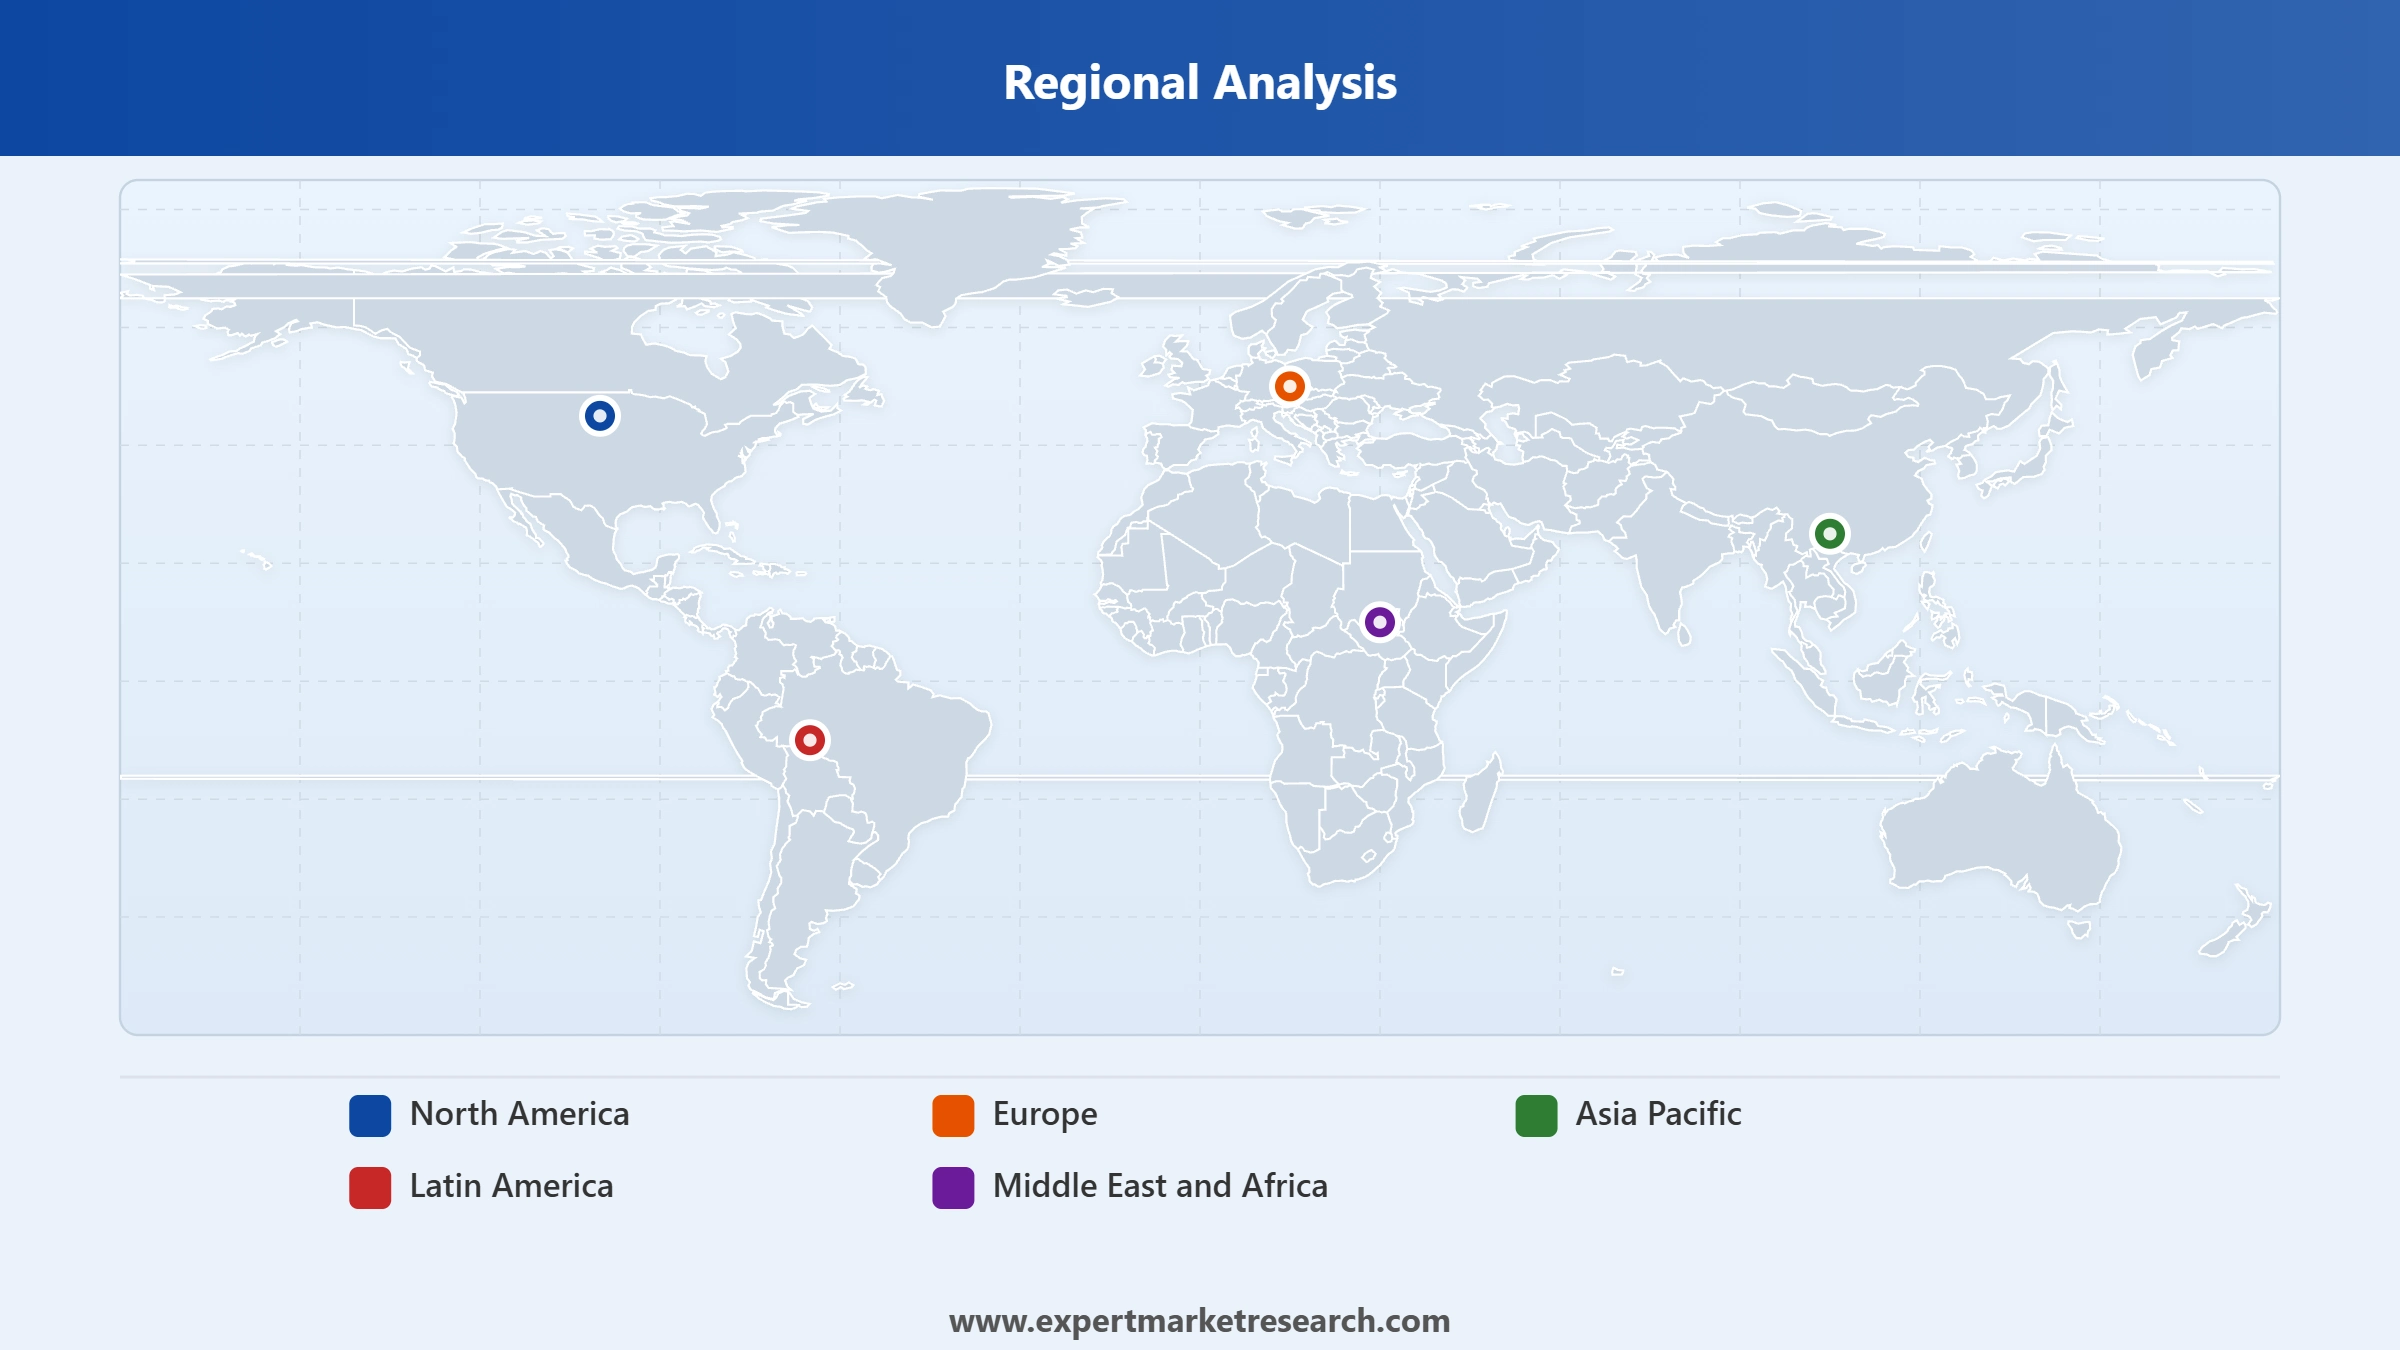
North America has been dominating the global market in terms of number of CT scans required every year. This dominance can be attributed to the robust rise in the prevalence of cancer cases in the region every year, especially in the United States. There were more than 1.9 million cancer cases diagnosed in the United States in 2023 alone and the number has been constantly rising, further propelling the demand for computed tomography scans for timely diagnosis of the disease. The United States is also the leading regions in terms of technological advancements and has introduced various technological developments in the CT scans as well. Introduction of artificial intelligence in these systems, along with the developments like reduced launch of low radiation inducing machines.
Other regions, like Europe and Asia Pacific, are also witnessing higher demand for CT scans due to the rising geriatric population as well as the rapid technological advancements in medical industry.
Read more about this report - REQUEST FREE SAMPLE COPY IN PDF
The computed tomography market has recently seen a lot of technological advances and is anticipated to witness a lot more in the coming years as well. Some of the recent features in the CT scan machines are as follows:
There are many other developments in the market done by the key players to make the whole procedure a lot easier.
The report gives an in-depth analysis of the key players involved in the computed tomography market, sponsors manufacturing the machine, and working on the technological developments. The key companies included in the market are as follows:
Upto 15% Off
USD
$3299 $2969
$5499 $4949
$6999 $5949
$8199 $6969


*While we strive to always give you current and accurate information, the numbers depicted on the website are indicative and may differ from the actual numbers in the main report. At Expert Market Research, we aim to bring you the latest insights and trends in the market. Using our analyses and forecasts, stakeholders can understand the market dynamics, navigate challenges, and capitalize on opportunities to make data-driven strategic decisions.*
The market attained a value of nearly USD 6.99 Billion in 2025.
The market is projected to grow at a CAGR of 6.00% during the forecast period of 2026-2035.
The market is estimated to witness a healthy growth in the forecast period of 2026-2035 to reach USD 12.52 Billion by 2035.
The growth of the market is driven by factors like rising demand for CT scans due to increased geriatric population, chronic diseases, and rising sports casualties.
The rapid technological advancements in the market act as key trends for the market.
The major regions in the market are North America, Latin America, the Middle East and Africa, Europe, and the Asia Pacific, with North America accounting for the largest share of the market.
The key technologies in the market include high slice, mid slice, low slice, and cone beam computed tomography (CBCT).
Computed tomography finds wide applications in orthopaedics, cardiovascular, oncology, and neurology, among others.
The modalities in the market include O arm and C arm.
The end-use sectors include hospitals and ICUs, ambulatory surgical and diagnostic centres, nursing homes and maternity centres.
The key players in the market include General Electric Company, Hitachi, Ltd., Siemens Healthcare GmbH, Koninklijke Philips N.V., Neusoft Corporation, Canon Medical Systems Corporation, Carestream Health, Planmca Oy, Fujifilm Corporation, and NeuroLogica Corp., among others.
Explore our key highlights of the report and gain a concise overview of key findings, trends, and actionable insights that will empower your strategic decisions.
| REPORT FEATURES | DETAILS |
| Base Year | 2025 |
| Historical Period | 2019-2025 |
| Forecast Period | 2026-2035 |
| Scope of the Report |
Historical and Forecast Trends, Industry Drivers and Constraints, Historical and Forecast Market Analysis by Segment:
|
| Breakup by Technology |
|
| Breakup by Application |
|
| Breakup by Modality |
|
| Breakup by End User |
|
| Breakup by Region |
|
| Market Dynamics |
|
| Supplier Landscape |
|
| Companies Covered |
|
Datasheet
One User
USD 3,299
USD 2,969
tax inclusive*
Single User License
One User
USD 5,499
USD 4,949
tax inclusive*
Five User License
Five User
USD 6,999
USD 5,949
tax inclusive*
Corporate License
Unlimited Users
USD 8,199
USD 6,969
tax inclusive*
*Please note that the prices mentioned below are starting prices for each bundle type. Kindly contact our team for further details.*
Flash Bundle
Small Business Bundle
Growth Bundle
Enterprise Bundle
*Please note that the prices mentioned below are starting prices for each bundle type. Kindly contact our team for further details.*
Flash Bundle
Number of Reports: 3
20%
tax inclusive*
Small Business Bundle
Number of Reports: 5
25%
tax inclusive*
Growth Bundle
Number of Reports: 8
30%
tax inclusive*
Enterprise Bundle
Number of Reports: 10
35%
tax inclusive*
How To Order

Select License Type
Choose the right license for your needs and access rights.

Click on ‘Buy Now’
Add the report to your cart with one click and proceed to register.

Select Mode of Payment
Choose a payment option for a secure checkout. You will be redirected accordingly.
Strategic Solutions for Informed Decision-Making
Gain insights to stay ahead and seize opportunities.

Get insights & trends for a competitive edge.

Track prices with detailed trend reports.

Analyse trade data for supply chain insights.

Leverage cost reports for smart savings

Enhance supply chain with partnerships.

Connect For More Information
Our expert team of analysts will offer full support and resolve any queries regarding the report, before and after the purchase.
Our expert team of analysts will offer full support and resolve any queries regarding the report, before and after the purchase.
We employ meticulous research methods, blending advanced analytics and expert insights to deliver accurate, actionable industry intelligence, staying ahead of competitors.
Our skilled analysts offer unparalleled competitive advantage with detailed insights on current and emerging markets, ensuring your strategic edge.
We offer an in-depth yet simplified presentation of industry insights and analysis to meet your specific requirements effectively.


