

Consumer Insights
Uncover trends and behaviors shaping consumer choices today
Procurement Insights
Optimize your sourcing strategy with key market data
Industry Stats
Stay ahead with the latest trends and market analysis.
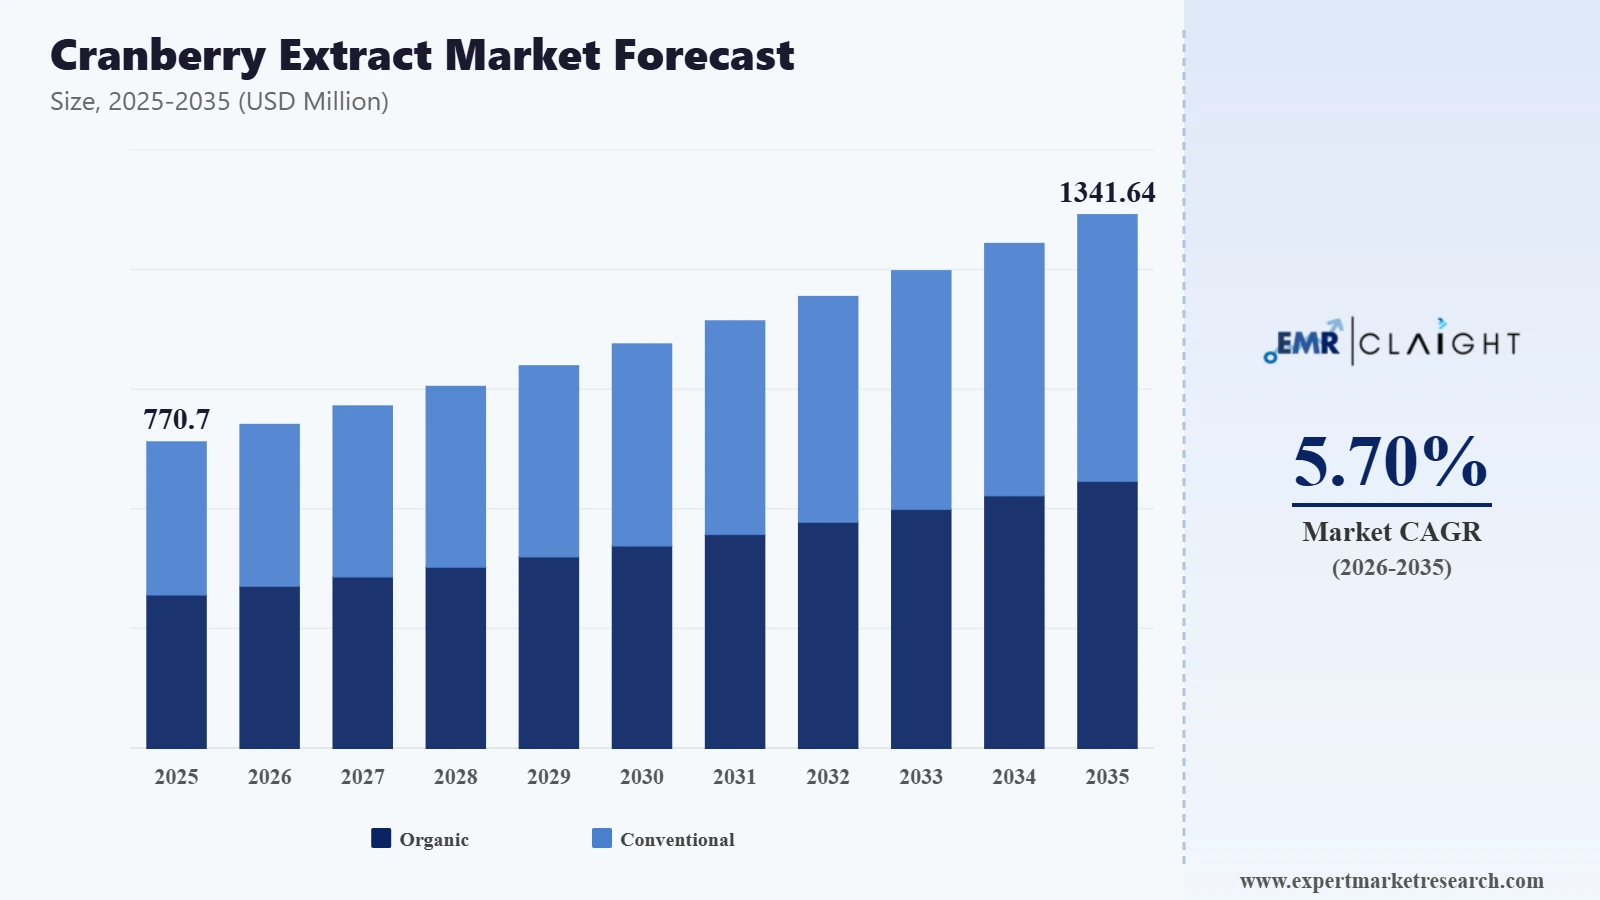
The global cranberry extract market size reached a value of nearly USD 770.70 Million in 2025. The market is projected to grow at a CAGR of 5.70% between 2026 and 2035 and reach around USD 1341.64 Million by 2035.
The market for cranberry extract is being driven by the rising demand for the product from the food and beverage industry as food colour.
The cranberry extract market is driven by the rising demand for natural flavours and pigmenting agents.
According to industry reports, around 75% of consumers are willing to pay more for natural and clean-label products.
Read more about this report - REQUEST FREE SAMPLE COPY IN PDF
The growing awareness regarding the benefits of using natural products is boosting the adoption of cranberry extract products as opposed to artificial agents. Cranberries and cranberry products are exported to various countries worldwide, with the United States and Canada being major exporters. European countries, such as the United Kingdom, Germany, and the Netherlands, are significant importers of cranberries.
Some of the factors driving the cranberry extract market growth are the growing popularity of natural food colour and the expanding food and beverage sector. Cranberries are known for their potential health benefits, including being a good source of antioxidants, vitamins, and minerals. They are often promoted for their potential to support urinary tract health. Only about 5% of cranberries produced in the United States are sold fresh, and the remaining 95% are processed, most commonly for juice and juice blends.
Health benefits of cranberries; rising demand for cranberry extract in food and beverage applications; surging preference for natural flavours; and the thriving cosmetics industry are favouring the cranberry extract market growth
Ocean Spray Cranberries Inc. introduced Snack Medley, a line of snackable dried-fruit mixes.
Naturex acquired the entire capital of Vegetable Juices Inc., a Chicago-based company with expertise in manufacturing and distributing natural vegetable ingredients.
Ocean Spray Cranberries, Inc. collaborated with The Hershey Co., headquartered in Pennsylvania, to launch a new line of fruit snacks that are dipped in chocolate.
ENI developed polyphenol sources with well-defined health advantages, tailored for inclusion in supplements, beverages, and powdered products.
Being a good source of antioxidants, vitamins, and minerals, cranberries are often promoted for their potential to support urinary tract health.
In the food and beverages sector, cranberry extracts are used as a natural food colour and flavouring agent.
The growing demand for natural flavours, driven by consumer demand for natural and clean-labelled products, is aiding the cranberry extract market growth.
Cranberry extract is used in the cosmetic industry as it is rich in antioxidants and Vitamin C, hence stimulating the natural rejuvenation of the skin.
Various pharmaceutical studies have linked the nutrients in cranberries to a lower risk of urinary tract infection (UTI), the prevention of certain types of cancer, improved immune function, and decreased blood pressure. Globally, the prevalence of urinary tract is growing. With over 400 million occurrences each year, bacterial urinary tract infections are the most common type of bacterial infection. Cranberry supplements are used in the treatment of the disease as they contain high proanthocyanidin content.
Furthermore, the growing focus towards innovations in cranberry extract products is leading consumers to prioritise additive-free food and beverages. Only about 5% of cranberries produced in the United States are sold fresh, and the remaining 95% are processed, most commonly for juice and juice blends.
Global Cranberry Extract Market Report and Forecast 2026-2035 offers a detailed analysis of the market based on the following segments:
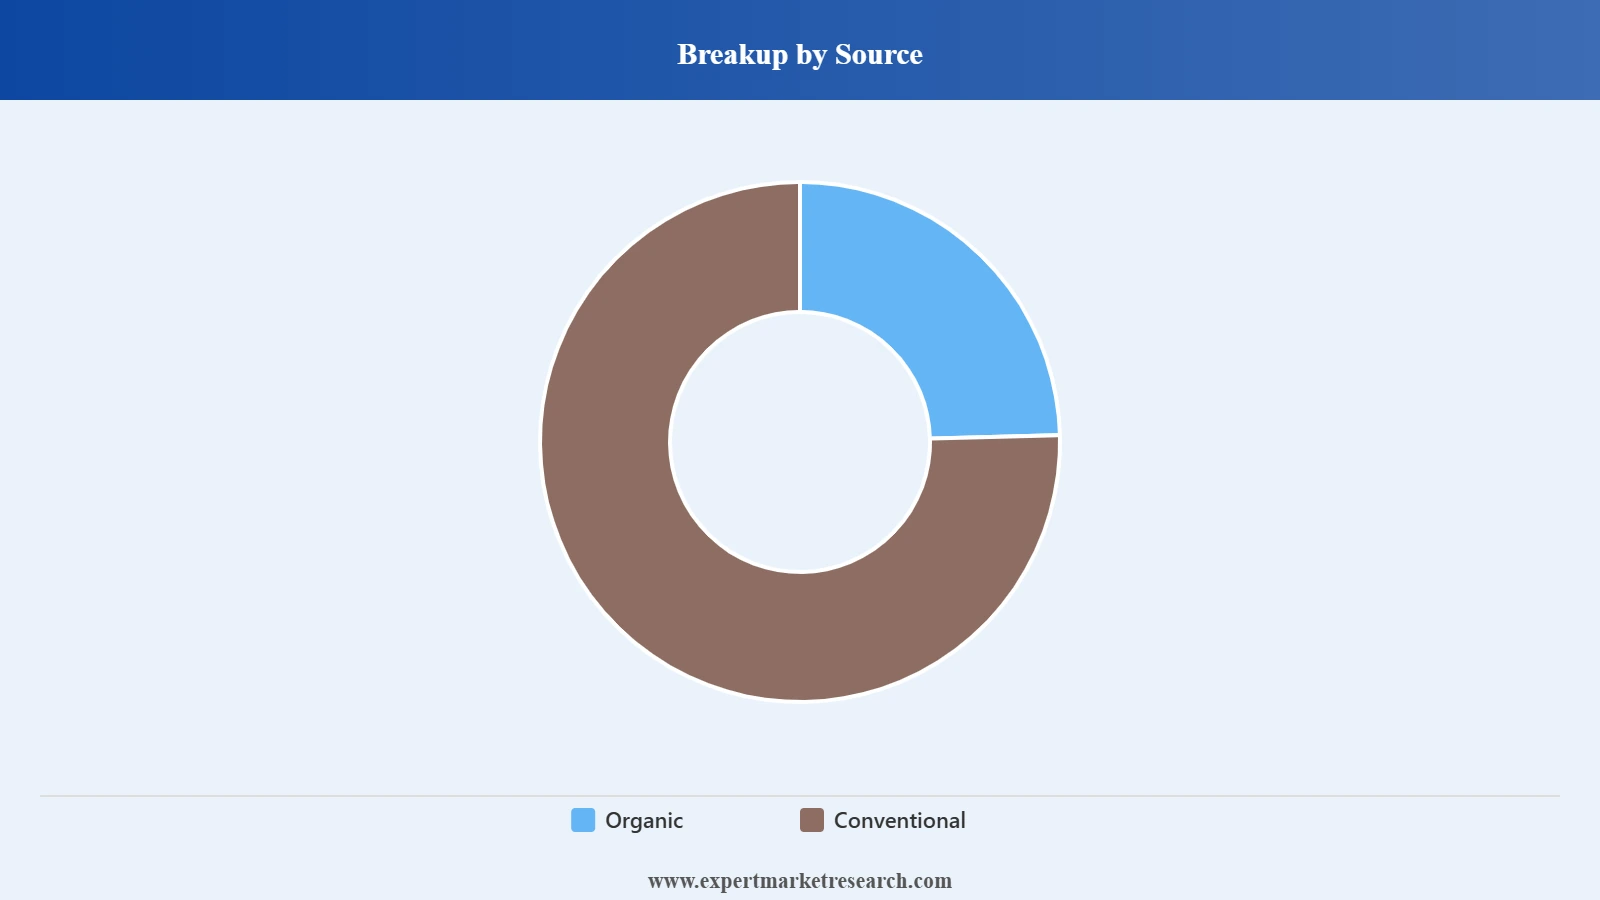
Market Breakup By Source
Market Breakup By Product Form
Market Breakup By Application
Market Breakup By Distribution Channel
Market Breakup By Region


Read more about this report - REQUEST FREE SAMPLE COPY IN PDF
Conventional cranberry extract is expected to dominate the cranberry extract market share due to its high nutritional content
Conventional sources of cranberries are less fluctuating in terms of pricing, and highly available due to the ease of excessive production. Conventional farming methods frequently concentrate on maximising crop yield and effectiveness, which can result in higher production levels than organic farming. With the rising investment activities within cranberry production, producers with conventional farming tend to grow more berries than Americans consume.
Read more about this report - REQUEST FREE SAMPLE COPY IN PDF
Organic cranberry extract involves cranberries, which are grown organically without the use of synthetic pesticides, herbicides, or genetically modified organisms (GMOs). The key factors like high demand due to its nutritional content, rising public awareness of healthy lifestyles, and consumer shift towards a vegan diet are the market drivers of organic cranberries. Fruits and vegetables that are grown using organic techniques typically contain 30% more antioxidants. The number of vitamins, minerals, and other nutrients is also higher in organic cranberries.
Market players are increasing their collaboration, partnership, and research and development activities to gain a competitive edge
Ocean Spray, headquartered in the United States and founded in 1930, is a prominent juice supplier. Its product line includes fresh fruits, sauces, and snacks with fruit flavours, juices and drinks made from various fruits like cranberries, blueberries, and grapefruit, and dried fruits like dried cranberries.
Nexira, headquartered in France and founded in 1985, offers emulsifiers and stabilisers, coating agents, texturisers, encapsulating agents, and a wide variety of branded natural acacia gum components.
Ethical Naturals, headquartered in the United States, was founded in 1895. It offers AlphaWave L-Theanine, GreenGrown Glucosamine, Cranberex Cranberry, PureLeaf Ginkgo biloba, ResveraTrue resveratrol, and other special ingredients.
Naturex, headquartered in France and founded in 1992, provides a wide range of premium ingredients for food, medicine, nutraceuticals, and cosmetic uses that are ethically obtained from nature.
*Please note that this is only a partial list; the complete list of key players is available in the full report. Additionally, the list of key players can be customized to better suit your needs.*
Other key players in the cranberry extract market include Artemis International, Diana Food, Decas Cranberry Products, Inc., and Northland Cranberries, Inc.
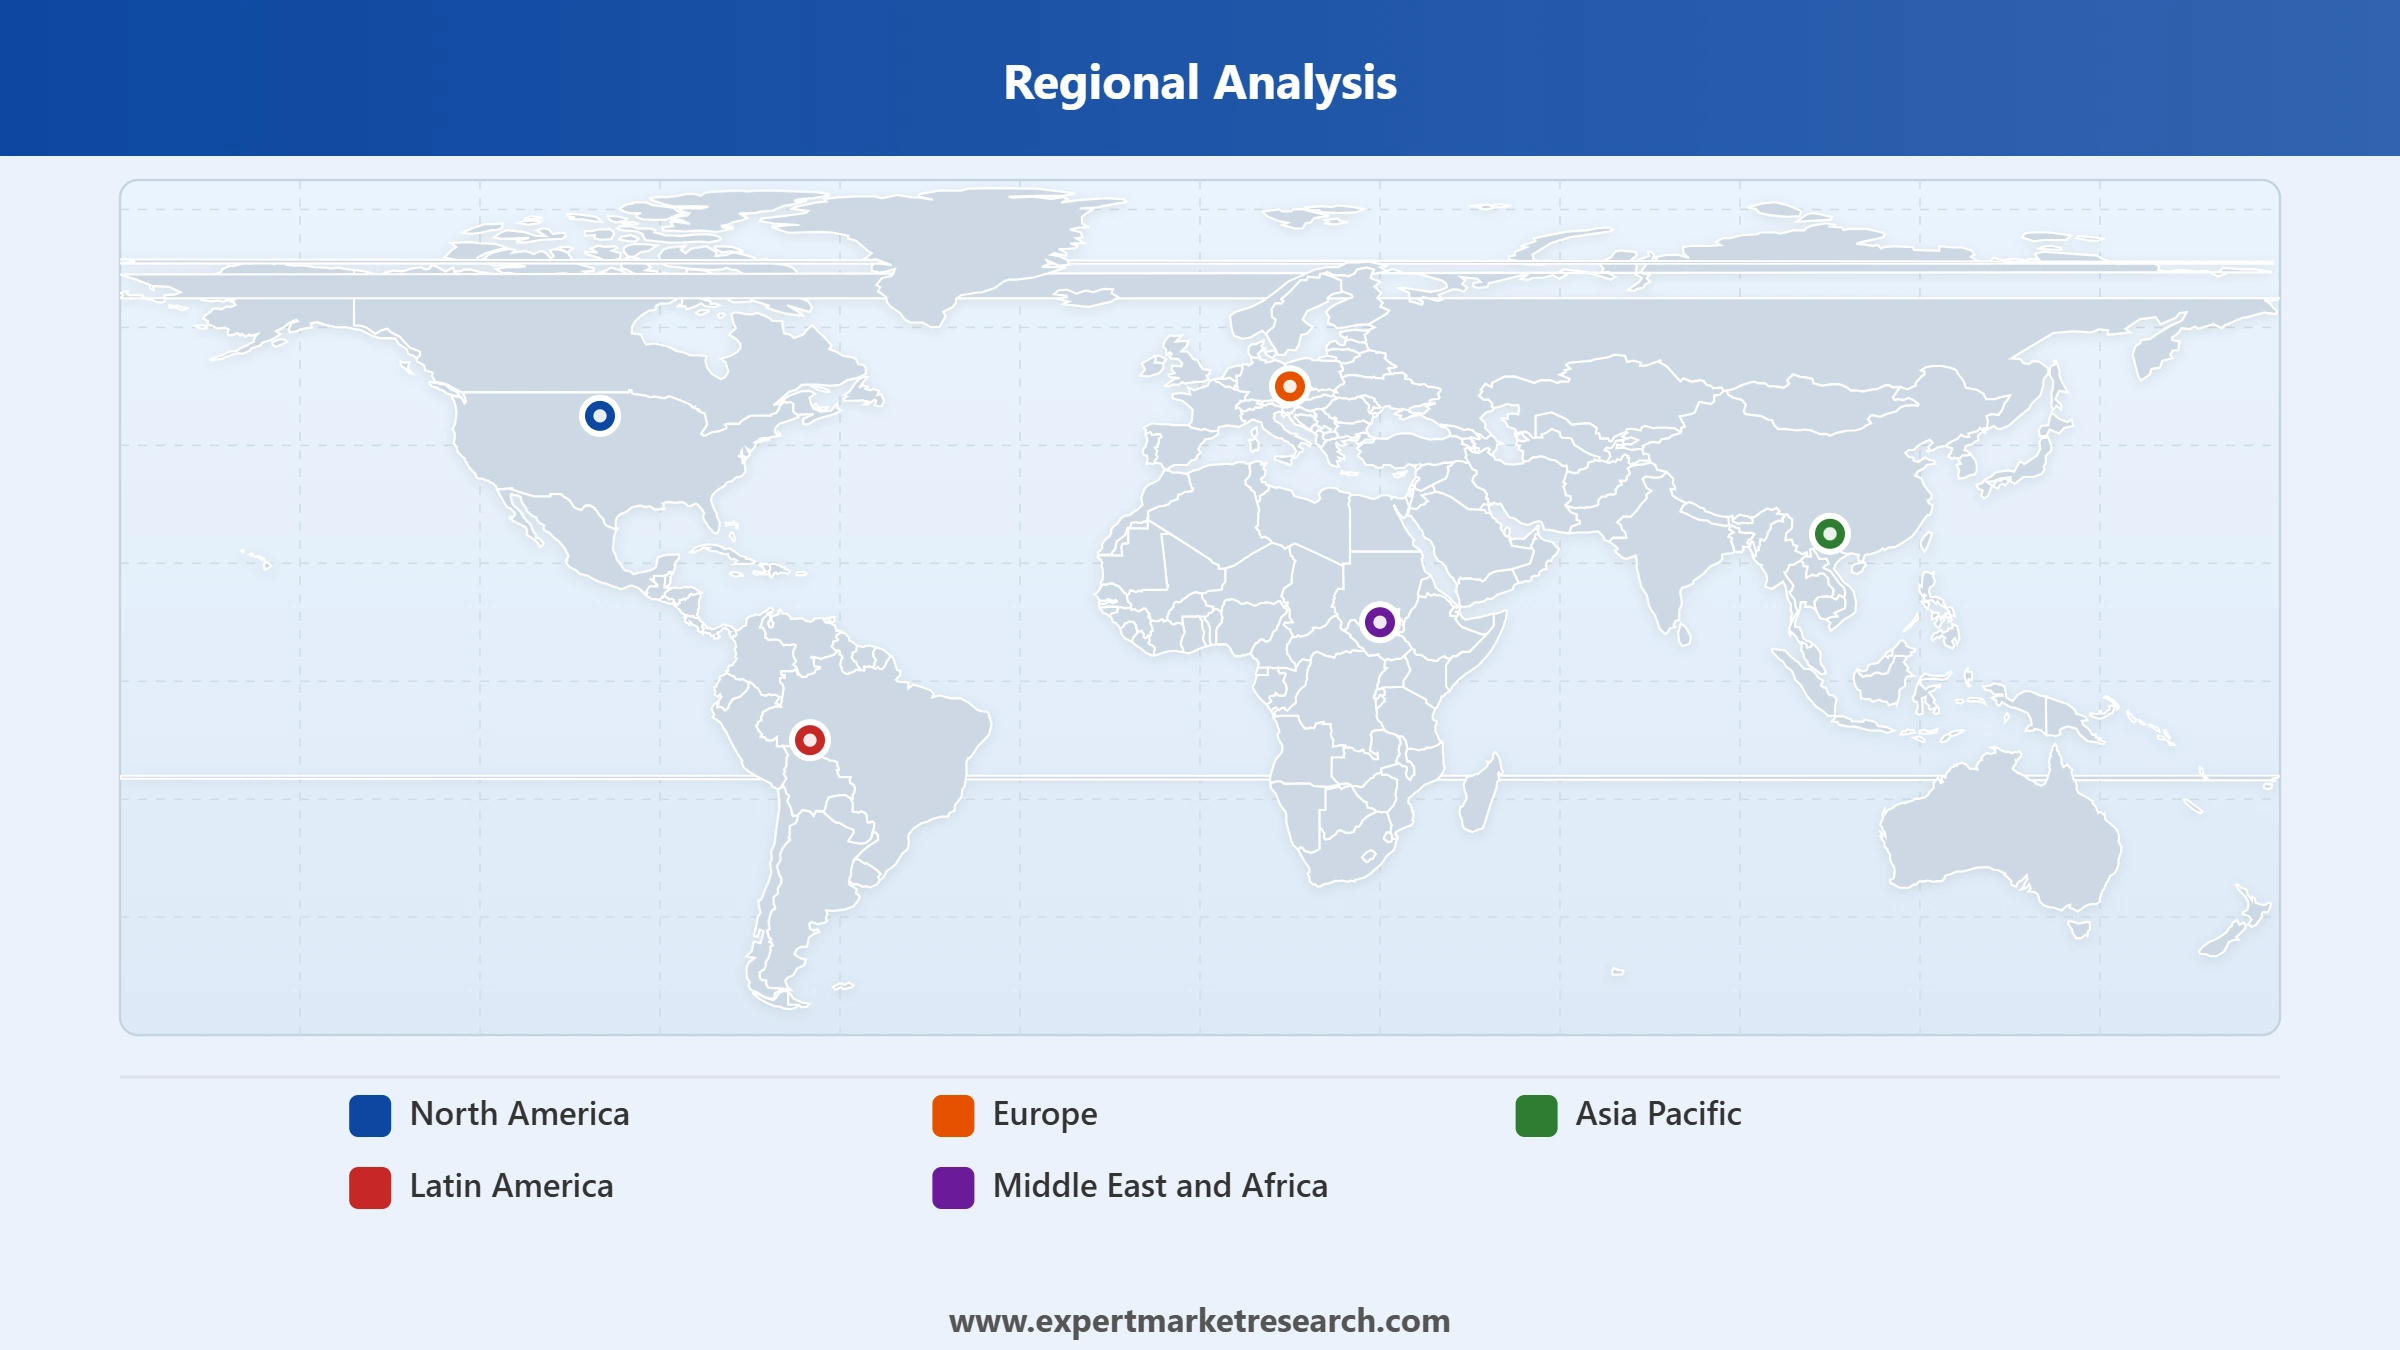
North America is anticipated to hold a dominant position in the market as the United States is one of the major suppliers of cranberry extract for the food and beverage industry. Cranberries are consumed by Americans in nearly 400 million pounds annually, with Thanksgiving week accounting for 20% of total consumption. In 2021, American farmers harvested cranberries on 16,000 hectares, producing 0.3 million metric tonnes.
Read more about this report - REQUEST FREE SAMPLE COPY IN PDF
The Europe cranberry extract market is driven by the significant production of cranberries in countries such as Lithuania, Bulgaria, Poland, and the Netherlands. Naturex, a part of Givaudan and headquartered in France, along with Canada-based Fruit d'Or, stands as one of the prominent suppliers of cranberry extracts within the European market. In response to the increasing demand, these companies are introducing organic cranberry extracts to strategically address this growing market segment.
The Asia Pacific also holds a prominent cranberry extract market share, driven by rising consumer health consciousness. In the region, the penetration rates of cranberry products in bakeries and convenience stores have risen rapidly, climbing to 50% and 29%, respectively. China, India, and South Korea are among the major producers. With the growing popularity of healthier snacks, drinks, and dietary supplement options that contain cranberries, food manufacturers such as Del Monte Foods and Dabur Ltd. are capitalising on this trend.
Upto 15% Off
USD
$2499 $2249
$3999 $3599
$4999 $4249
$5999 $5099


*While we strive to always give you current and accurate information, the numbers depicted on the website are indicative and may differ from the actual numbers in the main report. At Expert Market Research, we aim to bring you the latest insights and trends in the market. Using our analyses and forecasts, stakeholders can understand the market dynamics, navigate challenges, and capitalize on opportunities to make data-driven strategic decisions.*
In 2025, the market value was approximately USD 770.70 Million.
The market is projected to grow at a CAGR of 5.70% between 2026 and 2035.
The market is estimated to witness a healthy growth in the forecast period of 2026-2035 to reach around USD 1341.64 Million by 2035.
The major drivers include the increasing application of cranberry extract in the food and beverage sector and the pharmaceutical sector for the development of urinary tract infection supplements.
The key trends aiding the market include growing consumer demand for natural food colours and clean-label products as well as rising applications of cranberry extract in the cosmetics industry.
The different sources of cranberry extract include organic and conventional.
Major distribution channels of cranberry extract include direct and indirect.
The major players in the market include Ocean Spray, Nexira, Ethical Naturals, Inc., Naturex, Artemis International, Diana Food, Decas Cranberry Products, Inc., and Northland Cranberries, Inc.
Explore our key highlights of the report and gain a concise overview of key findings, trends, and actionable insights that will empower your strategic decisions.
| REPORT FEATURES | DETAILS |
| Base Year | 2025 |
| Historical Period | 2019-2025 |
| Forecast Period | 2026-2035 |
| Scope of the Report |
Historical and Forecast Trends, Industry Drivers and Constraints, Historical and Forecast Market Analysis by Segment:
|
| Breakup by Source |
|
| Breakup by Product Form |
|
| Breakup by Application |
|
| Breakup by Distribution Channel |
|
| Breakup by Region |
|
| Market Dynamics |
|
| Competitive Landscape |
|
| Companies Covered |
|
| Report Price and Purchase Option | Explore our purchase options that are best suited to your resources and industry needs. |
| Delivery Format | Delivered as an attached PDF and Excel through email, with an option of receiving an editable PPT, according to the purchase option. |
Datasheet
One User
USD 2,499
USD 2,249
tax inclusive*
Single User License
One User
USD 3,999
USD 3,599
tax inclusive*
Five User License
Five User
USD 4,999
USD 4,249
tax inclusive*
Corporate License
Unlimited Users
USD 5,999
USD 5,099
tax inclusive*
*Please note that the prices mentioned below are starting prices for each bundle type. Kindly contact our team for further details.*
Flash Bundle
Small Business Bundle
Growth Bundle
Enterprise Bundle
*Please note that the prices mentioned below are starting prices for each bundle type. Kindly contact our team for further details.*
Flash Bundle
Number of Reports: 3
20%
tax inclusive*
Small Business Bundle
Number of Reports: 5
25%
tax inclusive*
Growth Bundle
Number of Reports: 8
30%
tax inclusive*
Enterprise Bundle
Number of Reports: 10
35%
tax inclusive*
How To Order

Select License Type
Choose the right license for your needs and access rights.

Click on ‘Buy Now’
Add the report to your cart with one click and proceed to register.

Select Mode of Payment
Choose a payment option for a secure checkout. You will be redirected accordingly.
Strategic Solutions for Informed Decision-Making
Gain insights to stay ahead and seize opportunities.

Get insights & trends for a competitive edge.

Track prices with detailed trend reports.

Analyse trade data for supply chain insights.

Leverage cost reports for smart savings

Enhance supply chain with partnerships.

Connect For More Information
Our expert team of analysts will offer full support and resolve any queries regarding the report, before and after the purchase.
Our expert team of analysts will offer full support and resolve any queries regarding the report, before and after the purchase.
We employ meticulous research methods, blending advanced analytics and expert insights to deliver accurate, actionable industry intelligence, staying ahead of competitors.
Our skilled analysts offer unparalleled competitive advantage with detailed insights on current and emerging markets, ensuring your strategic edge.
We offer an in-depth yet simplified presentation of industry insights and analysis to meet your specific requirements effectively.


