

Consumer Insights
Uncover trends and behaviors shaping consumer choices today
Procurement Insights
Optimize your sourcing strategy with key market data
Industry Stats
Stay ahead with the latest trends and market analysis.
The global DC drives market attained a value of USD 5.88 Billion in 2025. The market is expected to grow at a CAGR of about 5.00% in the forecast period of 2026-2035 to reach a value of USD 9.58 Billion by 2035.
Compound Annual Growth Rate
5%
Value in USD Billion
2026-2035
Read more about this report - REQUEST FREE SAMPLE COPY IN PDF
| Global DC Drives Market Report Summary | Description | Value |
| Base Year | USD Billion | 2025 |
| Historical Period | USD Billion | 2019-2025 |
| Forecast Period | USD Billion | 2026-2035 |
| Market Size 2025 | USD Billion | 5.88 |
| Market Size 2035 | USD Billion | 9.58 |
| CAGR 2019-2025 | Percentage | XX% |
| CAGR 2026-2035 | Percentage | 5.00% |
| CAGR 2026-2035 - Market by Region | Latin America | 4.8% |
| CAGR 2026-2035 - Market by Country | India | 5.8% |
| CAGR 2026-2035 - Market by Country | Saudi Arabia | 5.2% |
| CAGR 2026-2035 - Market by Power Rating | Low Power Drives | 5.3% |
| CAGR 2026-2035 - Market by End Use | Water and Wastewater | 5.6% |
| Market Share by Country 2025 | Italy | 3.1% |
DC Drives Market to be Driven by Operational Benefits over AC Drives
The technology of DC drive has many advantages over its substitute AC drives. The DC drive technology is relatively more efficient in operation and has better cost effectiveness than AC drives. They are also easy to operate and implement. These advantages propel the DC drives demand. The increasing investment in industrialisation in the developing economies is also providing impetus to growth of DC drives industry. With the expansion of manufacturing sector, the demand for DC drives will be further augmented. The end use industries are going to drive the DC drives market. The rapidly expanding chemical processing industry as well as food and beverage sector will lead to a spurt in demand for DC drives.
| 2025 Market Share by | Country |
| Italy | 3.1% |
| USA | XX% |
| Canada | XX% |
| UK | XX% |
The growing focus on eco-friendly solutions to reduce carbon footprint as well as improve operational efficiency is a crucial trend in the DC drives market. Moreover, several market players are offering DC drives which comply with the environmental regulations, amid rising environmental impact.
As per the DC drives market dynamics and trends, Toshiba announced in November 2023 that it is extending the range of its small intelligent power devices (IPD) for application in DC motor drives. These new products can reduce the PCB mounting area by 30 per cent in the motor drives.


Read more about this report - REQUEST FREE SAMPLE COPY IN PDF
The Growth in Oil and Gas Sector Aids the Adoption of DC Drives.
In the oil and gas sector, DC drives increase operational efficiency by powering the drilling process. According to the U.S. Energy Information Administration (EIA), in 2023, the global oil production landscape remained dominated by a few key markets, with the United States leading as the top producer at 21.91 million barrels per day, accounting for 22% of the world’s total production. As per the DC drives industry analysis, Saudi Arabia and Russia followed, each contributing 11.13 and 10.75 million barrels per day, respectively. These three countries alone produced nearly half of the world’s oil, underscoring their significant influence on global oil market.
Canada, China, and Iraq also made substantial contributions, producing 5.76, 5.26, and 4.42 million barrels per day, respectively. Brazil and the United Arab Emirates, with 4.28 and 4.16 million barrels per day, respectively, further added to the diversity of the top producers, each holding a 4% share, which boosts the DC drives industry revenue. Iran and Kuwait, with outputs of 3.99 and 2.91 million barrels per day respectively, rounded out the top ten producers. Together, the top ten oil-producing countries accounted for 74.59 million barrels per day, which constituted 73% of the world’s total production of 101.81 million barrels per day.
In 2022, the global natural gas production landscape was dominated by a few key countries, with the United States leading by a significant margin. The United States produced 1.03 trillion cubic meters of natural gas, making it the largest producer globally. Russia was the second-largest producer, with an output of 699 billion cubic meters, which contributed to the growth of the DC drives industry. Iran followed with 244 billion cubic meters, leveraging its extensive reserves and ongoing development of its natural gas sector. China and Canada also featured prominently among the top producers, with outputs of 219 billion cubic meters and 205 billion cubic meters, respectively.
Read more about this report - REQUEST FREE SAMPLE COPY IN PDF
DC drive refers to a speed control system driven by DC motor which operates at a required speed by supplying voltage to the motor. These equipment help in reducing the power consumption in motors by moderating the motor speed at variable loads. They can be used in industrial drive applications and have distinct advantages in the regenerative and high-power applications.
Breakup by Voltage
Breakup by Power Rating
Breakup by End User
Breakup by Region
| CAGR 2026-2035 - Market by | Power Rating |
| Low Power Drives | 5.3% |
| High Power Drives | 4.8% |
| Medium Power Drives | XX% |
| CAGR 2026-2035 - Market by | End Use |
| Water and Wastewater | 5.6% |
| Power Generation | 5.2% |
| Building Automation | 4.5% |
| Oil and Gas | XX% |
| Food and Beverage | XX% |
| Others | XX% |
| CAGR 2026-2035 - Market by | Region |
| Latin America | 4.8% |
| Europe | 3.8% |
| North America | XX% |
| Asia Pacific | XX% |
| Middle East and Africa | XX% |
The report gives a detailed analysis of the following key players in the DC drives industry, covering their competitive landscape, capacity, and latest developments like mergers, acquisitions, and investments, expansions of capacity, and plant turnarounds:
The comprehensive EMR report provides an in-depth assessment of the market based on the Porter's five forces model along with giving a SWOT analysis.
Asia Pacific Region Emerging as One of the Leading Markets Driven by Rapid Industrialisation
The Asia Pacific region is one of the leading markets for DC drives and is expected to have rapid growth. This is because of the rapid industrialisation in developing nations like China and India. The demand in Asian Pacific regions is aided by the growing population and increasing economic development. The DC drives market share in North America and Europe will also witness steady growth with the increasing deployment of DC drives in food and beverage sector. Middle East and Africa regional markets will also grow moderately in the future with an increase in demand from end-use industries.
| CAGR 2026-2035 - Market by | Country |
| India | 5.8% |
| Saudi Arabia | 5.2% |
| Brazil | 5.1% |
| Mexico | 4.9% |
| Canada | 4.7% |
| USA | XX% |
| UK | 4.1% |
| Germany | XX% |
| France | XX% |
| Italy | XX% |
| China | XX% |
| Japan | XX% |
| Australia | XX% |
Upto 15% Off
USD
$2499 $2249
$3999 $3599
$4999 $4249
$5999 $5099


*While we strive to always give you current and accurate information, the numbers depicted on the website are indicative and may differ from the actual numbers in the main report. At Expert Market Research, we aim to bring you the latest insights and trends in the market. Using our analyses and forecasts, stakeholders can understand the market dynamics, navigate challenges, and capitalize on opportunities to make data-driven strategic decisions.*
The global DC drives market is projected to grow at a CAGR of 5.00% between 2026 and 2035.
The major drivers of the market include the expansion of the manufacturing sector, rapidly expanding chemical processing market and food and beverage sector, increasing economic development, and rise in demand from end-use industries.
The advantages like efficiency in operation and cost-effectiveness and the increasing investment in industrialisation are the key trends propelling the market's growth.
The major regions in the market are North America, Latin America, the Middle East and Africa, Europe, and the Asia Pacific.
The different voltages in the market are low voltage and medium voltage.
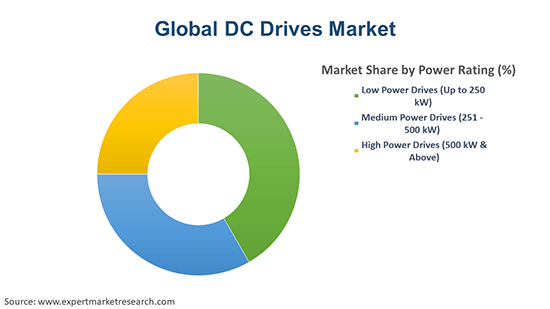
The significant power ratings are low power drives (up to 250 kW), medium power drives (251 - 500 kW), and high power drives (500 kW & above).
The end uses are oil and gas, water and wastewater, power generation, building automation, food and beverage, metals and mining, and chemicals and petrochemicals, among others.
The key players in the global DC drives market are ABB Ltd., Siemens AG, Rockwell Automation Inc., Nidec Motor Corporation, Parker Hannifin Corp, and General Electric, among others.
The market attained a value of USD 5.88 Billion in 2025.
The market is estimated to witness a healthy growth in the forecast period of 2026-2035 to reach USD 9.58 Billion by 2035.
Explore our key highlights of the report and gain a concise overview of key findings, trends, and actionable insights that will empower your strategic decisions.
| REPORT FEATURES | DETAILS |
| Base Year | 2025 |
| Historical Period | 2019-2025 |
| Forecast Period | 2026-2035 |
| Scope of the Report |
Historical and Forecast Trends, Industry Drivers and Constraints, Historical and Forecast Market Analysis by Segment:
|
| Breakup by Voltage |
|
| Breakup by Power Rating |
|
| Breakup by End Use |
|
| Breakup by Region |
|
| Market Dynamics |
|
| Competitive Landscape |
|
| Companies Covered |
|
| Report Price and Purchase Option | Explore our purchase options that are best suited to your resources and industry needs. |
| Delivery Format | Delivered as an attached PDF and Excel through email, with an option of receiving an editable PPT, according to the purchase option. |
Datasheet
One User
USD 2,499
USD 2,249
tax inclusive*
Single User License
One User
USD 3,999
USD 3,599
tax inclusive*
Five User License
Five User
USD 4,999
USD 4,249
tax inclusive*
Corporate License
Unlimited Users
USD 5,999
USD 5,099
tax inclusive*
*Please note that the prices mentioned below are starting prices for each bundle type. Kindly contact our team for further details.*
Flash Bundle
Small Business Bundle
Growth Bundle
Enterprise Bundle
*Please note that the prices mentioned below are starting prices for each bundle type. Kindly contact our team for further details.*
Flash Bundle
Number of Reports: 3
20%
tax inclusive*
Small Business Bundle
Number of Reports: 5
25%
tax inclusive*
Growth Bundle
Number of Reports: 8
30%
tax inclusive*
Enterprise Bundle
Number of Reports: 10
35%
tax inclusive*
How To Order

Select License Type
Choose the right license for your needs and access rights.

Click on ‘Buy Now’
Add the report to your cart with one click and proceed to register.

Select Mode of Payment
Choose a payment option for a secure checkout. You will be redirected accordingly.
Strategic Solutions for Informed Decision-Making
Gain insights to stay ahead and seize opportunities.

Get insights & trends for a competitive edge.

Track prices with detailed trend reports.

Analyse trade data for supply chain insights.

Leverage cost reports for smart savings

Enhance supply chain with partnerships.

Connect For More Information
Our expert team of analysts will offer full support and resolve any queries regarding the report, before and after the purchase.
Our expert team of analysts will offer full support and resolve any queries regarding the report, before and after the purchase.
We employ meticulous research methods, blending advanced analytics and expert insights to deliver accurate, actionable industry intelligence, staying ahead of competitors.
Our skilled analysts offer unparalleled competitive advantage with detailed insights on current and emerging markets, ensuring your strategic edge.
We offer an in-depth yet simplified presentation of industry insights and analysis to meet your specific requirements effectively.


