

Consumer Insights
Uncover trends and behaviors shaping consumer choices today
Procurement Insights
Optimize your sourcing strategy with key market data
Industry Stats
Stay ahead with the latest trends and market analysis.
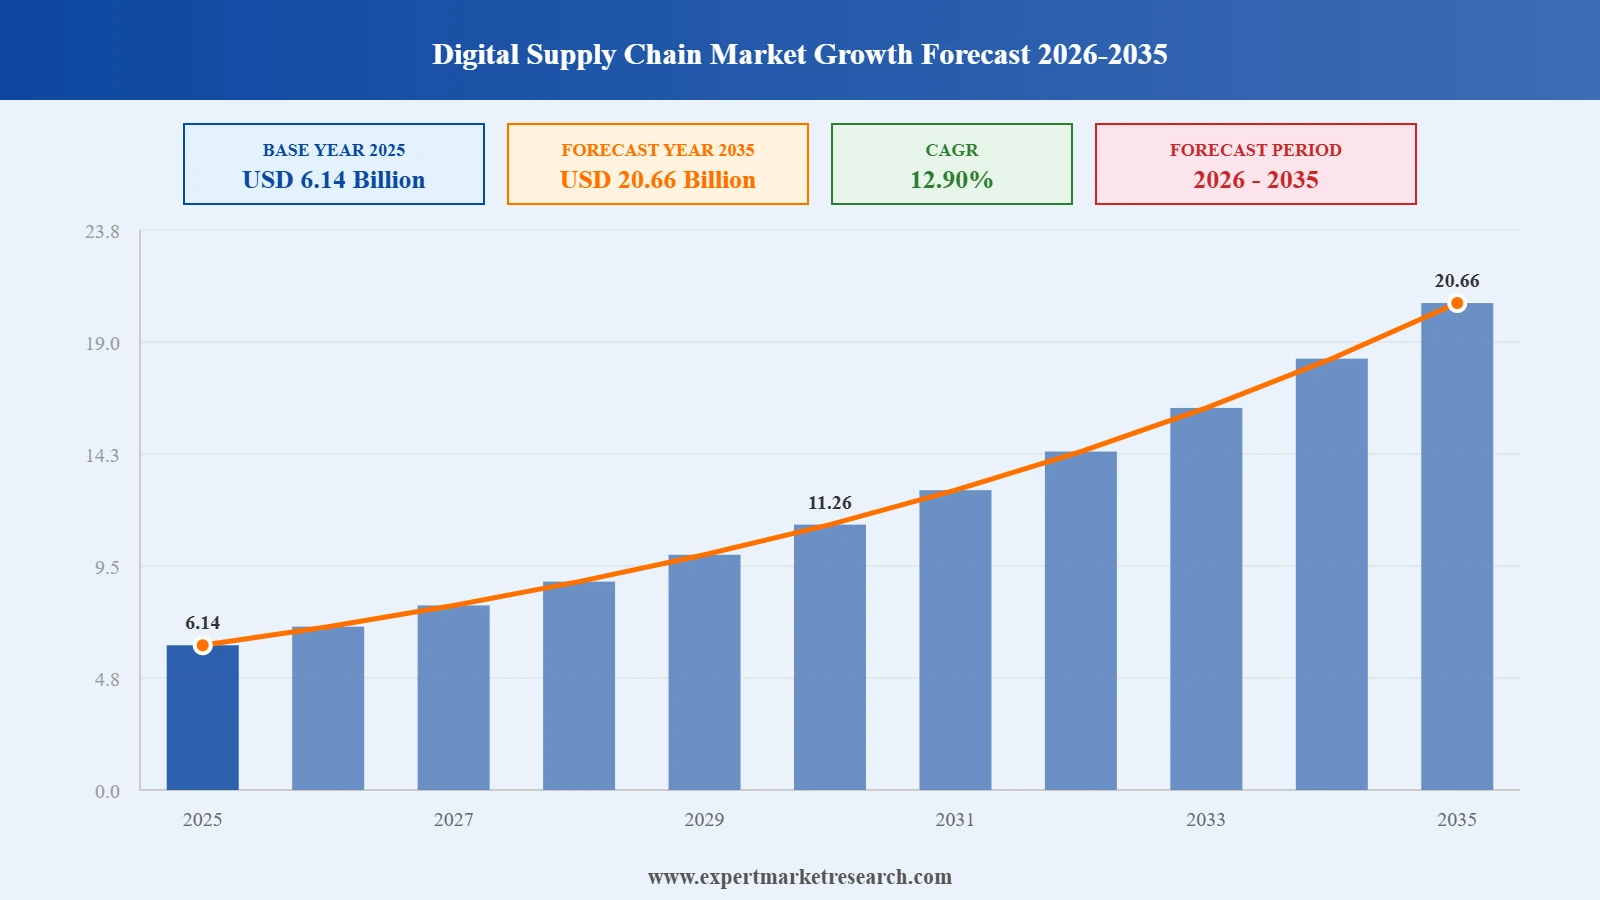
The global digital supply chain market size reached approximately USD 6.14 Billion in 2025. The market is projected to grow at a CAGR of 12.90% between 2026 and 2035, reaching a value of around USD 20.66 Billion by 2035.
Read more about this report - REQUEST FREE SAMPLE COPY IN PDF
A digital supply chain refers to supply chain employing digital technologies to enhance operational efficiency and adapt to evolving circumstances by leveraging data analytics. This is achieved through the utilisation of cutting-edge technologies, which aid in the comprehensive digitisation of the complete supply chain, encompassing processes from manufacturing and transportation to distribution and administration.


Read more about this report - REQUEST FREE SAMPLE COPY IN PDF
The EMR’s report titled “Global Digital Supply Chain Market Report and Forecast 2026-2035” offers a detailed analysis of the market based on the following segments:
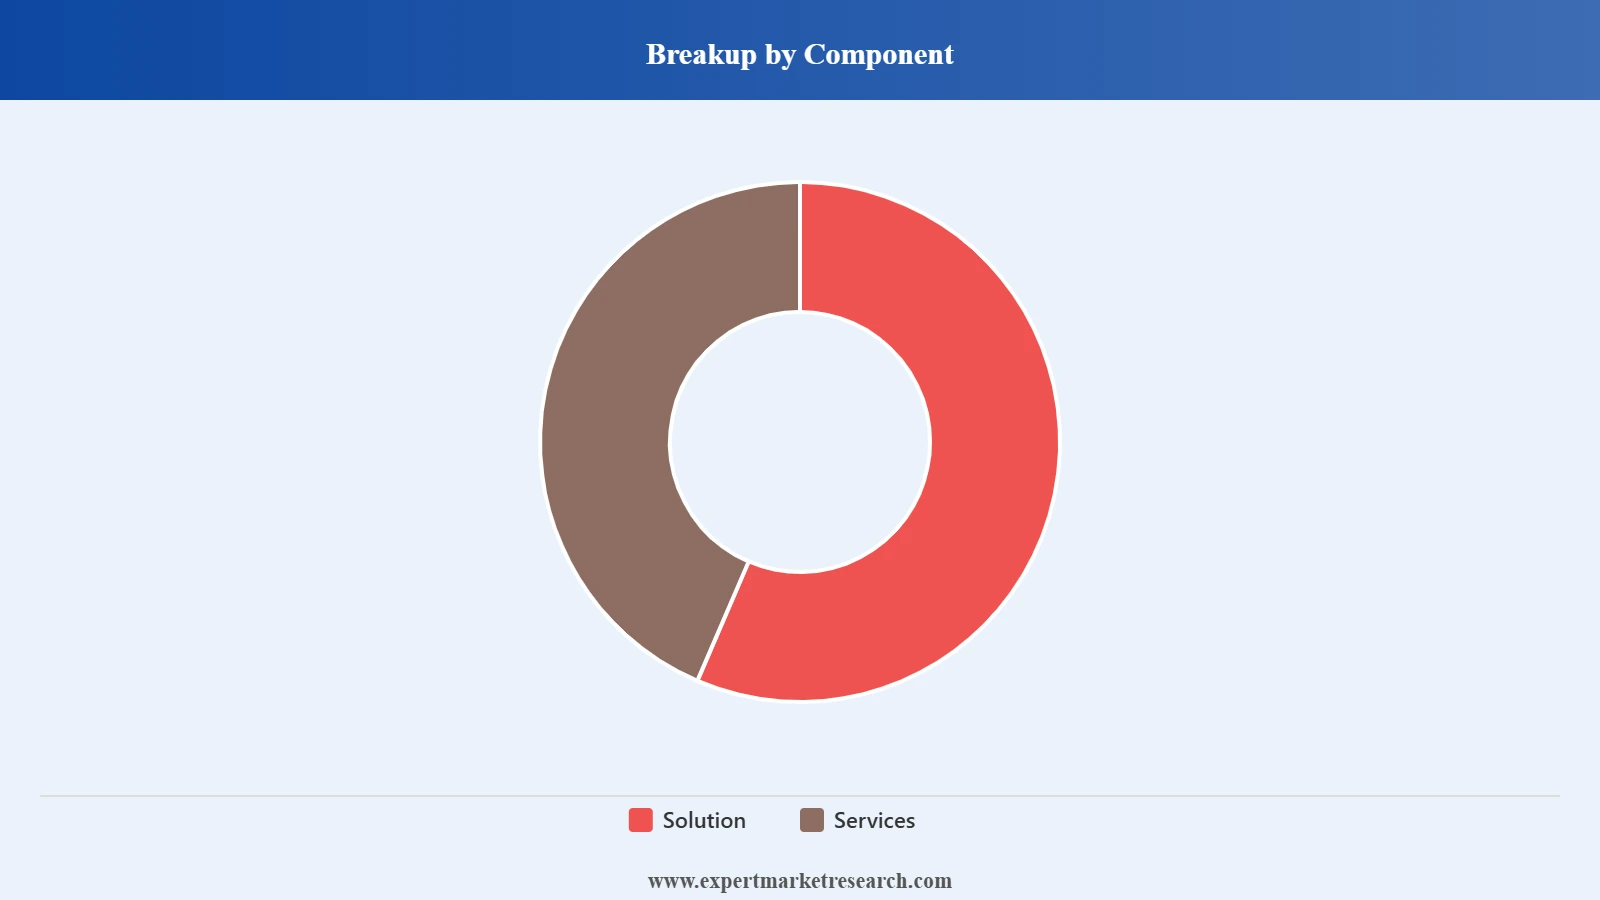
Market Breakup by Component
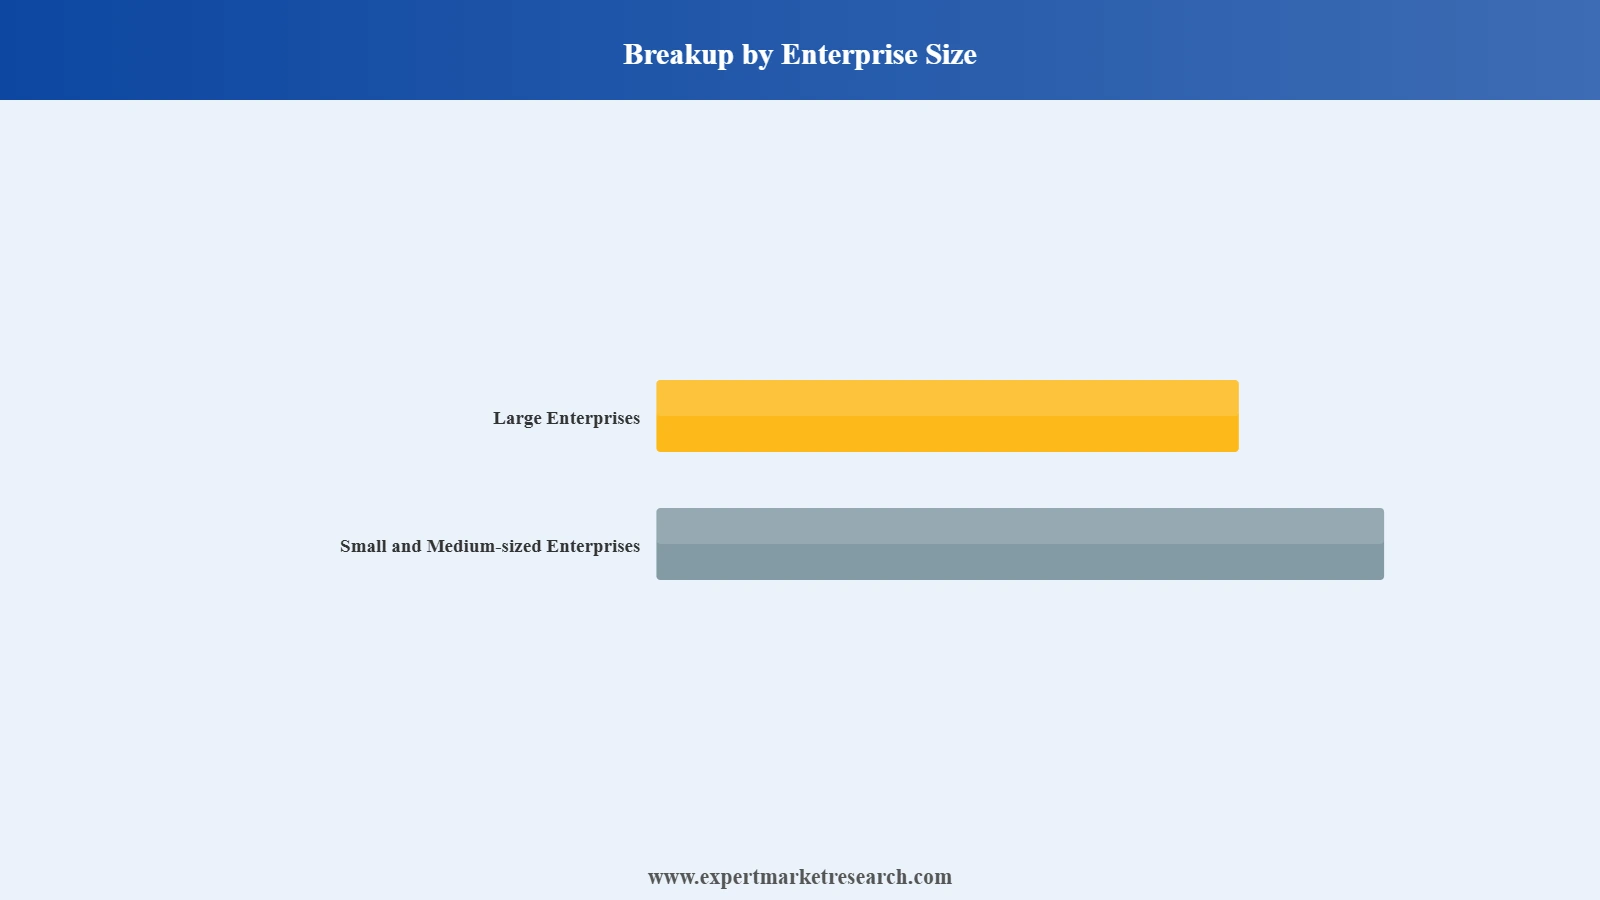
Market Breakup by Enterprise Size
Market Breakup by End Use
Market Breakup by Region
Read more about this report - REQUEST FREE SAMPLE COPY IN PDF
According to the digital supply chain market analysis, services are likely to increase in demand during the forecast period as they play a crucial role in helping businesses enhance efficiency, visibility, and agility in their supply chain operations. Modern supply chains have become highly complex, often spanning multiple regions, and involving numerous stakeholders. Moreover, the surge in e-commerce has led to higher customer expectations for fast, accurate, and transparent deliveries. Digital supply chain services play a critical role in meeting these demands.
Read more about this report - REQUEST FREE SAMPLE COPY IN PDF
The increasing digitisation of large enterprises for operational benefits and competitive edge is expected to significantly influence the global digital supply chain market share in the coming years. Digital tools automate manual processes, reduce paperwork, and streamline operations. This leads to increased efficiency and productivity across the entire supply chain. Digital tools can also enable businesses to respond quickly to changes in customer demand, market trends, and unforeseen disruptions, allowing for more agile and customer-centric operations.
Read more about this report - REQUEST FREE SAMPLE COPY IN PDF
The comprehensive EMR report provides an in-depth assessment of the market based on Porter's five forces model along with giving a SWOT analysis. The report gives a detailed analysis of the following key players in the global digital supply chain market, covering their competitive landscape and the latest developments like mergers, acquisitions, investments, and expansion plans.
IBM Corporation also known as IBM, stands as a distinguished American multinational technology and consulting entity. Since its inception in 1911, IBM has been instrumental in shaping the landscape of the information technology sector. The company is centrally located in Armonk, New York. IBM boasts a multifaceted repertoire comprising an extensive array of services, software, and hardware offerings, spanning areas such as cloud computing, artificial intelligence, blockchain technology, data analytics, and quantum computing.
Oracle Corporation often referred to simply as Oracle, stands as a prominent American multinational in the field of computer technology. Founded in 1977, Oracle has risen to prominence as a key player in the worldwide software and cloud computing sectors. The company's main offices are based in Redwood City, California. Famed for its leading product, the Oracle Database, the company holds a substantial presence in the realm of database management systems.
Microsoft Corporation often referred to as Microsoft, stands as a worldwide technology giant with its headquarters situated in Redmond, Washington. Founded in 1975 by Bill Gates and Paul Allen, the company has emerged as a leading authority in both software and hardware domains. Microsoft boasts a varied portfolio encompassing a plethora of products and services, including the widely used Windows operating system, the indispensable Office suite for productivity, and cloud-based solutions like Microsoft Azure.
*Please note that this is only a partial list; the complete list of key players is available in the full report. Additionally, the list of key players can be customized to better suit your needs.*
Other companies operating in the market include SAP SE, TIBCO Software Inc., Infor, Tableau Software, LLC, Blue Yonder Group, Inc., Körber AG, and American Software, Inc., among others.
Upto 15% Off
USD
$2499 $2249
$3999 $3599
$4999 $4249
$5999 $5099


*While we strive to always give you current and accurate information, the numbers depicted on the website are indicative and may differ from the actual numbers in the main report. At Expert Market Research, we aim to bring you the latest insights and trends in the market. Using our analyses and forecasts, stakeholders can understand the market dynamics, navigate challenges, and capitalize on opportunities to make data-driven strategic decisions.*
In 2025, the market reached an approximate value of USD 6.14 Billion.
The market is projected to grow at a CAGR of 12.90% between 2026 and 2035.
The market is estimated to witness a healthy growth in the forecast period of 2026-2035 to reach a value of around USD 20.66 Billion by 2035.
The market is driven by the rising demand for cloud-based supply chain management solutions and the increasing focus on providing tailored experiences to customers while streamlining business operations.
The increasing globalisation of different sectors along with the rapid development of e-commerce business is expected to propel the expansion of the market.
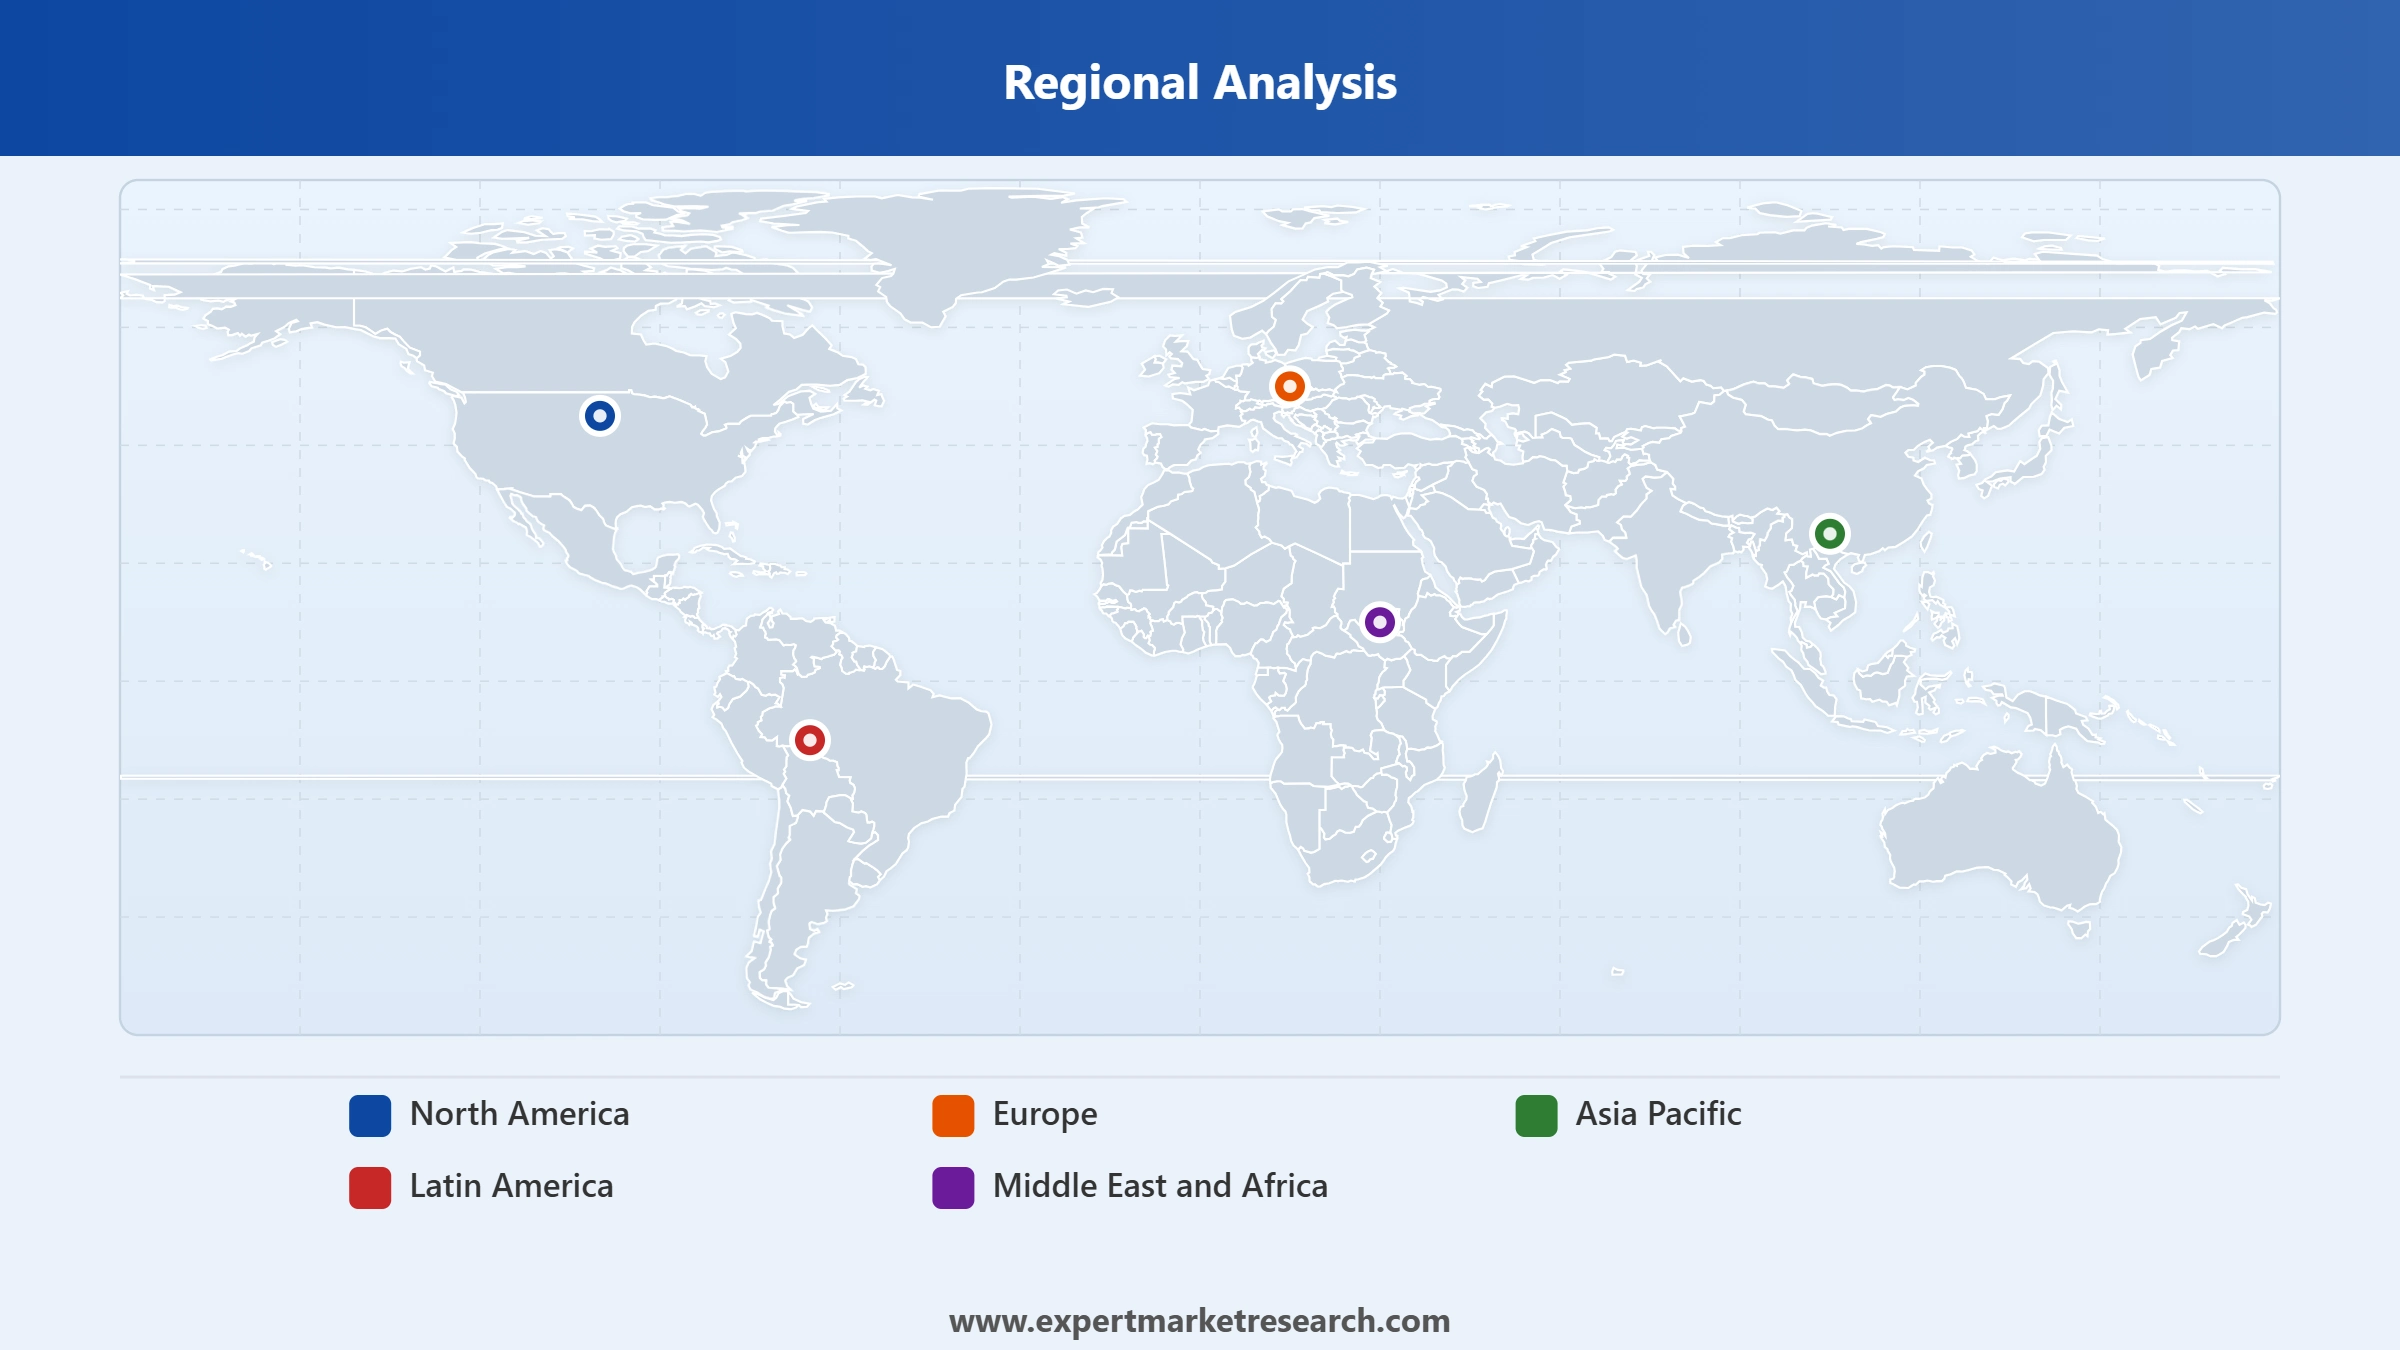
The major regional markets are North America, Europe, the Asia Pacific, Latin America, and the Middle East and Africa.
The major end use sectors are manufacturing, retail and consumer goods, automotive, food and beverages, healthcare and pharmaceuticals, and transportation and logistics, among others.
The key players in the market include IBM Corporation, Oracle Corporation, Microsoft Corporation, SAP SE, TIBCO Software Inc., Infor, Tableau Software, LLC, Blue Yonder Group, Inc., Körber AG, and American Software, Inc., among others.
Explore our key highlights of the report and gain a concise overview of key findings, trends, and actionable insights that will empower your strategic decisions.
| REPORT FEATURES | DETAILS |
| Base Year | 2025 |
| Historical Period | 2019-2025 |
| Forecast Period | 2026-2035 |
| Scope of the Report |
Historical and Forecast Trends, Industry Drivers and Constraints, Historical and Forecast Market Analysis by Segment:
|
| Breakup by Component |
|
| Breakup by Enterprise Size |
|
| Breakup by End Use |
|
| Breakup by Region |
|
| Market Dynamics |
|
| Competitive Landscape |
|
| Companies Covered |
|
Datasheet
One User
USD 2,499
USD 2,249
tax inclusive*
Single User License
One User
USD 3,999
USD 3,599
tax inclusive*
Five User License
Five User
USD 4,999
USD 4,249
tax inclusive*
Corporate License
Unlimited Users
USD 5,999
USD 5,099
tax inclusive*
*Please note that the prices mentioned below are starting prices for each bundle type. Kindly contact our team for further details.*
Flash Bundle
Small Business Bundle
Growth Bundle
Enterprise Bundle
*Please note that the prices mentioned below are starting prices for each bundle type. Kindly contact our team for further details.*
Flash Bundle
Number of Reports: 3
20%
tax inclusive*
Small Business Bundle
Number of Reports: 5
25%
tax inclusive*
Growth Bundle
Number of Reports: 8
30%
tax inclusive*
Enterprise Bundle
Number of Reports: 10
35%
tax inclusive*
How To Order

Select License Type
Choose the right license for your needs and access rights.

Click on ‘Buy Now’
Add the report to your cart with one click and proceed to register.

Select Mode of Payment
Choose a payment option for a secure checkout. You will be redirected accordingly.
Strategic Solutions for Informed Decision-Making
Gain insights to stay ahead and seize opportunities.

Get insights & trends for a competitive edge.

Track prices with detailed trend reports.

Analyse trade data for supply chain insights.

Leverage cost reports for smart savings

Enhance supply chain with partnerships.

Connect For More Information
Our expert team of analysts will offer full support and resolve any queries regarding the report, before and after the purchase.
Our expert team of analysts will offer full support and resolve any queries regarding the report, before and after the purchase.
We employ meticulous research methods, blending advanced analytics and expert insights to deliver accurate, actionable industry intelligence, staying ahead of competitors.
Our skilled analysts offer unparalleled competitive advantage with detailed insights on current and emerging markets, ensuring your strategic edge.
We offer an in-depth yet simplified presentation of industry insights and analysis to meet your specific requirements effectively.


