

Consumer Insights
Uncover trends and behaviors shaping consumer choices today
Procurement Insights
Optimize your sourcing strategy with key market data
Industry Stats
Stay ahead with the latest trends and market analysis.
The global diuretic drugs therapy market is being aided by the growing antihypertensive drugs market, which reached a value of about USD 30.49 Billion in 2025. The antihypertensive drugs industry is further expected to grow at a CAGR of 2.30% in the forecast period of 2026-2035 to reach a value of approximately USD 38.27 Billion by 2035.
Compound Annual Growth Rate
2.3%
Value in USD Billion
2026-2035
Read more about this report - REQUEST FREE SAMPLE COPY IN PDF
North America accounts for a significant share in the industry owing to the availability of advanced diagnostic facilities, increased health care expenditure, and the growing cases of diuretic anomalies and lifestyle related disorders. Meanwhile, the Asia Pacific is expected to witness a robust growth over the forecast period owing to the increasing government initiatives towards patent exclusivity and the growing investments in new drug applications. Further, the factors like the presence of a large population and the growth of the generic drugs market are also aiding the regional industry. Other regions like Europe and the Middle East and Africa are expected to create significant growth opportunities for the market expansion over the forecast period. This can be attributed to the increasing geriatric population in these regions.
Read more about this report - REQUEST FREE SAMPLE COPY IN PDF
Diuretic drugs therapy refers to a medical treatment for patients suffering from health conditions like high blood pressure, water retention problems, and heart failure (HF). Diuretics, also known as water pills, are a class of drugs that increase the production and volume of urine by tilting the renal fluid regulation in favour of excretion of water and electrolytes (salt). These drugs are commonly prescribed to treat edema, wherein excess fluid accumulates in the tissues due to various disease states like heart failure, liver cirrhosis, and kidney disease. Diuretics are often used to treat hypertension and regulate blood pressure.
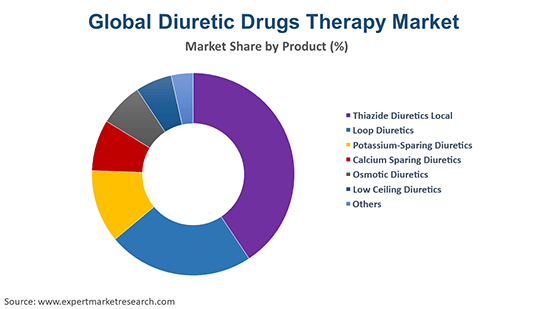
Based on product, the market is divided into:
By route of administration, the industry can be bifurcated into:
The different applications of diuretic drugs therapy include:
On the basis of distribution channel, the industry can be categorised into:
The regional markets for the product include:


Read more about this report - REQUEST FREE SAMPLE COPY IN PDF
The increase in the number of people suffering from blood pressure and hypertension is the major factor contributing to the growth of the diuretic drugs therapy industry. Diuretics are used as the chief therapeutic agents to treat hypertension and are generally the first type of medication prescribed by doctors to control blood pressure. According to estimates, worldwide deaths due to high blood pressure are expected to increase from 7.5 million to 1.56 billion by 2026. The market is also being supported by the growing cases of kidney diseases, thus, creating an enhanced demand for drugs like diuretics. The increase in sedentary lifestyles and the changing dietary patterns are one of the major causes of these health conditions. Further, the growing geriatric population and the improving healthcare infrastructures are also contributing to the industry growth. Over the forecast period, the growing R&D activities and the advancements in the field of pharmaceuticals are expected to positively influence the growth of the industry.
The report gives a detailed analysis of the following key players in the global diuretic drugs therapy market, covering their competitive landscape, capacity, and latest developments like mergers, acquisitions, and investments, expansions of capacity, and plant turnarounds:
The comprehensive EMR report provides an in-depth assessment of the market based on the Porter's five forces model along with giving a SWOT analysis.
Upto 15% Off
USD
$3299 $2969
$5499 $4949
$6999 $5949
$8199 $6969


*While we strive to always give you current and accurate information, the numbers depicted on the website are indicative and may differ from the actual numbers in the main report. At Expert Market Research, we aim to bring you the latest insights and trends in the market. Using our analyses and forecasts, stakeholders can understand the market dynamics, navigate challenges, and capitalize on opportunities to make data-driven strategic decisions.*
The global diuretic drugs therapy market was supported by the thriving antihypertensive drugs industry, which attained a value of nearly USD 30.49 Billion in 2025.
The antihypertensive drugs industry, which is aiding the growth of the global diuretic drugs therapy market, is projected to grow at a CAGR of 2.30% between 2026 and 2035.
The antihypertensive drugs market is estimated to witness a healthy growth in the forecast period of 2026-2035 to reach about USD 38.27 Billion by 2035, thus, translating the growth of the global diuretic drugs therapy market.
The major drivers of the industry, such as the advancing pharmaceutical sector, increasing geriatric population, increasing sedentary lifestyles, and growing cases of high blood pressure and hypertension, are expected to aid the market growth.
The key market trends guiding the growth of the industry include the growing investments in R&D activities and the advancements in the pharmaceutical sectors.
The major regions in the industry are North America, Latin America, the Middle East and Africa, Europe, and the Asia Pacific.
Thiazide diuretics local, loop diuretics, potassium-sparing diuretics, calcium sparing diuretics, osmotic diuretics, and low ceiling diuretics, among others are the significant diuretic drugs therapy products in the industry.
The major routes of administration include oral and intravenous.
The major applications of the product are hypertension, glaucoma, heart failure, and kidney stones, among others.
The major distribution channels of the product include hospital pharmacies, retail pharmacies, and online, among others.
The key players in the industry are Sanofi SA, Mylan N.V., Pfizer Inc., Cipla Ltd., and others.
Explore our key highlights of the report and gain a concise overview of key findings, trends, and actionable insights that will empower your strategic decisions.
| REPORT FEATURES | DETAILS |
| Base Year | 2025 |
| Historical Period | 2019-2025 |
| Forecast Period | 2026-2035 |
| Scope of the Report |
Historical and Forecast Trends, Industry Drivers and Constraints, Historical and Forecast Market Analysis by Segment:
|
| Breakup by Product |
|
| Breakup by Route of Administration |
|
| Breakup by Application |
|
| Breakup by Distribution Channel |
|
| Breakup by Region |
|
| Market Dynamics |
|
| Competitive Landscape |
|
| Companies Covered |
|
| Report Price and Purchase Option | Explore our purchase options that are best suited to your resources and industry needs. |
| Delivery Format | Delivered as an attached PDF and Excel through email, with an option of receiving an editable PPT, according to the purchase option. |
Datasheet
One User
USD 3,299
USD 2,969
tax inclusive*
Single User License
One User
USD 5,499
USD 4,949
tax inclusive*
Five User License
Five User
USD 6,999
USD 5,949
tax inclusive*
Corporate License
Unlimited Users
USD 8,199
USD 6,969
tax inclusive*
*Please note that the prices mentioned below are starting prices for each bundle type. Kindly contact our team for further details.*
Flash Bundle
Small Business Bundle
Growth Bundle
Enterprise Bundle
*Please note that the prices mentioned below are starting prices for each bundle type. Kindly contact our team for further details.*
Flash Bundle
Number of Reports: 3
20%
tax inclusive*
Small Business Bundle
Number of Reports: 5
25%
tax inclusive*
Growth Bundle
Number of Reports: 8
30%
tax inclusive*
Enterprise Bundle
Number of Reports: 10
35%
tax inclusive*
How To Order

Select License Type
Choose the right license for your needs and access rights.

Click on ‘Buy Now’
Add the report to your cart with one click and proceed to register.

Select Mode of Payment
Choose a payment option for a secure checkout. You will be redirected accordingly.
Strategic Solutions for Informed Decision-Making
Gain insights to stay ahead and seize opportunities.

Get insights & trends for a competitive edge.

Track prices with detailed trend reports.

Analyse trade data for supply chain insights.

Leverage cost reports for smart savings

Enhance supply chain with partnerships.

Connect For More Information
Our expert team of analysts will offer full support and resolve any queries regarding the report, before and after the purchase.
Our expert team of analysts will offer full support and resolve any queries regarding the report, before and after the purchase.
We employ meticulous research methods, blending advanced analytics and expert insights to deliver accurate, actionable industry intelligence, staying ahead of competitors.
Our skilled analysts offer unparalleled competitive advantage with detailed insights on current and emerging markets, ensuring your strategic edge.
We offer an in-depth yet simplified presentation of industry insights and analysis to meet your specific requirements effectively.


