

Consumer Insights
Uncover trends and behaviors shaping consumer choices today
Procurement Insights
Optimize your sourcing strategy with key market data
Industry Stats
Stay ahead with the latest trends and market analysis.
The elastography imaging market was valued at USD 3.65 Billion in 2025, driven by the increasing prevalence of chronic liver diseases and advancements in non-invasive diagnostic imaging techniques across the globe. The market is anticipated to grow at a CAGR of 7.90% during the forecast period of 2026-2035, with the values likely to reach USD 7.81 Billion by 2035.
Compound Annual Growth Rate
7.9%
Value in USD Billion
2026-2035
Some of the major growth factors include the increased occurrences of chronic liver diseases and breast cancer and the rising demand for advanced diagnostic techniques.
Elastography is a medical imaging that maps soft tissue's elastic properties and rigidity. The key idea is to give diagnostic information about the existence or status of the disease, whether the tissue is hard or soft. The elastography imaging market can be broadly categorised based on technique, applications, and end-uses.
Based on the technique, the elastography imaging market can be segmented into:
Based on application, the elastography imaging market can be divided into:
Based on the end-uses, the elastography imaging market can be divided into:
Based on the region, the elastography imaging market can be divided into:
Read more about this report - REQUEST FREE SAMPLE COPY IN PDF
The elastography imaging procedure is increasing in popularity and acceptance by both patients and doctors, due to its non-invasive nature and precise assessment of mechanical properties of tissue, thus, driving the growth of the industry. Advanced systems of elastography imaging provide both comprehensive qualitative and quantitative diagnosis, which will further propel the industry growth. The increasing demand for innovative diagnostic techniques is expected to replace conventional ultrasound techniques with elastography imaging in developing countries, giving the industry a significant boost. It is commonly used before and after transplantation to determine liver disorders and to monitor the degree of liver cirrhosis. It is expected that the increased incidences of breast cancer and liver disorders would fuel the demand for elastography imaging in the coming years.


The report presents a detailed analysis of the following key players in the global elastography imaging market, looking into their capacity, competitive landscape, and latest developments like capacity expansions, plant turnarounds, and mergers and acquisitions:
The EMR report gives an in-depth insight into the industry by providing a SWOT analysis as well as an analysis of Porter’s Five Forces model.
Upto 15% Off
USD
$3299 $2969
$5499 $4949
$6999 $5949
$8199 $6969


*While we strive to always give you current and accurate information, the numbers depicted on the website are indicative and may differ from the actual numbers in the main report. At Expert Market Research, we aim to bring you the latest insights and trends in the market. Using our analyses and forecasts, stakeholders can understand the market dynamics, navigate challenges, and capitalize on opportunities to make data-driven strategic decisions.*
The market was valued at USD 3.65 Billion in 2025.
The market is anticipated to grow at a CAGR of 7.90% during the forecast period of 2026-2035, with the values likely to reach USD 7.81 Billion by 2035.
The major drivers of the industry, such as the increasing population, rising demand from the developing regions, increasing prevalence of chronic liver disorder and breast cancer, and the growing demand for improved diagnostic facilities, are expected to aid the market growth.
The key market trends guiding the growth of the elastography imaging industry include the growing technological advancements and increased investments by the key players in the research and development activities.
The major regions in the industry are North America, Latin America, the Middle East and Africa, Europe, and the Asia Pacific.
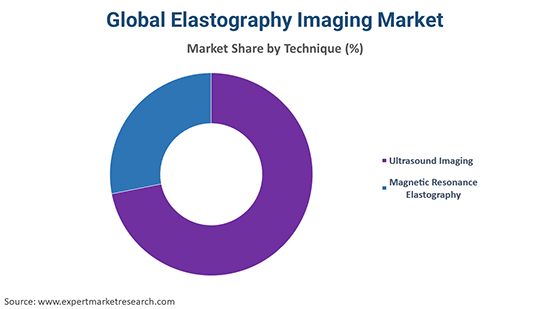
Ultrasound imaging and magnetic resonance elastography are the leading elastography imaging techniques in the industry.
The significant applications of the product in the market include radiology/general imaging, cardiology, obstetrics/gynaecology, urology, vascular, and orthopaedic and musculoskeletal applications, among others.
Hospitals, surgical centres, and diagnostic centres, and ambulatory surgical centres (ASC) are the major end use segments of the product.
The major players in the industry are General Electric Company (NYSE: GE), Koninklijke Philips N.V., Siemens Healthcare Private Limited, Canon Inc., Samsung, Fujifilm Holdings Corporation, Shenzhen Mindray Bio-Medical Electronics Co., Ltd., among others.
Explore our key highlights of the report and gain a concise overview of key findings, trends, and actionable insights that will empower your strategic decisions.
| REPORT FEATURES | DETAILS |
| Base Year | 2025 |
| Historical Period | 2019-2025 |
| Forecast Period | 2026-2035 |
| Scope of the Report |
Historical and Forecast Trends, Industry Drivers and Constraints, Historical and Forecast Market Analysis by Segment:
|
| Breakup by Technique |
|
| Breakup by Application |
|
| Breakup by End User |
|
| Breakup by Region |
|
| Market Dynamics |
|
| Supplier Landscape |
|
| Companies Covered |
|
| Report Price and Purchase Option | Explore our purchase options that are best suited to your resources and industry needs. |
| Delivery Format | Delivered as an attached PDF and Excel through email, with an option of receiving an editable PPT, according to the purchase option. |
Datasheet
One User
USD 3,299
USD 2,969
tax inclusive*
Single User License
One User
USD 5,499
USD 4,949
tax inclusive*
Five User License
Five User
USD 6,999
USD 5,949
tax inclusive*
Corporate License
Unlimited Users
USD 8,199
USD 6,969
tax inclusive*
*Please note that the prices mentioned below are starting prices for each bundle type. Kindly contact our team for further details.*
Flash Bundle
Small Business Bundle
Growth Bundle
Enterprise Bundle
*Please note that the prices mentioned below are starting prices for each bundle type. Kindly contact our team for further details.*
Flash Bundle
Number of Reports: 3
20%
tax inclusive*
Small Business Bundle
Number of Reports: 5
25%
tax inclusive*
Growth Bundle
Number of Reports: 8
30%
tax inclusive*
Enterprise Bundle
Number of Reports: 10
35%
tax inclusive*
How To Order

Select License Type
Choose the right license for your needs and access rights.

Click on ‘Buy Now’
Add the report to your cart with one click and proceed to register.

Select Mode of Payment
Choose a payment option for a secure checkout. You will be redirected accordingly.
Strategic Solutions for Informed Decision-Making
Gain insights to stay ahead and seize opportunities.

Get insights & trends for a competitive edge.

Track prices with detailed trend reports.

Analyse trade data for supply chain insights.

Leverage cost reports for smart savings

Enhance supply chain with partnerships.

Connect For More Information
Our expert team of analysts will offer full support and resolve any queries regarding the report, before and after the purchase.
Our expert team of analysts will offer full support and resolve any queries regarding the report, before and after the purchase.
We employ meticulous research methods, blending advanced analytics and expert insights to deliver accurate, actionable industry intelligence, staying ahead of competitors.
Our skilled analysts offer unparalleled competitive advantage with detailed insights on current and emerging markets, ensuring your strategic edge.
We offer an in-depth yet simplified presentation of industry insights and analysis to meet your specific requirements effectively.


