

Consumer Insights
Uncover trends and behaviors shaping consumer choices today
Procurement Insights
Optimize your sourcing strategy with key market data
Industry Stats
Stay ahead with the latest trends and market analysis.
The global electronic lab notebook market was valued at USD 680.75 Million in 2025. The market is expected to grow at a CAGR of 5.20% during the forecast period of 2026-2035 to reach a value of USD 1130.17 Million by 2035. The market is witnessing accelerated growth as life sciences organizations increasingly transition toward AI-enabled, interoperable, and cloud-native research environments.
The global electronic lab notebook market is expected to grow, owing to the transition towards a unified system for conducting scientific research. An important factor behind the growth of the market is the increasing requirement for capturing data in real time and its seamless integration between instruments used, which helps scientists decrease errors and increase reproducibility in complicated tests. The second major factor fueling the demand for ELNs is the increasing requirement for regulatory compliance in digital documentation, especially in the pharmaceuticals and biotechnology industry.
Another factor driving the market growth is the move from traditional digital documentation technologies to intelligent agentic systems which actively aid in designing and conducting experiments. This development is proving to be helpful in making drug discovery and development more efficient, traceable, and compliant. In addition to this, vendors in the electronic lab notebook market are also introducing cutting-edge AI technologies into their products, allowing researchers to engage with data in real-time.
One such breakthrough contributing to the trend was the launch by Sapio Sciences of the world’s first 3rd generation ELN in September 2025. The company positioned this new platform as an agential scientific partner, that is capable of planning and analysis. It demonstrates the growing capability of ELNs to evolve into intelligent research assistants.
On the other hand, there was also another partnership announced in November 2023 between SciNote and Ganymede Bio, which saw the two parties incorporate the ability for their ELN features to be synchronized with their systems. This shows that the providers are increasing connectivity within their ecosystem, thereby accelerating the electronic lab notebook market development through automation.
Compound Annual Growth Rate
5.2%
Value in USD Million
2026-2035
Get a sample of the market report in PDF – REQUEST A FREE SAMPLE
| Global Electronic Lab Notebook Market Report Summary | Description | Value |
| Base Year | USD Million | 2025 |
| Historical Period | USD Million | 2019-2025 |
| Forecast Period | USD Million | 2026-2035 |
| Market Size 2025 | USD Million | 680.75 |
| Market Size 2035 | USD Million | 1130.17 |
| CAGR 2019-2025 | Percentage | XX% |
| CAGR 2026-2035 | Percentage | 5.20% |
| CAGR 2026-2035 - Market by Region | Asia Pacific | 6.0% |
| CAGR 2026-2035 - Market by Country | India | 6.9% |
| CAGR 2026-2035 - Market by Country | China | 5.6% |
| CAGR 2026-2035 - Market by Product | Cross Disciplinary | 5.7% |
| CAGR 2026-2035 - Market by End User | Life Sciences Companies | 5.9% |
| Market Share by Country 2025 | Japan | 4.4% |
Lab Thread created a consolidated platform for lab software that eliminated the use of disparate software packages for life sciences by incorporating ELN, LIMS, and molecular biology tools into one cohesive system. The platform facilitates workflow continuation, increased collaboration, and immediate data tracking within research processes, encouraging more widespread use of lab informatics systems.
The Lab Operating System was developed by Scispot, where it utilized AI agents in orchestrating scientific processes through the use of A2A and MCP architectures. The innovation provided benefits related to automation, data consolidation, and lab efficiency, thus reinforcing the application of smart technology and facilitating growth within the ELN industry.
Tesselabes announced the launch of the latest version of its electronic lab notebook, featuring enhanced workflow automation and improved data management capabilities. The improvement led to more efficient scientific research activities and usability of the product.
Labguru BioData made an announcement for a new distribution agreement to ensure the widespread use of their electronic lab notebook module. This made the research process more efficient and facilitated the implementation of digital laboratory tools, allowing for effective operations within life sciences companies. This move positively impacted the global electronic lab notebook market.
Market players are increasingly focusing on developing customizable electronic lab notebooks through an open ecosystem that permits laboratories to customize their processes, applications, and create digital research facilities for themselves. Such developments are making it easier and faster for life sciences companies to adopt an elastic research and development process environment. The launch of eLabNext Developer in May 2024 marked another step forward for electronic lab notebooks, enabling users to develop and customize new functionalities within the ELN ecosystem.
The rise in the need for smooth interoperability between instruments and documentation systems is leading to increased automation, minimizing the chances of errors and ensuring accurate scientific data collection. This development is also improving the adoption of ELNs in environments where extensive data is collected, thereby boosting the growth of the electronic lab notebook market. As part of its strategy in November 2023, SciNote teamed up with Ganymede Bio in order to improve the integration of instruments into the ELN system.
As ELN and LIMS software are becoming more convergent, labs are finding ways to streamline their processes by centralizing all research data and increasing workflow efficiency and visibility throughout research and development operations. In response, digital lab platforms that integrate ELN and LIMS have become more common within the pharmaceutical and biotechnology sector. In July 2024, for instance, companies like Thermo Fisher Scientific and Labguru improved integrated lab management by integrating both the ELN and LIMS features into a single platform.
Regulatory obligations like FDA 21 CFR Part 11 and EU Annex 11 are contributing to the increasing need for cloud-based ELN software with validations to maintain integrity of data and to be audit-ready. It is further propelling the transition from legacy applications to digital systems. In April 2026, Benchling’s Validated Cloud continued to lead in the area of regulatory ELNs, aiding compliance to GxP procedures within pharmaceutical and biotechnology firms. Such developments are strengthening the company’s position as a strong competitor in the electronic lab notebook market.
Growing awareness of cybersecurity concerns and certification are expanding growth opportunities in the electronic lab notebook market through both academic and governmental research organizations. Certifications are strengthening user confidence and expanding adoption across sensitive research environments. In March 2026, LabArchives obtained ISO 27001:2022 and FedRAMP Moderate certifications for its government edition, thereby facilitating easier access to United States government-based research organizations.
Read more about this report - REQUEST FREE SAMPLE COPY IN PDF
The Expert Market Research's report titled “Global Electronic Lab Notebook Market Report and Forecast 2026-2035” offers a detailed analysis of the market based on the following segments:
Market Breakup by Product
Key Insight: The electronic lab notebook market scope comprises cross-disciplinary ELN and specific ELN offerings, where the former category is experiencing notable growth through the efforts of companies like Benchling, IDBS (Danaher), and Sapio Sciences through features such as integration via data modeling, AI-based workflow management, and seamless research and development connectivity. While on the other hand, specific ELNs are gaining traction from companies like LabArchives and eLabNext through discipline-specific templates and compliance-oriented configurations. Both the categories of vendors are looking at designing products with modularity and extensibility through APIs.
Market Breakup by License
Key Insight: The marketplace comprises ELNs that are being developed by proprietary organizations and those that are being developed using open-source technology. Some companies, such as Benchling, Thermo Fisher Scientific, and LabWare, are developing proprietary systems with compliance structures, secure cloud technology, and the ability to integrate with other business processes within an organization. On the other hand, open-source companies, including eLabFTW community developers, and hybrid companies are now building on their products with the addition of plug-ins and custom APIs.
Market Breakup by Delivery Mode
Key Insight: The electronic lab notebook market features two delivery modes including on-premise ELNs as well as cloud-hosted ELNs. The growing popularity of cloud-hosted ELNs is being driven by providers such as Benchling, LabArchives under Dotmatics, and Sapio Sciences, which have integrated features including real-time collaboration, artificial intelligence capabilities, and automated data management into their cloud-based solutions. On the other hand, providers like LabWare and IDBS are developing their on-premise and hybrid ELN offerings, powered by exceptional security and compliance validation features.
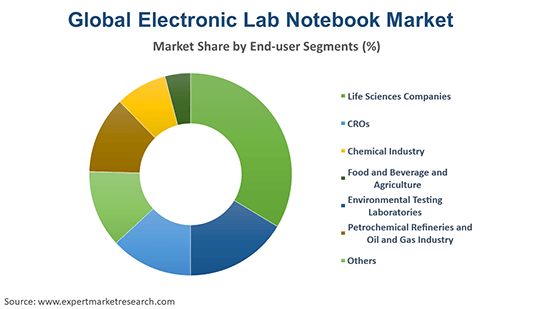
Market Breakup by End User
Key Insight: The market for electronic lab notebooks caters to businesses involved in life sciences, contract research organizations (CROs), chemical industries, food and beverages, environmental and testing labs, and the oil and gas industry. Providers such as Benchling, LabArchives, and IDBS offer tailored solutions for life sciences and CROs with sophisticated research and development and regulatory requirements. Similarly, providers like Thermo Fisher Scientific and Sapio Sciences provide solutions for expanding use in chemical and industrial research and development processes, and providers like LabWare target environmental and testing markets for better traceability and efficiency in data management.
Market Breakup by Region
Key Insight: On regional basis, the electronic lab notebook market landscape covers North America, Europe, Asia-Pacific, Latin America, and the Middle East & Africa. Players like Benchling, LabArchives (Dotmatics), and Thermo Fisher Scientific hold a strong position in North America and Europe, offering highly advanced cloud-based ELN solutions and regulatory compliant products. The vendors like Sapio Sciences and eLabNext dominate in the Asia-Pacific region by forming partnerships and offering regionalized solutions. In emerging markets, the companies are concentrating more on scalable cloud platform and economical ELN solutions.
By product, cross-disciplinary ELN integration is gaining traction in centralized digital lab platforms
The cross-domain electronic lab notebook market is currently holding the dominant position. Companies are strategically focusing on centralized digital lab platforms for seamless integration of data, processes, and collaboration within scientific fields. Vendors are integrating capabilities such as AI-based documentation, streamlined data flow, and robust cloud technology into their systems to facilitate interoperability among biology, chemistry, and computation science domains. Such technological advancements are contributing to more effective research and development activities and innovative cycles within companies. For instance, eLabNext introduced its centralized digital lab system along with brand repositioning in October 2024.
Alternatively, the specific electronic lab notebook market is going through a transformation as manufacturers are focused on creating customized electronic lab notebooks that cater to unique requirements for scientific experiments. This trend is associated with the development of better user interfaces, experiment tracking, and industry-specific modules to improve accuracy and compliance. With such developments, researchers can easily manage complicated experiments while minimizing the need for manual record keeping. For instance, TesseLabes introduced its latest generation of ELNs with an updated interface in December 2024, contributing to the effectiveness of biotech research and increased adoption of specialized digital lab notebooks.
By license, proprietary ELN demand is rising, driven by enterprise compliance and security
The proprietary ELN software solutions are experiencing wide adoption, boosting the overall electronic lab notebook market penetration, due to the emphasis on security, validation, and the need for reliable platforms to store confidential scientific data. Businesses are incorporating compliance-enabled features, including audit trails and analytics tools, into their proprietary ELNs to adhere to stringent regulations from the pharmaceuticals and biotech industries. This guarantees the integrity of the scientific data as well as compliance with regulations during research and development activities. For instance, LabWare made improvements to its enterprise laboratory system with LabWare 8 in August 2024.
The open-source ELNs are gaining momentum in the electronic lab notebook market as companies look for flexible, affordable, and customizable online tools for their research activities. Providers are concentrating on modular platforms, open APIs, and collaborative elements that would give users the ability to customize their work processes depending on changing experimental requirements. The approach seems to suit well academic establishments and nascent research entities. For example, Labstep launched status workflows in July 2024, thus making it easier to track and collaborate on experiments within the ELN application.
By delivery mode, the on-premises category is picking up pace due to secure controlled lab operations
The on-premises electronic lab notebook market continues to cater companies that deal with strict requirements regarding data control, security, and compliance. In this case, companies are equipping their software products with safe connection, better integrations, and enhanced workflow management tools for ensuring controlled work of laboratories within the company. These systems also comply with internal and external regulations. For example, in January 2026, Yokogawa announced the development of digital laboratory connectivity that would enhance integration capabilities and allow creating secure and controlled laboratory environments.
Electronic lab notebooks provided on the basis of cloud technologies are becoming key for companies because they provide better opportunities for collaboration, scalability, data storage, and use of AI-based technology in research. Companies integrate their ELNs with analytic tools and centralized data hubs for improving connectivity and collaboration among team members. For example, in January 2026, CAS launched CAS Intelligence Hub that was aimed at enhancing cloud-based scientific data management.
By end user, the life sciences sector leads demand owing to digital transformation in core research and development activities
Life science companies are major users that are contributing to the surging demand in the electronic lab notebook market, incorporating digital tools into their core research and development process for enhanced experiment documentation, monitoring, and collaboration. Vendors are developing advanced ELN solutions, with automated functionality, data integration, and workflow intelligence capabilities to allow for faster drug development and more reliable research reproducibility. The trend contributes to making ELNs crucial research infrastructure components. For instance, Sapio Sciences rolled out its ELN solution at Oxford Biomedica in July 2023, enabling effective biopharmaceutical research process management.
The growing popularity of contract research organizations (CROs) is significantly contributing to the electronic lab notebook market revenue, due to the rising adoption of ELN across companies for efficient management of research projects conducted on behalf of multiple clients. Companies continue to develop their ELN offerings by including automation capabilities and integration functionalities. Such actions allow for higher performance, compliance, and effectiveness of outsourced research operations. Aligning with this trend, Thermo Fisher signed a partnership deal with Labguru in January 2024.


By region, North America leads the market growth driven by advanced ELN innovation and cloud adoption
The North America leads the electronic lab notebook market attributed to the well-established research and development structures, stringent regulations, and adoption of digital lab technology. Firms are working to develop new ELN platforms that are integrated with artificial intelligence, cloud architecture, and centralizing data storage systems to help manage the complexities involved in research activities. There are many pharmaceutical and biotech firms in the region, which also contributes to innovation and adoption. For instance, SciSure partnered with eLabNext in August 2024, developing advanced research-based digital lab platforms.
On the other hand, Asia Pacific accounts for a considerable share of the electronic lab notebook market and it is emerging as a lucrative business destination due to the rise in investment in the pharmaceuticals industry, increasing biotech research operations, and developments in lab equipment. Various companies are establishing strong market position through collaboration and localizing their software. This trend was illustrated by the collaboration between Labforward and LabTwin in September 2024.
Strategic considerations by the electronic lab notebook market players mainly revolve around leveraging cloud-first approaches and AI-based technologies to optimize processes involved in conducting research and handling information. The integration of the ELNs with laboratory equipment, laboratory information management systems, and analytics tools is expected to increase significantly. There is going to be continuous development of innovative software that will help improve scalability, compliance, and interoperability in pharmaceutical and biotech research facilities all over the world.
Another important step taken by electronic lab notebook companies is to establish collaborations and ecosystem partnerships in order to drive digital transformation in laboratories. Interoperability standards and customization capabilities are expected to remain key focus areas for vendors as they work toward improving the efficiency of digital laboratory management systems. Greater emphasis on user-centricity and modularity of the ELNs is expected to help in wider deployment and adoption of such systems,
Thermo Fisher Scientific Inc. is one of the most prestigious companies that supplies equipment and solutions related to scientific informatics to different organizations. This company was established in 2006, and it has its headquarters in Waltham, Massachusetts, United States. It is an international company which is actively involved in development of science, technologies, and healthcare.
LabWare is one of the pioneers that offers lab informatics solutions with an emphasis on the implementation of ELN & LIMS systems that facilitate scientific data management and efficient operation of laboratory operations. LabWare was founded in 1987 and is based in Wilmington, Delaware, United States of America.
Bruker is among the major companies that manufactures highly advanced scientific instruments for various analysis purposes, which are widely utilized in the field of life sciences. The company is a prominent player in the electronic lab notebook market, established in 1960 with its head office in Billerica, Massachusetts, United States of America.
Abbott Laboratories is a global company that is involved in the field of healthcare and life science. This company specializes in developing diagnostic tools and healthcare technologies. Abbott Laboratories was established in 1888, and its headquarters are located in Abbott Park, Illinois, United States of America.
Other key players in the market include LabVantage Solutions Inc., LabLynx, Inc., and Benchling, Inc., among others.
*Please note that this is only a partial list; the complete list of key players is available in the full report. Additionally, the list of key players can be customized to better suit your needs.*
Explore the latest trends shaping the global electronic lab notebook market 2026-2035 with our in-depth report. Gain strategic insights, future forecasts, and key market developments that can help you stay competitive. Download a free sample report or contact our team for customized consultation on global electronic lab notebook market trends 2026.
Upto 15% Off
USD
$2499 $2249
$3999 $3599
$4999 $4249
$5999 $5099


*While we strive to always give you current and accurate information, the numbers depicted on the website are indicative and may differ from the actual numbers in the main report. At Expert Market Research, we aim to bring you the latest insights and trends in the market. Using our analyses and forecasts, stakeholders can understand the market dynamics, navigate challenges, and capitalize on opportunities to make data-driven strategic decisions.*
In 2025, the global electronic lab notebook market attained a value of nearly USD 680.75 Million.
The market is projected to grow at a CAGR of 5.20% between 2026 and 2035.
The major drivers of the market are development of automated laboratories, growing demand for quick data delivery and enhanced data quality, growing research and development activities across the globe, rising awareness regarding the benefits offered by electronic lab notebooks, and strict regulatory compliances.
The key trends guiding the growth of the market include the growing technological advancements and the launch of improved and enhanced versions of electronic lab notebooks with smart features.
The major regions in the market are North America, Latin America, the Middle East and Africa, Europe, and the Asia Pacific.
Cross disciplinary and specific are the major products in the global electronic lab notebook market.
The leading license segments of the product in the market include proprietary and open electronic lab notebook licenses.
On-premise and web-hosted/cloud-based are the significant electronic lab notebook delivery modes in the market.
Life sciences companies, CROs, chemical industry, food and beverage and agriculture, environmental testing laboratories, and petrochemical refineries, and oil and gas industry are the significant end user segments of the product in the market.
The major players in the market are Thermo Fisher Scientific Inc., LabWare, Bruker, Abbott Laboratories, LabVantage Solutions Inc., LabLynx, Inc., and Benchling, Inc., among others.
The market is estimated to witness a healthy growth in the forecast period of 2026-2035 to reach USD 1130.17 Million by 2035.
Explore our key highlights of the report and gain a concise overview of key findings, trends, and actionable insights that will empower your strategic decisions.
| REPORT FEATURES | DETAILS |
| Base Year | 2025 |
| Historical Period | 2019-2025 |
| Forecast Period | 2026-2035 |
| Scope of the Report |
Historical and Forecast Trends, Industry Drivers and Constraints, Historical and Forecast Market Analysis by Segment:
|
| Breakup by Product |
|
| Breakup by License |
|
| Breakup by Delivery Mode |
|
| Breakup by End User |
|
| Breakup by Region |
|
| Market Dynamics |
|
| Competitive Landscape |
|
| Companies Covered |
|
| Report Price and Purchase Option | Explore our purchase options that are best suited to your resources and industry needs. |
| Delivery Format | Delivered as an attached PDF and Excel through email, with an option of receiving an editable PPT, according to the purchase option. |
Datasheet
One User
USD 2,499
USD 2,249
tax inclusive*
Single User License
One User
USD 3,999
USD 3,599
tax inclusive*
Five User License
Five User
USD 4,999
USD 4,249
tax inclusive*
Corporate License
Unlimited Users
USD 5,999
USD 5,099
tax inclusive*
*Please note that the prices mentioned below are starting prices for each bundle type. Kindly contact our team for further details.*
Flash Bundle
Small Business Bundle
Growth Bundle
Enterprise Bundle
*Please note that the prices mentioned below are starting prices for each bundle type. Kindly contact our team for further details.*
Flash Bundle
Number of Reports: 3
20%
tax inclusive*
Small Business Bundle
Number of Reports: 5
25%
tax inclusive*
Growth Bundle
Number of Reports: 8
30%
tax inclusive*
Enterprise Bundle
Number of Reports: 10
35%
tax inclusive*
How To Order

Select License Type
Choose the right license for your needs and access rights.

Click on ‘Buy Now’
Add the report to your cart with one click and proceed to register.

Select Mode of Payment
Choose a payment option for a secure checkout. You will be redirected accordingly.
Strategic Solutions for Informed Decision-Making
Gain insights to stay ahead and seize opportunities.

Get insights & trends for a competitive edge.

Track prices with detailed trend reports.

Analyse trade data for supply chain insights.

Leverage cost reports for smart savings

Enhance supply chain with partnerships.

Connect For More Information
Our expert team of analysts will offer full support and resolve any queries regarding the report, before and after the purchase.
Our expert team of analysts will offer full support and resolve any queries regarding the report, before and after the purchase.
We employ meticulous research methods, blending advanced analytics and expert insights to deliver accurate, actionable industry intelligence, staying ahead of competitors.
Our skilled analysts offer unparalleled competitive advantage with detailed insights on current and emerging markets, ensuring your strategic edge.
We offer an in-depth yet simplified presentation of industry insights and analysis to meet your specific requirements effectively.


