

Consumer Insights
Uncover trends and behaviors shaping consumer choices today
Procurement Insights
Optimize your sourcing strategy with key market data
Industry Stats
Stay ahead with the latest trends and market analysis.

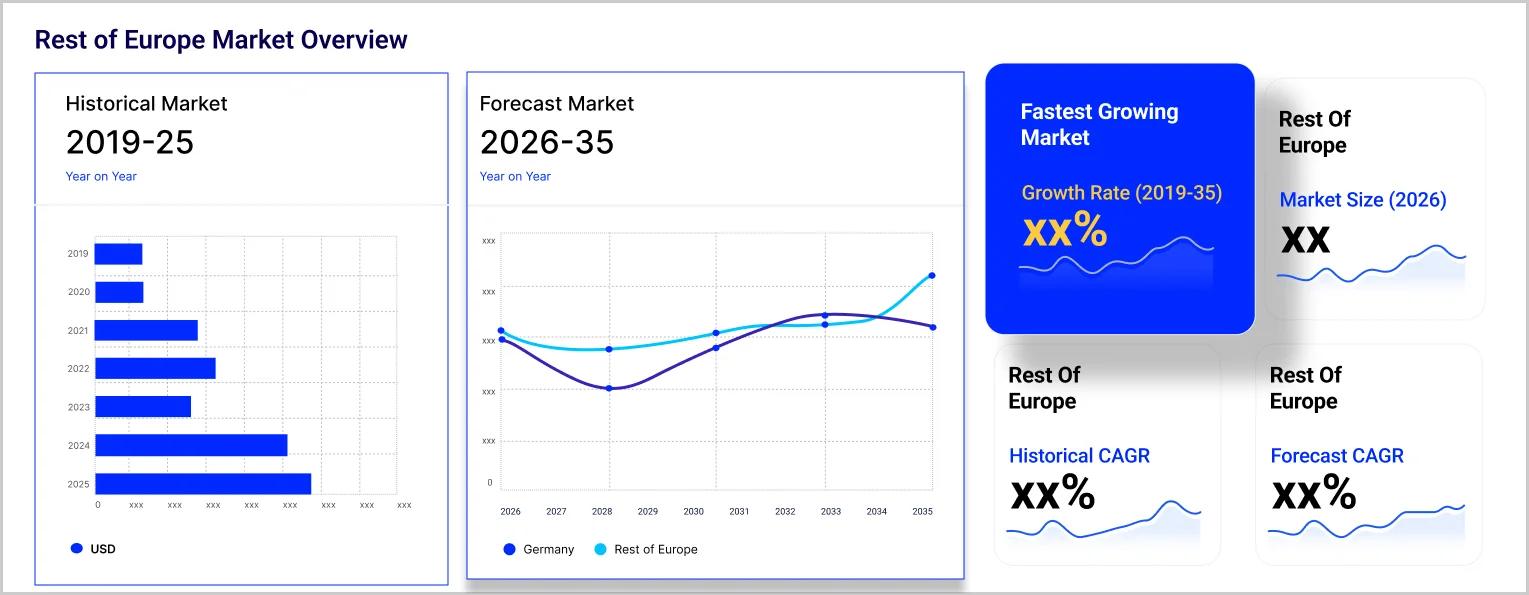
The Europe agricultural tractors market attained a volume of 160.31 Thousand Units in 2025. The industry is expected to grow at a CAGR of 1.60% during the forecast period of 2026-2035 to attain a volume of 187.89 Thousand Units by 2035.
Geopolitical Impact of Iran, US, and Israel War on the Europe Agricultural Tractors Market
United States: The Europe Agricultural Tractors Market, a key segment of the global economy, is experiencing a complex operating environment in Q1 2026 as a direct consequence of the US-Israel-Iran war. Europe faces elevated risks of recession and stagflation. The ECB warns a prolonged conflict will trigger a period of low growth and inflation. Chemical and steel manufacturers have imposed surcharges of up to 30%. European steel manufacturers are imposing surcharges of up to 30% on buyers to offset surging electricity and feedstock costs from LNG supply disruptions. Germany, the Netherlands, the United Kingdom and Italy face the highest recession risk. The Ifo Institute flags Germany and the Netherlands at high risk. UK inflation is projected to breach 5% in 2026. The ECB faces a stagflation dilemma, with rate increases to fight inflation risking a deeper economic contraction across major European markets.
Iran: Iran's domestic Europe Agricultural Tractors sector has been effectively suspended by the conflict. US-Israeli strikes on industrial and civilian infrastructure across Tehran, Mashhad, Isfahan, and other major cities have disrupted all commercial activity. Power outages from attacks on electricity generation facilities have halted manufacturing operations, and the collapse of the commercial banking and logistics system has eliminated any residual trade flows. The broader humanitarian crisis, with over 1,900 casualties and 4,000+ civilian buildings damaged, has redirected the entire Iranian economy toward survival rather than production or consumption.
Israel: Israel's Europe Agricultural Tractors sector is experiencing near-term disruption from wartime conditions. Consumer spending on non-essential categories has declined as millions of Israelis regularly shelter from missile and drone alerts. Supply chain logistics are disrupted by regional airspace closures, elevated war-risk insurance premiums, and the suspension of major carrier services through the region. International business partnerships with Israeli companies have been temporarily suspended. Post-conflict reconstruction and recovery demand is expected to provide meaningful demand acceleration across affected market segments once operational conditions normalise.
Government
Market
Procurement
Base Year
Historical Period
Forecast Period
According to the data by National Authorities, around 158,100 agricultural tractors were registered in Europe in 2023.
As per the Agricultural Engineers Association (AEA), the total tractor registrations in the UK witnessed an increase of 2 per cent in 2023.
As per the industry reports, in 2023, the Common Agricultural Policy (CAP) program allocated around €264 billion in the 2023-2027 fiscal year for supporting farmers and rural development, which can include providing high-end agricultural machinery and tractors.
Compound Annual Growth Rate
1.6%
Value in Thousand Units
2026-2035
*this image is indicative*
Rising preference for sustainable tractors, favourable government policies and subsidies for agricultural development, and integration of advanced features such as GPS tracking into tractors are some of the crucial drivers for growth of the Europe agricultural tractors market.
The rising global population and the need to enhance food production have led farmers to adopt tractors that can deliver greater efficiency and higher outputs. Moreover, there is also a gradual shift towards electric and hybrid tractors, which contribute to sustainable agriculture by reducing emissions, minimising noise levels, and lowering operational expenses.
Telematics technology is creating new Europe agricultural tractors market opportunities as it gathers and sends real-time data which plays a crucial role in improving fleet management, scheduling maintenance, monitoring field status, and ultimately boosting the efficiency of agricultural operations. For instance, farmers can make informed decisions regarding irrigation, fertilisation, and pest control by collecting data on soil moisture levels, temperature, and other environmental factors.
Increased agricultural output, growing adoption of smart and sustainable electric tractors as well as introduction of robotics in agriculture sector is increasing the Europe agricultural tractors market value.
The European Union accounts for one of the largest agricultural productions in the world. According to the official statistical organization of the European Union, the value of total agricultural output in the region was estimated at EUR 537.1 billion. This value is expected to grow in the coming years driving growth of the Europe agricultural tractors industry.
Growing concerns over environmental sustainability and national carbon emission reduction targets of European nations have increased the preference for electric tractors among farmers. Key players such as Monarch, New Holland, and Kubota which account for major agricultural tractors market share in Europe. They are manufacturing efficient electric tractors with high capacity and maximized operational output to meet their growing demand.
Growing technological advancements have created new agricultural tractors demand with smart AI, automation, and robotic based equipment. Industry leaders are increasingly investing in research and development of such technologies eyeing future growth. For instance, Danish agrotech company Agrointelli had delivered UK’s first commercially available robotic tractor in 2021 to be operated on Suffolk farm with a built-in robot to evenly distribute weight across four wheels and autonomous GPS mapping enabling it to follow pre-programmed planned routes.
Europe’s maximum agricultural output arrives from small farmlands which have highly mechanized management systems. Since the conventional tractors are too large for such farms, farmers are increasingly preferring compact and lightweight alternatives. For instance, the Oja series of tractors, manufactured by Mahindra and Mahindra (M&M), expected to be launched in European market during 2025, is in high demand due to its lightweight and compact features. Other market players like Kubota and Solis Tractors have also launched their compact and lightweight tractor series catering to the new demand.
“Europe Agricultural Tractors Market Report and Forecast 2026-2035” offers a detailed analysis of the market based on the following segments:
Market Breakup by Engine Power
Market Breakup by Type
Market Breakup by Propulsion
Market Breakup by Country
Based on propulsion, the market is divided into electric and ICE. The ICE tractors account for a substantial market share as these tractors have been the foundation of agricultural mechanisation for years and farmers are more familiar with them compared to the electric tractors. Additionally, ICE tractors generally provide greater power and longer operating time between refuels when compared to current electric models, boosting segment growth.
The market players are readily focused on developing green tractors due to the rising carbon emissions related to farming.
Upto 15% Off
USD
$3999 $3599
$2499 $2249
$4999 $4249
$5999 $5099


*While we strive to always give you current and accurate information, the numbers depicted on the website are indicative and may differ from the actual numbers in the main report. At Expert Market Research, we aim to bring you the latest insights and trends in the market. Using our analyses and forecasts, stakeholders can understand the market dynamics, navigate challenges, and capitalize on opportunities to make data-driven strategic decisions.*
Get in touch with us for a customized solution tailored to your unique requirements and save upto 35%!
In 2025, the market reached an approximate volume of 160.31 Thousand Units.
The market is estimated to grow at a CAGR of 1.60% between 2026 and 2035.
The Europe agricultural tractors market is estimated to witness a healthy growth during 2026-2035 to reach around 187.89 Thousand Units by 2035.
The market is being driven due to rising preference for sustainable tractors, favourable government policies and subsidies for agricultural development, and the integration of advanced features such as GPS tracking into tractors.
The key trends aiding the market include a shift towards electric and hybrid tractors, adoption of Telematics technology, and consolidation of farms.
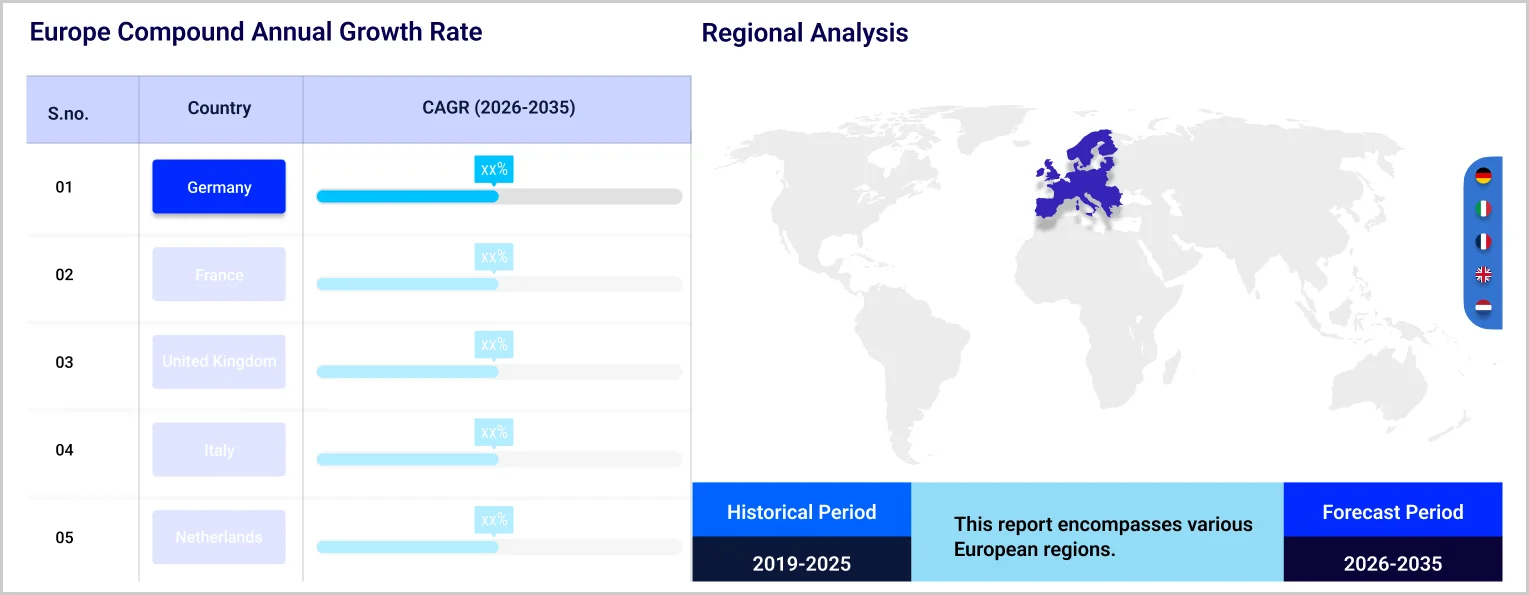
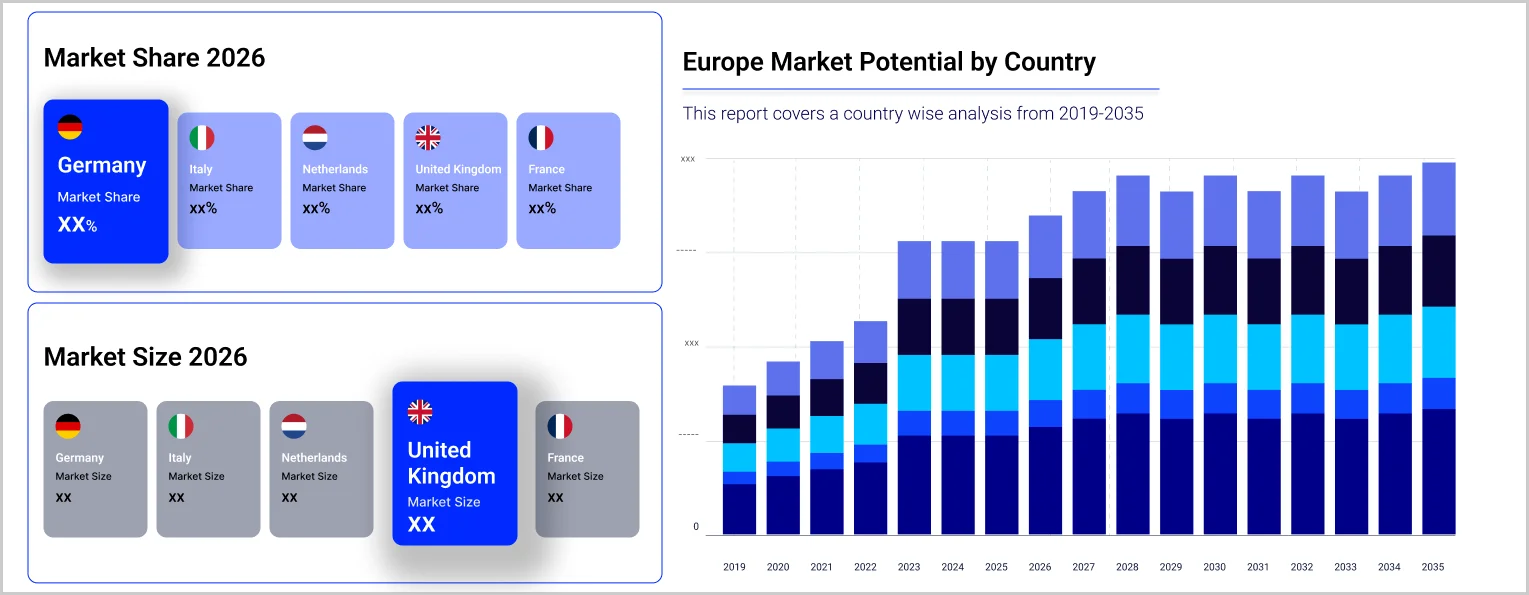
Countries considered in the market are the United Kingdom, Germany, France, and Italy, among others.
Based on propulsion, market segmentations include electric and ice.
Different engine powers are less than 40 hp, 41 to 100 hp, and more than 100 hp, among others.
The major players in the market are Kubota Corp., CNH Industrial N.V., Deere & Co., Yanmar Holdings Co., Ltd., AGCO Corp., SDF S.p.A (DEUTZ-FAHR), Daedong Corporation, Mahindra and Mahindra Ltd., Argo Tractors S.p.A, and CLAAS KGaA GmbH, among others.
Explore our key highlights of the report and gain a concise overview of key findings, trends, and actionable insights that will empower your strategic decisions.
| REPORT FEATURES | DETAILS |
| Base Year | 2025 |
| Historical Period | 2019-2025 |
| Forecast Period | 2026-2035 |
| Scope of the Report |
Historical and Forecast Trends, Industry Drivers and Constraints, Historical and Forecast Market Analysis by Segment:
|
| Breakup by Engine Power |
|
| Breakup by Type |
|
| Breakup by Propulsion |
|
| Breakup by Region |
|
| Market Dynamics |
|
| Competitive Landscape |
|
| Companies Covered |
|
Single User License
One User
USD 3,999
USD 3,599
tax inclusive*
Datasheet
One User
USD 2,499
USD 2,249
tax inclusive*
Five User License
Five User
USD 4,999
USD 4,249
tax inclusive*
Corporate License
Unlimited Users
USD 5,999
USD 5,099
tax inclusive*
*Please note that the prices mentioned below are starting prices for each bundle type. Kindly contact our team for further details.*
Flash Bundle
Small Business Bundle
Growth Bundle
Enterprise Bundle
*Please note that the prices mentioned below are starting prices for each bundle type. Kindly contact our team for further details.*
Flash Bundle
Number of Reports: 3
20%
tax inclusive*
Small Business Bundle
Number of Reports: 5
25%
tax inclusive*
Growth Bundle
Number of Reports: 8
30%
tax inclusive*
Enterprise Bundle
Number of Reports: 10
35%
tax inclusive*
How To Order

Select License Type
Choose the right license for your needs and access rights.

Click on ‘Buy Now’
Add the report to your cart with one click and proceed to register.

Select Mode of Payment
Choose a payment option for a secure checkout. You will be redirected accordingly.
Strategic Solutions for Informed Decision-Making
Gain insights to stay ahead and seize opportunities.

Get insights & trends for a competitive edge.

Track prices with detailed trend reports.

Analyse trade data for supply chain insights.

Leverage cost reports for smart savings

Enhance supply chain with partnerships.

Connect For More Information
Our expert team of analysts will offer full support and resolve any queries regarding the report, before and after the purchase.
Our expert team of analysts will offer full support and resolve any queries regarding the report, before and after the purchase.
We employ meticulous research methods, blending advanced analytics and expert insights to deliver accurate, actionable industry intelligence, staying ahead of competitors.
Our skilled analysts offer unparalleled competitive advantage with detailed insights on current and emerging markets, ensuring your strategic edge.
We offer an in-depth yet simplified presentation of industry insights and analysis to meet your specific requirements effectively.


Share