

Consumer Insights
Uncover trends and behaviors shaping consumer choices today
Procurement Insights
Optimize your sourcing strategy with key market data
Industry Stats
Stay ahead with the latest trends and market analysis.
The global fluid loss additives market was valued at USD 373.86 Million in 2025. The market is expected to grow at a CAGR of 4.50% during the forecast period of 2026-2035 to reach a value of USD 580.59 Million by 2035. Increasing technological integration across offshore oil and gas operations is driving demand for advanced well construction solutions, indirectly strengthening the market development.
According to Reuters, ongoing deepwater development across Brazil's pre-salt basins is sustaining demand for advanced cementing and drilling fluid systems. Halliburton and SLB are executing multi-year integrated services contracts with Petrobras covering Campos, Santos, and Espírito Santo basins, requiring specialised fluid loss additives for high-pressure, high-temperature operations and reinforcing North America and Latin America as dominant consumption regions.
As reported by U.S. Energy Information Administration, sustained Permian basin output and continued horizontal drilling and hydraulic fracturing activity through early 2026 are anchoring North American demand for polyanionic cellulose, polyacrylamide, and nanocomposite fluid loss control systems. The country remains the single largest market for fluid loss additives, with stable rig counts supporting steady consumption from drilling fluid and oilwell cementing applications.
The increasing complexity in drilling and the development of unconventional hydrocarbon exploration activities are among the key factors fueling demand in the fluid loss additives market. The increase in depths of wells, operating at the conditions of higher pressure and temperature, results in the need for more advanced additives to regulate the filtration losses as well as keep the stability of the wellbore. In addition, there is an increasing emphasis on improving the effectiveness of drilling fluids and minimizing the effects on formation, due to which innovative polymer-based additives are increasingly being used.
With exploration and production operations progressively focusing on deep reservoirs and complex offshore developments, the market observes an increasing demand for high-efficiency drilling fluids and cementing systems that can manage filtrate losses, provide wellbore stability, and ensure zonal isolation. These demand factors are pushing the oilfield service companies to develop their product portfolios via acquisitions, collaborations, and research activities, hence improving integrated well construction technologies. Such innovations help the companies to deploy better fluid systems and chemicals during drilling and completion operations, which ultimately helps to drive the future growth of the fluid loss additives market. For example, in March 2026, SLB revealed that its OneSubsea subsidiary had entered into an agreement to acquire the subsea business of Envirex Group AS as a measure to increase the firm's technology portfolio and facilitate faster deployment of new subsea solutions around the globe. This acquisition is expected to allow the firm to deploy better offshore production systems and well construction technologies, thereby indirectly promoting the use of advanced drilling fluids and cement additives in modern offshore projects.
Compound Annual Growth Rate
4.5%
Value in USD Million
2026-2035
Read more about this report - REQUEST FREE SAMPLE COPY IN PDF
SLB partnered with ADNOC Drilling to accelerate unconventional oil and gas development through integrated drilling and evaluation technologies. Such collaborations reflect increasing investments in advanced drilling solutions, encouraging service providers to enhance technological capabilities and strengthen innovation across upstream operations.
CST Drilling Fluids joined Azure Holding Group to strengthen its drilling fluids technology portfolio and expand global service capabilities. Such strategic consolidations highlight the industry’s focus on enhancing integrated oilfield service offerings and advancing chemical solution development.
Halliburton launched the LOGIX intelligent automation technology for achieving precision in drilling operations using advanced automation techniques and data analytics. Such innovations improve efficiency in drilling operations and contribute indirectly to innovations in the fluid loss additives market due to increased operational complexity.
Halliburton introduced an innovative lost circulation cementing solution, which was geared towards ensuring improved wellbore stability and reduced fluid loss while drilling. Product advancements like these help boost technological developments in the fluid loss additives market.
Environmental factors are gaining importance as key determinants for developing products in the oilfield chemicals industry, thereby motivating companies to develop environmentally friendly additive packages. The fluid loss additives market observes several developments in formulations that are eco-friendly without compromising the efficiency of drilling operations and wellbore protection. Such developments are gradually affecting the standards and regulations in the drilling operations industry. As a result, the industry witnessed the launch of the Envirex system by SLB in September 2023, aimed at facilitating environmentally responsible drilling operations.
The growing competition in oilfield chemical solutions is motivating players in the fluid loss additives market to focus on mergers and acquisitions, which can boost their technical abilities and service demand. By combining the special additives technology and digital oil field solution, the participants are able to boost the performance of the drilling efficiency and wellbore stabilization solutions. This merger strategy allows for improvement of the company's product pipeline and geographic presence. For instance, in April 2024, SLB announced an all-stock acquisition of ChampionX to strengthen its production and reservoir chemistry technology capabilities.
Portfolio restructuring is becoming one of the major trends among oilfield services companies that are aiming to focus on their core technological fields. With the divestiture of non-core business sectors, companies get the opportunity to invest more in valuable chemical and drilling fluids technologies needed for complicated wells drilling operations. Portfolio restructuring also contributes to greater specialization in the fluid loss additives market and operational efficiency of businesses. An example of this portfolio restructuring trend was observed in September 2023, when Newpark Resources announced the sale of its Fluids Systems business unit as part of its strategic realignment efforts.
Businesses are making efforts towards operational expansion as well as technological deployments due to increasing demand for high-end drilling fluid systems. Enhancement in infrastructure along with services and additives often result in better wellbore stability and fluid control during drilling operations. This fluid loss additives market trend is evident from the report issued by CES Energy Solutions in July 2024, wherein the company made notable efforts towards operational expansion and technological advancements in several chemical categories of the oilfield, including the advanced drilling fluids.
The global market witnesses increased efforts by oilfield service companies to penetrate developing regions where explorations and production are on the rise. Through the development of regional supply capabilities and introduction of special drilling fluid additives, it has become possible for companies to help their customers within such regions more easily. These kinds of fluid loss additives market expansion initiatives are helping in building up the regional supply chain for drilling chemicals. As an example, in August 2023, the Aubin Group noted their first sales of fluid loss additives in North Africa.
Read more about this report - REQUEST FREE SAMPLE COPY IN PDF
The Expert Market Research's report titled “Global Fluid Loss Additives Market Report and Forecast 2026-2035” offers a detailed analysis of the market based on the following segments:
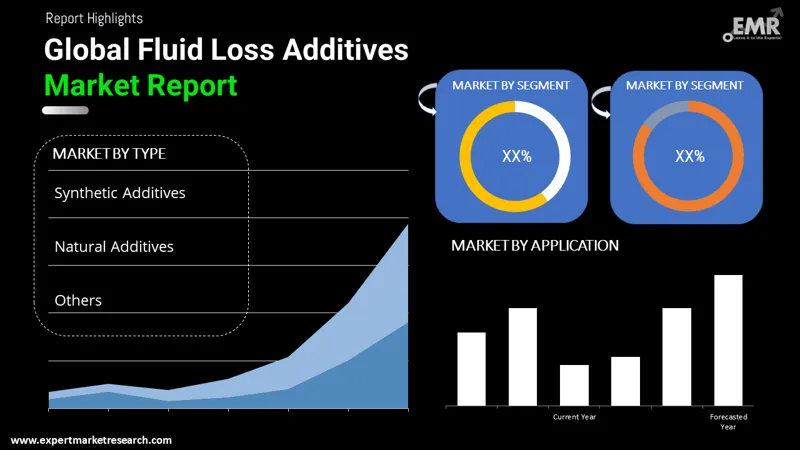
Market Breakup by Type
Key Insight: This market is influenced by an increase in adoption of synthetically modified natural additives, synthetic additives, and natural additives depending on specific operational needs at drill sites. Synthetically modified natural additives are experiencing more adoption due to increased thermal stability and cost efficiency, whereas synthetic additives are widely used in drilling fluids in high-pressure and high-temperature wells. Moreover, natural additives continue to be in demand in relation to environmentally acceptable drilling processes. Leading firms like SLB, Halliburton, and Baker Hughes are diversifying the portfolio of products by launching innovative solutions.
Market Breakup by Application
Key Insight: Demand in the fluid loss additives market is expected to rise in response to the applications in drilling fluid and cement slurry. Drilling fluids are important for the maintenance of wellbore stability as well as the prevention of fluid entry into drilled wells. The leading companies must ensure that they develop advanced additives that will provide enhanced performance when incorporated into drilling fluids. Additives in the cement slurry segment must be geared towards the improvement of the quality of the cementing process. Leading oilfield services companies like Halliburton, SLB, and Schlumberger are working towards the integration of drilling fluid and cementing processes.
Market Breakup by Region
Key Insight: The fluid loss additives market growth is mainly driven by an increase in drilling activities in North America, Europe, the Asia Pacific region, Latin America, and the Middle East and Africa. The highest growth rate is expected in North America owing to extensive shale drilling activities. On the other hand, the European market observes a growing interest in offshore exploration technology. In Latin America and the Asia Pacific, market growth can be attributed to growing demand for energy along with new explorations. In the Middle East and Africa, there is already an established presence of massive upstream investments.
Read more about this report - REQUEST FREE SAMPLE COPY IN PDF
By type, synthetically modified natural additives witness high demand driven by the development of advanced resin and polymer-based well stabilization solutions
Synthetically modified natural additives in the fluid loss additives market experiences growth from increased development and usage of resin- and polymer-based enhanced additives for stabilization of formations and filtration loss control. Such additives are being developed using naturally occurring polymers combined with synthetic additives to enhance thermal stability and functionality in challenging wells. In October 2024, Halliburton announced the introduction of its SandTrap XL chemical consolidation system, an innovative low-viscosity resin product which increases grain strength of formations without compromising on permeability. This example demonstrates the advancements in chemically modified additives made by oil field service companies.
The continuous growth of the natural additives category in the fluid loss additives market is bolstered by ongoing use of biodegradable products such as starch, cellulose and biopolymer additives for drilling fluids due to their efficiency and environmental friendliness. In addition, industry consolidations accelerate improved competencies in this space. For example, in September 2024, SCF Partners acquired Newpark Fluids Systems, the leading provider of drilling fluid technologies. The deal helped in gaining an increased access to drilling fluids and additives utilized extensively in global upstream oil and gas operations.
By application, the drilling fluid category leads the market growth driven by expansion of large-scale offshore drilling projects
Within the drilling fluids application segment of the fluid loss additives market, several key factors contribute to growth, particularly the rise in offshore drilling operations, which increased demand for specialized fluids capable of effectively controlling filtration losses. In December 2024, for instance, SLB entered into an agreement with Petrobras for the provision of integrated drilling services covering over 100 offshore wells in Brazil.
As for the cement slurry segment of the fluid loss additives market, the main factor supporting its growth includes the development of advanced technologies in the field of cementing aimed at reducing fluid loss. Advanced additives are being introduced to enhance the efficiency of cementing operations performed for complex wells. For instance, in May 2024, Halliburton offered the SentinelCem Pro cement system for eliminating the problem of severe lost circulation and enhancing the efficiency of cementing processes.


Read more about this report - REQUEST FREE SAMPLE COPY IN PDF
By region, North America dominates the market growth, driven by continuous innovation in drilling fluid additive technologies
The North America fluid loss additives market growth is mainly attributed to innovation and developments that take place within the mature oilfield services landscape. Advanced wellbore sealant and filtration control chemicals are being continuously developed to meet the needs of unconventional drilling. For instance, in September 2023, Halliburton introduced the BaraFLC Nano-1 wellbore sealant in Houston, United States. The launch of the wellbore sealant expands the drilling fluid additives range to enhance wellbore integrity and minimize filtration losses within shale formations.
Within the Middle East & Africa region, the growth of the fluid loss additives market can be attributed to growing upstream explorations and investments into oilfield service infrastructure. Emerging drilling operations require an efficient supply chain of chemicals used in drilling and cementing processes. As a result, in November 2024, Halliburton established new facilities in Namibia to provide drilling fluid and cementing services. These investments increase the regional availability of oilfield chemical technology, including fluid loss additives.
The stakeholders operating within the market are now concentrating on product innovations and formulation improvements to boost their filtration control capability in high-pressure, high-temperature drilling activities. The major fluid loss additives market players are working on the development of innovative polymer-based and chemically enhanced additives, which boost the stability of wells and increase drilling efficiency. Furthermore, the firms are working towards improving their research abilities and developing their line of specialty additives to address any technical challenges related to complex drilling environments.
Moreover, fluid loss additive companies are now moving towards strategic partnership initiatives along with capacity expansions to bolster their presence in major oil and gas-producing regions. The firms are making efforts to distinguish themselves through manufacturing capabilities, technical service offerings, and supply chain management facilities. Moreover, players are employing innovative drilling technology and fluid engineering solutions in order to enhance their product performance and decrease risks.
Halliburton Company, the parent company of Halliburton Energy Services, was founded in 1919 and has its headquarters in Houston. The company offers drilling fluids, cementing, and well construction services to oil and gas companies all over the world.
Nouryon Chemicals Holding B.V. was established in 2018 following the separation of Akzo Nobel N.V.’s specialty chemicals business and is headquartered in Amsterdam, the Netherlands. The company provides specialty chemicals and performance additives for energy, agriculture, and industrial uses.
Newpark Resources Inc. is founded in 1932 and has its headquarters in The Woodlands, United States. The company supplies drilling fluid systems, specialty chemicals, and site management services to oil and gas companies around the world.
Kemira Oyj was founded in 1920 and has its headquarters in Helsinki. Kemira develops chemical solutions and performance additives for water treatment, pulp & paper, and process industries worldwide.
Other key players in the market include Clariant AG, Solvay, Tytan Organics Pvt. Ltd., among others.
*Please note that this is only a partial list; the complete list of key players is available in the full report. Additionally, the list of key players can be customized to better suit your needs.*
Explore the latest trends shaping the global fluid loss additives market 2026-2035 with our in-depth report. Gain strategic insights, future forecasts, and key market developments that can help you stay competitive. Download a free sample report or contact our team for customized consultation on global fluid loss additives market trends 2026.
Upto 15% Off
USD
$2499 $2249
$3999 $3599
$4999 $4249
$5999 $5099


*While we strive to always give you current and accurate information, the numbers depicted on the website are indicative and may differ from the actual numbers in the main report. At Expert Market Research, we aim to bring you the latest insights and trends in the market. Using our analyses and forecasts, stakeholders can understand the market dynamics, navigate challenges, and capitalize on opportunities to make data-driven strategic decisions.*
Explore our key highlights of the report and gain a concise overview of key findings, trends, and actionable insights that will empower your strategic decisions.
| REPORT FEATURES | DETAILS |
| Base Year | 2025 |
| Historical Period | 2019-2025 |
| Forecast Period | 2026-2035 |
| Scope of the Report |
Historical and Forecast Trends, Industry Drivers and Constraints, Historical and Forecast Market Analysis by Segment:
|
| Breakup by Type |
|
| Breakup by Application |
|
| Breakup by Region |
|
| Market Dynamics |
|
| Competitive Landscape |
|
| Companies Covered |
|
| Report Price and Purchase Option | Explore our purchase options that are best suited to your resources and industry needs. |
| Delivery Format | Delivered as an attached PDF and Excel through email, with an option of receiving an editable PPT, according to the purchase option. |
Datasheet
One User
USD 2,499
USD 2,249
tax inclusive*
Single User License
One User
USD 3,999
USD 3,599
tax inclusive*
Five User License
Five User
USD 4,999
USD 4,249
tax inclusive*
Corporate License
Unlimited Users
USD 5,999
USD 5,099
tax inclusive*
*Please note that the prices mentioned below are starting prices for each bundle type. Kindly contact our team for further details.*
Flash Bundle
Small Business Bundle
Growth Bundle
Enterprise Bundle
*Please note that the prices mentioned below are starting prices for each bundle type. Kindly contact our team for further details.*
Flash Bundle
Number of Reports: 3
20%
tax inclusive*
Small Business Bundle
Number of Reports: 5
25%
tax inclusive*
Growth Bundle
Number of Reports: 8
30%
tax inclusive*
Enterprise Bundle
Number of Reports: 10
35%
tax inclusive*
How To Order

Select License Type
Choose the right license for your needs and access rights.

Click on ‘Buy Now’
Add the report to your cart with one click and proceed to register.

Select Mode of Payment
Choose a payment option for a secure checkout. You will be redirected accordingly.
Strategic Solutions for Informed Decision-Making
Gain insights to stay ahead and seize opportunities.

Get insights & trends for a competitive edge.

Track prices with detailed trend reports.

Analyse trade data for supply chain insights.

Leverage cost reports for smart savings

Enhance supply chain with partnerships.

Connect For More Information
Our expert team of analysts will offer full support and resolve any queries regarding the report, before and after the purchase.
Our expert team of analysts will offer full support and resolve any queries regarding the report, before and after the purchase.
We employ meticulous research methods, blending advanced analytics and expert insights to deliver accurate, actionable industry intelligence, staying ahead of competitors.
Our skilled analysts offer unparalleled competitive advantage with detailed insights on current and emerging markets, ensuring your strategic edge.
We offer an in-depth yet simplified presentation of industry insights and analysis to meet your specific requirements effectively.


