

Consumer Insights
Uncover trends and behaviors shaping consumer choices today
Procurement Insights
Optimize your sourcing strategy with key market data
Industry Stats
Stay ahead with the latest trends and market analysis.
The global grain elevator market attained a value of USD 21.60 Billion in 2025 and is projected to expand at a CAGR of 4.70% through 2035. The market is further expected to achieve USD 34.19 Billion by 2035. Expanding animal feed mills and bioprocessing facilities in emerging markets are accelerating demand for grain elevators that can handle higher volumes with minimal labor dependence.
A major development shaping the global market came in September 2023, when AFN) (AGI) expanded its manufacturing capacity at their India-based AGI Bengaluru facilities to accommodate production of its flagship AGI Westfield and AGI brands, built to automate loadout, detect spoilage risk, and optimize bin logistics in real time. The upgrade directly influences farmer margins, export reliability, and inventory turnover for trading houses. It also shows how elevators have become operational profit centers powered by automation and near-continuous data, thereby redefining the grain elevator market dynamics.
Market growth is also widely supported by grain trading companies, ethanol producers, livestock integrators, and logistics players who want faster output, safer grain movement, and transparent traceability. Many elevator owners are pushing digital retrofits rather than full replacements because downtime during harvest is simply not an option. In October 2024, ADM announced that it has implemented Digital Grain Elevator's FOB Ag Logistics Platform at a significant number of United States grain origination locations, resulting in wider grain elevator market expansion. Engineering firms are now designing modular smart legs, variable-speed conveyors, AI-based aeration systems, and multi-sensor hazard detection for bearings, belts, and dust ignition points.
Compound Annual Growth Rate
4.7%
Value in USD Billion
2026-2035
Bunge Global SA completed its purchase of the grain elevator assets from North West Terminal Ltd. (NWT) close to Unity, Saskatchewan, further enhancing its presence in the grain-handling industry of Western Canada. This strengthens Bunge’s origination footprint in Western Canada, increasing control over supply flows and boosting throughput capacity across its export chain.
AgroPlus 2006 established a new grain elevator complex and feed mill in the Cherkasy region with assistance from the USAID AGRO Ukraine initiative. The project adds modern storage and processing capacity in a key region, supporting stable flow and post-harvest quality for both domestic and export buyers.
Viserion Grain purchased four grain elevator properties from Greenfield Grain LLC. The properties are situated in Parkdale, Arkansas, and in Dunn, Crowville, and Lake Providence, Louisiana, in the United States. This grain elevator market development unlocks multi-site aggregation power and better rail access for downstream commercial clients.
Viterra declared its plan to construct a grain facility in Dalhart, United States, and enhance its offerings for customers in West Texas, United States. The upgraded facility will feature a cutting-edge grain handling system and loop track serviced by Union Pacific Railroad's 32,000-mile network. The high-tech elevator with loop track enhances output speed and rail connectivity, securing long-term origination and service reliability for West Texas farmers and mills.
Off-farm storage capacity is expanding far too slowly compared with rising grain production, turning elevators into critical chokepoints. This strain is translating directly into demand for high-output elevator projects, faster loadout legs, and more advanced blending systems that can cut wait times and accelerate rail turnaround, reshaping the grain elevator market dynamics. In December 2024, G3 announced plans to build two new grain elevators in Alberta and Saskatchewan.
Investment in rail and port connected grain elevators is another growth engine, because traders and co-ops want to lock in export optionality. CHS and MKC are building a 5.2 million bushel shuttle terminal in Kansas, designed for rapid train loading. Cargill and CHS expanded their TEMCO joint venture by adding a Houston export terminal that can handle millions of tons annually, impacting the overall grain elevator market growth. In July 2025, G3 announced it opened a new grain export terminal at the Port of Vancouver on Canada's West Coast and new grain elevators in Alberta. These projects reward operators that design elevators around train speed, vessel windows, and container transloading flexibility, serving demanding global buyers.
Digital and IoT enabled grain elevators are gathering significant momentum in the market. Vendors now offer sensor cables that constantly monitor temperature and moisture along the grain column. Startups and integrators are building smart elevator platforms that stream readings into dashboards and link to automated fans, conveyors, and hazard alarms, boosting grain elevator market opportunities. In November 2024, Veea Inc. partnered with Mainstream Fiber Networks, Microclimates Inc., and AmeriCrew LLC to deploy Climate Smart Agriculture solutions at Cyr Farm in Fowler, Indiana, United States. Elevators that prove tight loss control, quality consistency, and lower energy use over time can negotiate better margins with global traders and processors.
Safety regulation around combustible grain dust continues to push elevator upgrades and new buildings. OSHA enforcement around combustible dust programs, along with NFPA 61 standards for agricultural facilities, keeps pressure on operators that still run older houses. Many insurers now question about housekeeping, explosion venting, and monitoring systems before underwriting capacity. Modern grain elevators therefore use better dust collection, continuous bearing temperature sensing, and improved electrical classification to reduce ignition risk, influencing the grain elevator market value. Operators that can document strong safety performance gain benefits like fewer shutdowns and better standing with regulators, auditors, and local communities.
Consolidation among global grain traders is another important trend because merged companies usually rationalize and upgrade elevator networks. Canada’s conditional approval of the Bunge Viterra deal requires divestment of several Western Canada elevators and fresh capital commitments from regulators, which will reshape local assets. In November 2025, Egypt announced its expansion of wheat storage capacity with 50 new grain elevators across 17 governorates. At the same time, companies like G3 and Richardson have been investing in high output elevators and a modern Vancouver terminal to handle faster trains and vessels, widening the grain elevator market scope. New Canadian container transloading facilities also let inland elevators reach niche export buyers. For elevator owners, alignment with the right trader group can unlock long term volume and modernization budgets.
Read more about this report - REQUEST FREE SAMPLE COPY IN PDF
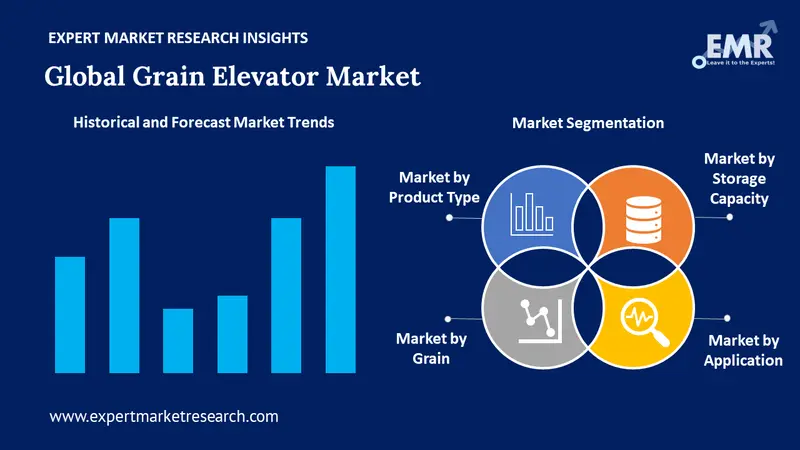
The EMR’s report titled “Global Grain Elevator Market Report and Forecast 2026-2035” offers a detailed analysis of the market based on the following segments:
Market Breakup by Product Type
Key Insight: Most of the grain elevator buyers match their product structure to their merchandising strategy and local constraints. Flat bottom designs suit big origin hubs and plants that need deep, flexible storage linked to rail or barge. Hopper bottom units appeal to operators that value faster clean-out, safer access, and careful segregation of premium or identity preserved lots, boosting the grain elevator market growth. Conical and other niche designs are often required in seed, research, or smaller industrial sites, where footprint, permitting, or process integration drive design choices.
Market Breakup by Storage Capacity
Key Insight: Smaller sites up to 50,000 tons often support local collection, niche contracts, or feed production where speed matters more than deep carry. In April 2023, G3 announced the launch of G3 Rycroft that has a capacity of 42,000 tons, high-capacity grain receiving that can unload a Super-B truck in less than five minutes, accelerating the overall grain elevator market penetration. Mid-capacity elevators bridge farm gates and processing or export nodes, giving co-ops and traders enough volume to negotiate. Large installations concentrate flows for railroads and vessels.
Market Breakup by Grain
Key Insight: Maize and other coarse grains anchor volumes across feed, fuel, and export programs, so they shape core design decisions. Wheat flows demand careful protein and quality management, which strengthens the case for good sampling and blending systems. Rice, pulses, and oilseeds call for gentler handling and tighter segregation where identity and brand value matter, creating grain elevator market opportunities. Operators that can adjust flows between these streams more smoothly gain higher profit margins.
Market Breakup by Application
Key Insight: Across all the applications considered in the grain elevator market report, residential-scale use is limited, mostly crowded with small on-farm or estate units that behave more like storage insurance. Commercial elevators, by contrast, form a key growth motivator boosting trade, serving farmers, processors, and exporters. In practice, operators calibrate investment and risk management to the opportunities within each application area, ensuring capital deployment aligns with the needs of their core downstream customers.
Market Breakup by Region
Key Insight: Demand in the grain elevator market across various regions mirrors climate, infrastructure maturity, and trade orientation. North America operates dense, rail-linked networks that feed domestic users and export corridors. Europe focuses on compliance, traceability, and integration with port and feed assets. Asia Pacific leans toward growth and modernization, converting basic sheds into engineered multi-bin sites. Latin America emphasizes export flows and proximity to new crushing and processing plants, while the Middle East and Africa concentrate on food security reserves.
Read more about this report - REQUEST FREE SAMPLE COPY IN PDF
By product type, flat bottom elevators dominate the market, supported by bulk export and terminal throughput
Flat bottom grain elevators hold the dominant share because they fit large export terminals, inland hubs, and integrated processing sites that want deep, low-cost storage under one roof. Operators prefer this product category for automated reclaim, blending, and conditioning, especially when they run multiple legs into rail or barge. In January 2022, Richardson Pioneer Limited announced plans to build a new high throughput grain elevator in Carmichael, Saskatchewan, located 65 km west of Swift Current, propelling the grain elevator market revenue growth.
Hopper bottom grain elevators emerge as the fastest growing product type as operators seek cleaner handling and lower labor dependence. The cone design lets grain flow out by gravity, which reduces sweep auger use and time spent entering bins. This appeals to safety managers, who want fewer confined-space entries and lower exposure to residue dust. Hopper bottoms also align well with the requirements of smaller, multi-bin sites serving pulse, seed, and specialty grain contracts.
By storage capacity, mid-capacity grain elevators (51,000–150,000 Tons) account for the largest market share, balancing capex, flexibility, throughput, and risk
Elevators in the 51,000–150,000 tons range dominate the market because they fit the scale of most commercial co-ops, regional traders, and rail-connected country terminals. This capacity category gives enough room for multi-crop rotation, carry strategies, and basic blending. Operators can justify stronger automation, dust control, and sampling systems when volumes reach this level.
As per the grain elevator market report, elevators in the 151,000–300,000 tons bracket register as the fastest growing capacity segment as export terminals and shuttle hubs demand higher train velocity. Designers focus on dual receiving pits, high-capacity legs, and reclaim paths that keep trains moving. Traders also prefer the ability to stage multiple vessel or mill programs from one site.
By grain, maize and coarse grain, driving continuous elevator utilization globally, registers substantial share of the market
Maize and coarse grains dominate the current market dynamics because they flow through nearly every part of the modern agri-food chain, from feed mills and ethanol plants to export terminals. Elevators that handle these crops must cope with high seasonal peaks and heavy truck and rail traffic. Managers prioritize fast receiving, robust drying, and consistent blending so downstream users can run stable rations.
Rice is emerging as one of the fastest growing categories boosting growth in the grain elevator market, especially powered by Asia and parts of Africa where mills and exporters move away from simple warehouse storage. Modern rice elevators manage delicate kernels, strict quality specifications, and separate streams for different grades and brands. Operators also focus on gentle handling, controlled aeration, and traceability.
Commercial grain elevators dominate the market, anchoring trading, logistics, and processing networks
Commercial grain elevators dominate application share, driven by farmers, processors, and global traders. These assets move high volumes and negotiate complex contracts, so operators invest heavily in automation, safety, and merchandising tools. Many sites are tied directly to rail lines, ports, feed plants, or ethanol facilities, where downtime quickly becomes costly. In October 2025, Ag Growth International (AGI) introduced two new diesel-powered grain handling tools. The STX3 auger and UCX4 conveyor are additions to the company’s portable grain handling lineup. Commercial managers use their elevators as engines for origination, offering drying, conditioning, and risk management services to local growers.
Residential grain elevators are now becoming the fastest-growing application in the grain elevator market dynamics, mainly because mid-sized farms and estate operations are shifting toward greater self-reliance rather than depending totally on commercial storage. Farmers storing grain at home want more control over timing of sales, especially when market swings make price-timing crucial.


North America occupies the leading market position, combining dense elevator networks and export infrastructure
North America holds the dominant regional share in the grain elevator market because it combines vast crop output with mature rail, barge, and export infrastructure. Country elevators, shuttle terminals, and port houses form an intricate chain that supports domestic feed, fuel, and food industries as well as large export programs. Operators face strong competition for origination, so they use elevators as service platforms, offering drying, risk management, and logistics planning to farmers.
Growth of the grain elevator market in Asia Pacific is propelled by governments, traders, and food companies that modernize silos and storage to cut post-harvest losses and stabilize supplies. Many countries are replacing informal warehouses with engineered elevators tied to mills, ports, and inland logistics hubs. Urbanization and dietary shifts increase demand for packaged rice, wheat flour, and animal protein, which depends on reliable grain handling.
The market currently boasts lucrative opportunities for regional engineering firms, global system integrators and trading houses that treat storage as a strategic asset. Grain elevator market players are moving beyond basic silo supply into end to end projects that bundle design, construction, controls and lifecycle service.
Digitalization is a clear focus area. Owners want remote monitoring, predictive maintenance and traceable quality data that they can share with lenders and downstream buyers. Safety and sustainability open further opportunities, from dust explosion prevention upgrades to lower energy aeration systems. For grain elevator companies able to finance projects creatively, there is growing demand in Brazil, Eastern Europe and Asia for mid-sized elevators linked to rail, river or port infrastructure. Customers based in these regions expect partners who can deliver repeatable layouts as per local grain mixes, climate and regulatory requirements.
Allied Grain Systems, established in 2004 and headquartered in Australia, focuses on turnkey grain handling projects rather than just selling silos. The company designs and builds flat bottom and hopper bottom elevators, plus integrated conveying lines, cleaners and processing modules for Australian growers and maltsters.
AGI Brasil, founded in 1996 and headquartered in Cândido Mota, Brazil, manufactures grain bins, bucket elevators, dryers and cleaners for Brazilian commercial operators. It positions itself as a systems supplier, combining local fabrication with AGI’s global controls, sensing and engineering expertise.
Zen-Noh Grain Corporation, founded in 1979 and headquartered in Covington, Louisiana, operates export elevators on the Mississippi River that secure grain and oilseed flows for Japanese feed mills. The company focuses on reliable high volume loading, strict quality control and traceability back to United States growers.
JV Dan, a Kazakhstan-based joint venture established in 1993, links local grain producers with global buyers through elevators, logistics and export services. Headquartered in Almaty, the company owns and operates licensed elevators such as Odak and Ak Biday, each with on site laboratories and packing capabilities.
*Please note that this is only a partial list; the complete list of key players is available in the full report. Additionally, the list of key players can be customized to better suit your needs.*
Other key players in the market include T&S Sales, Bunge North America, Wuhan Wobota Machinery Co Lyd, Yanmar Group, SMIC, Guangzhou Xianyi, Shanghai Huaqing, Harris Products, and Axend PTE Ltd, among others.
Unlock the latest insights with our grain elevator market trends 2026 report. Discover regional growth patterns, consumer preferences, and key industry players. Stay ahead of competition with trusted data and expert analysis. Download your free sample report today and drive informed decisions in the market.
Upto 15% Off
USD
$4399 $3959
$2999 $2699
$5599 $4759
$6659 $5660


*While we strive to always give you current and accurate information, the numbers depicted on the website are indicative and may differ from the actual numbers in the main report. At Expert Market Research, we aim to bring you the latest insights and trends in the market. Using our analyses and forecasts, stakeholders can understand the market dynamics, navigate challenges, and capitalize on opportunities to make data-driven strategic decisions.*
The market is projected to grow at a CAGR of 4.70% between 2026 and 2035.
Companies face volatile margins, steel and energy costs, safety compliance, financing gaps in emerging markets, climate driven volume swings and pressure to digitalize legacy elevators without disrupting harvest operations severely.
The key trends in the market include the rising demand for food grains in the commercial and household sectors and increasing investments aimed towards expanding food grain facilities.
Flat bottom, hopper bottom, and conical, among others, are the different product types included in the grain elevator market report.
The various storage capacities of grain elevators in the market are up to 50,000 tonnes, 51,000 - 150,000 tonnes, and 151,000 - 300,000 tonnes, among others.
Rice, wheat, pulses, oil seeds, and maize and coarse grain, among others, are the different grains in the market.
Residential, and commercial, among others, are the major applications of grain elevators in the market.
A grain elevator contains an internal combustion engine and sets of conveyer belts to help in the movement of grains.
Grain elevators are commonly made from concrete or steel, depending upon the product type and side pressure.
The key players in the market include Allied Grain Systems, AGI Brasil, Zen-Noh Grain Corp, JV Dan, T&S Sales, Bunge North America, Wuhan Wobota Machinery Co Lyd, Yanmar Group, SMIC, Guangzhou Xianyi, Shanghai Huaqing, Harris Products, and Axend PTE Ltd, among others.
In 2025, the market reached an approximate value of USD 21.60 Billion.
Stakeholders are standardizing modular elevator designs, partnering with financiers, upgrading automation and safety, integrating sensors into trading platforms and building regional service teams to keep assets reliable and profitable longer.
Explore our key highlights of the report and gain a concise overview of key findings, trends, and actionable insights that will empower your strategic decisions.
| REPORT FEATURES | DETAILS |
| Base Year | 2025 |
| Historical Period | 2019-2025 |
| Forecast Period | 2026-2035 |
| Scope of the Report |
Historical and Forecast Trends, Industry Drivers and Constraints, Historical and Forecast Market Analysis by Segment:
|
| Breakup by Product Type |
|
| Breakup by Storage Capacity |
|
| Breakup by Grain |
|
| Breakup by Application |
|
| Breakup by Region |
|
| Market Dynamics |
|
| Competitive Landscape |
|
| Companies Covered |
|
Single User License
One User
USD 4,399
USD 3,959
tax inclusive*
Datasheet
One User
USD 2,999
USD 2,699
tax inclusive*
Five User License
Five User
USD 5,599
USD 4,759
tax inclusive*
Corporate License
Unlimited Users
USD 6,659
USD 5,660
tax inclusive*
*Please note that the prices mentioned below are starting prices for each bundle type. Kindly contact our team for further details.*
Flash Bundle
Small Business Bundle
Growth Bundle
Enterprise Bundle
*Please note that the prices mentioned below are starting prices for each bundle type. Kindly contact our team for further details.*
Flash Bundle
Number of Reports: 3
20%
tax inclusive*
Small Business Bundle
Number of Reports: 5
25%
tax inclusive*
Growth Bundle
Number of Reports: 8
30%
tax inclusive*
Enterprise Bundle
Number of Reports: 10
35%
tax inclusive*
How To Order

Select License Type
Choose the right license for your needs and access rights.

Click on ‘Buy Now’
Add the report to your cart with one click and proceed to register.

Select Mode of Payment
Choose a payment option for a secure checkout. You will be redirected accordingly.
Strategic Solutions for Informed Decision-Making
Gain insights to stay ahead and seize opportunities.

Get insights & trends for a competitive edge.

Track prices with detailed trend reports.

Analyse trade data for supply chain insights.

Leverage cost reports for smart savings

Enhance supply chain with partnerships.

Connect For More Information
Our expert team of analysts will offer full support and resolve any queries regarding the report, before and after the purchase.
Our expert team of analysts will offer full support and resolve any queries regarding the report, before and after the purchase.
We employ meticulous research methods, blending advanced analytics and expert insights to deliver accurate, actionable industry intelligence, staying ahead of competitors.
Our skilled analysts offer unparalleled competitive advantage with detailed insights on current and emerging markets, ensuring your strategic edge.
We offer an in-depth yet simplified presentation of industry insights and analysis to meet your specific requirements effectively.


