

Consumer Insights
Uncover trends and behaviors shaping consumer choices today
Procurement Insights
Optimize your sourcing strategy with key market data
Industry Stats
Stay ahead with the latest trends and market analysis.
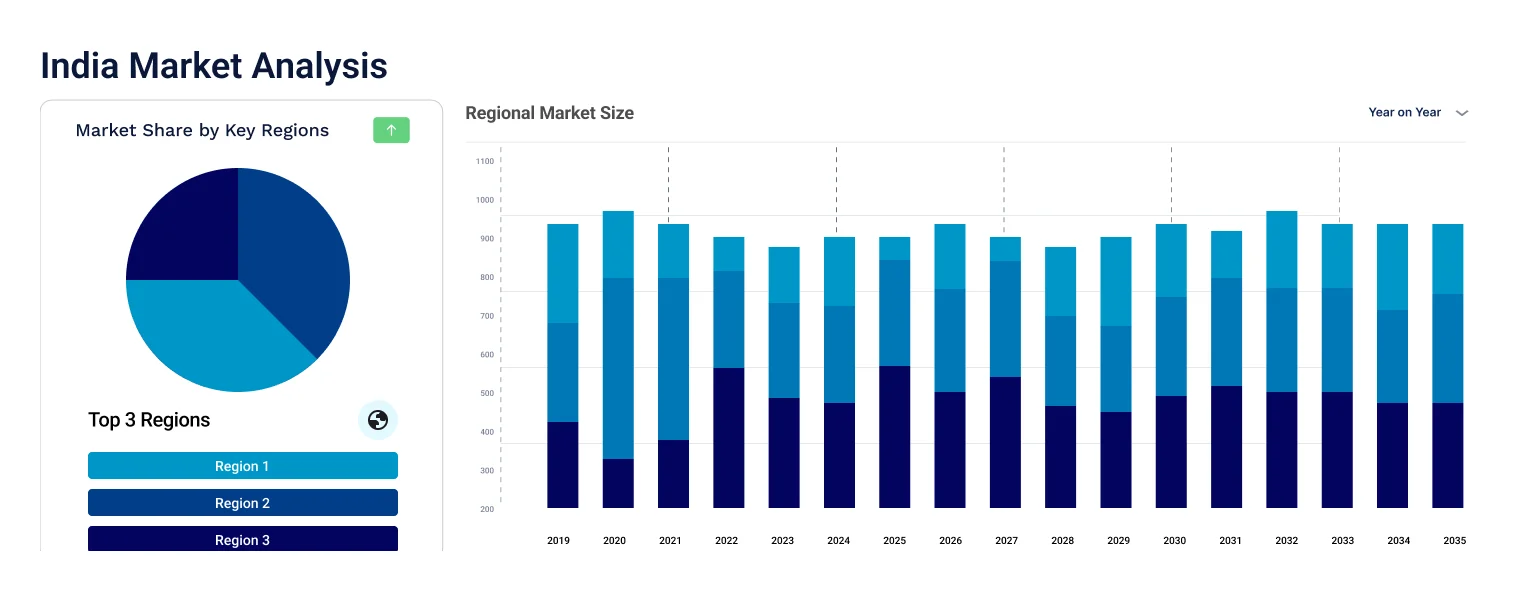
The India gas valve market attained a value of USD 351.89 Million in 2025 and is projected to expand at a CAGR of around 5.60% through 2035. The government's initiative to increase CGD coverage to more than 600 districts along with private funding in oil & gas infrastructure, like Indian Oil's pipeline expansion plans and ONGC's upgradation of refineries, strengthens the demand outlook for durable and technologically advanced gas valves. Furthermore, the integration of smart valve systems in urban gas supply along with digital India initiatives introduces a future-proof growth dimension to the market. This further helps in accelerating the industry to reach a value of USD 606.80 Million by 2035.
The India gas valve market is picking up strong momentum as a result of the nation's surging energy infrastructure, increasing natural gas usage, and growth in city gas distribution (CGD) networks. Gas valves, which are fundamental for modulating and regulating the passage of gas through residential, commercial, and industrial use, are vital in ensuring safety and efficiency. India's increasing focus on clean energy, especially natural gas, is driving demand for gas valve solutions.
Government-sponsored projects such as the "One Nation One Gas Grid" and the growth of CGD networks by businesses such as Adani Total Gas and GAIL are highly driving installations of gas valves. Moreover, growth in industrial automation and higher investments in petrochemical and refinery businesses are inducing technological developments in valve systems, such as smart and remote-operated gas valves. The boom in construction activities, expansion of smart cities, and regulatory norms for safety are also fueling India gas valve market growth.
India's strategic drive to raise the proportion of natural gas in its energy basket to 15% by 2030, from a current level of about 6%, will significantly increase the scope of the gas valve market in the decade ahead.
Compound Annual Growth Rate
5.6%
Value in USD Million
2026-2035
| India Gas Valve Market Report Summary |
Description |
Value |
|
Base Year |
USD Million |
2025 |
|
Historical Period |
USD Million |
2019-2025 |
|
Forecast Period |
USD Million |
2026-2035 |
|
Market Size 2025 |
USD Million |
351.89 |
|
Market Size 2035 |
USD Million |
606.80 |
|
CAGR 2019-2025 |
Percentage |
XX% |
|
CAGR 2026-2035 |
Percentage |
5.60% |
|
CAGR 2026-2035- Market by Region |
East India |
6.2% |
|
CAGR 2026-2035 - Market by Region |
West India |
5.9% |
|
CAGR 2026-2035 - Market by Valve |
Control Valve |
6.4% |
| 2025 Market Share by Region | South India |
31.3% |
L&T Valves introduced a new range of smart actuator control valves for the advanced digital automation of Indian refineries. The valves improve accuracy, dependability, and efficiency in mission-critical gas processing operations.
Emerson Electric expanded its valve manufacturing facility in Maharashtra, India. This strategic move aims to boost production of smart gas flow control solutions to meet rising domestic demand across CGD and industrial gas sectors.
Tekno Valves entered a partnership with Indian Oil to supply high-integrity cylinder valves for gas filling stations across Eastern India, enhancing safety and reliability in the region’s pressurized gas distribution infrastructure.
Novel Valves introduced triple-offset butterfly valves with zero-leakage technology, designed specifically for city gas distribution (CGD) networks in tier-2 cities, aligned with India's clean energy access and pipeline growth programs.
India's City Gas Distribution (CGD) industry is experiencing significant growth with Indraprastha Gas and Gujarat Gas expanding their distribution reach in tier 1 and tier 2 cities. Expansion is being enabled by the Petroleum and Natural Gas Regulatory Board (PNGRB) by auctioning new CGD licenses. More than 60 new geographical areas were given in 2024, which is enhancing infrastructure development. These technologies require large-scale deployment of gas valves for flow control and safety needs, contributing immensely to market growth, thus promoting the India gas valve market development.
Indian industries are increasingly incorporating automation technologies, creating a demand for smart and automated gas valve systems. Reliance Industries commenced the integration of IoT-enabled valves in its petrochemical operations to remotely monitor gas flow in 2024. This trend improves efficiency and minimizes leakage hazards. Utilities digitalization is encouraging demand for sensor-enabled valves with data logging capabilities, further aiding market penetration among industrial consumers.
India is aimed at raising the proportion of natural gas in the country's energy basket to 15% by 2030. To reach this goal, infrastructure investments in pipelines such as Urja Ganga and the North-East Gas Grid are being heavily invested in. As more areas are added to the gas grid, demand will increase for reliable gas flow control devices like ball and control valves. These government policies play an important role in influencing long-run gas valve demand., thus shaping new trends in the India gas valve market.
The government-led Smart Cities Mission is driving the need for advanced utility systems such as smart gas distribution networks. As cities develop with modern infrastructure, the need for high-accuracy, electronically actuated gas valves has grown. Pune and Hyderabad cities have spearheaded smart metering and valve control systems in 2024, reflecting increasing demand for smart energy solutions. The trends foretell heightened demand for technology-advanced gas valves in city utilities.
India is increasing its refining capacity with schemes such as Indian Oil's 25 MMTPA Paradip refinery and HPCL's Barmer Refinery, which are scheduled to be operational by 2027. Such projects need high-performance valve systems to handle high-pressure gas flows, hence it is a critical end-use segment. In 2025, L&T Valves secured significant orders for high-performance gas valves for these schemes, showing the intimate correlation between refining industry investments and valve demand.
The EMR’s report titled “India Gas Valve Market Report and Forecast 2026-2035” offers a detailed analysis of the market based on the following segments:
Market Breakup by Valve Type
Key Insight: Ball valves dominate the India gas valve market, driven by their extensive use in city gas distribution (CGD), industrial networks, and domestic gas pipelines. They have a strong construction, excellent pressure withstandance, and tight shut-off properties, making them the best fit for various gas flow control requirements. The government's aggressive roll-out of PNG, reaching 100 million households by 2030, drives India gas valve demand further. Additionally, ball valves' low maintenance and ease of use make them increasingly popular among end-users. As the demand for industrial gases is rising, along with growing CGD infrastructure, ball valves are likely to continue their dominance in the near future.
Market Breakup by Region
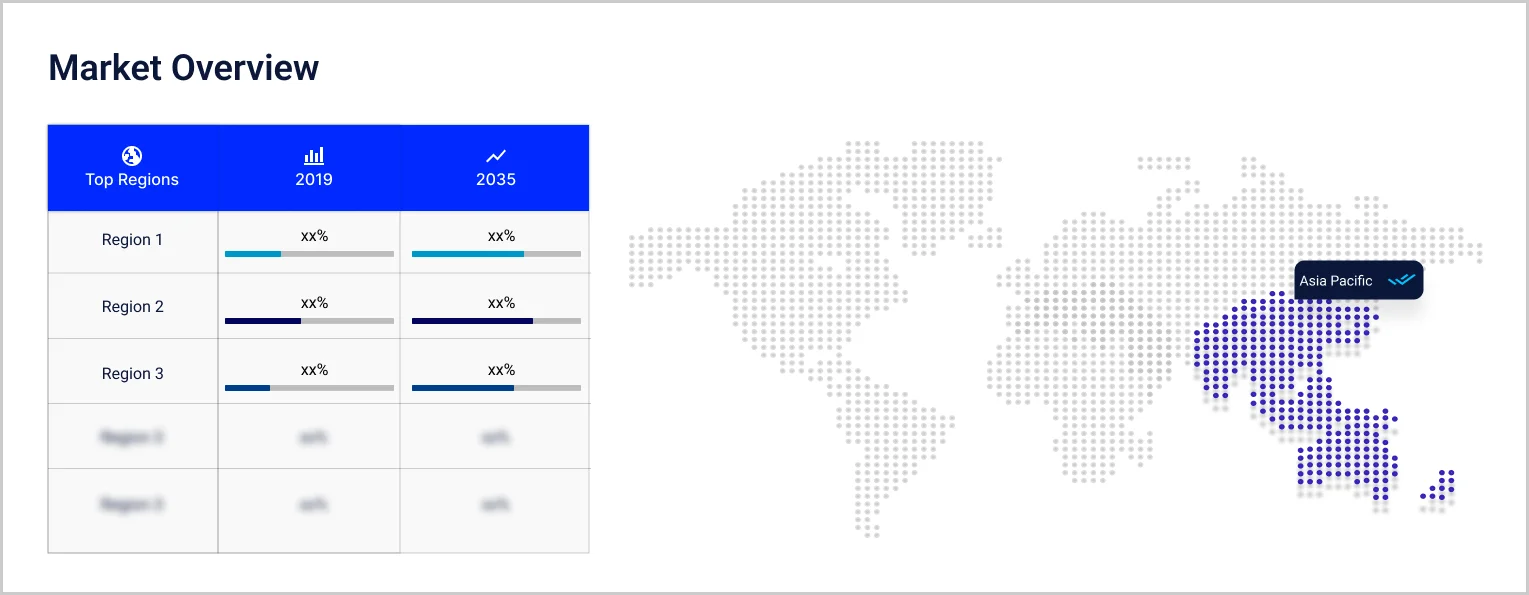
Key Insight: North India maintains the leading share in the India gas valve market on account of its established CGD network, early PNG penetration, and concentrated urban population base. Major cities such as Delhi and Noida have strong residential and business gas networks, with continuous valve demand, particularly of ball and butterfly variants. Industrial centers such as Panipat and Mathura also contribute through refinery-led demand. Moreover, the jurisdiction of key CGD players like Indraprastha Gas and GAIL fortifies regional progress. North India's dominance in India's transformational gas infrastructure environment also becomes stronger with government clean fuel programs.
|
CAGR 2026-2035 - Market by |
Region |
| East India |
6.2% |
| West India |
5.9% |
| South India |
XX% |
| North India |
XX% |
Ball valves lead due to durability, CGD expansion, and wide industrial use.
Ball valves are the dominant valve type in the Indian gas valve market because of their extensive applications in CGD, industrial gas grid, and domestic sectors. According to India gas valve market analysis, their high reliability, pressure management, and tightness in cut-off make them unbeatable, particularly in the wake of the government's initiative to bring piped natural gas to 100 million households by 2030. Robust demand from refineries, chemical plants, and gas meter installations guarantees their leadership position. Furthermore, technological advancements in corrosion-resistant and stainless-steel versions additionally accelerate their uptake. With CGD growth, ball valves continue to be the biggest and most critical valve category in Indian gas infrastructure.
Control valves grow rapidly with automation, AI, and Industry 4.0 integration.
Control valves are the most rapidly growing Indian gas valve market segment due to the aggressive uptake of automation and Industry 4.0 solutions. As per India gas valve industry analysis, their incorporation in SCADA systems and intelligent infrastructure makes real-time monitoring, energy efficiency, and predictive maintenance more efficient. Increased application in petrochemical facilities, gas metering plants, and refineries, particularly those that are embracing AI and IoT, has fueled this segment's growth. Emerson's introduction of AI-capable control valves in 2025 highlighted the emerging trend. As India fosters increased operational efficiency and automation in its gas facilities, the control valve market is likely to see sustained strong growth.
North India leads, while East, Central, and South regions show rapid gas valve growth.
North India dominates the India gas valve industry, backed by its well-established CGD infrastructure, strong urban population density, and early PNG penetration. Towns like Delhi and Noida have well-developed residential and commercial gas networks, which generate steady demand for high-quality, corrosion-resistant ball and butterfly valves. Additionally, Panipat and Mathura refinery hubs drive industrial valve adoption. Government programs such as the National Capital Region's shift to clean fuel further spur demand. Having major CGD players such as GAIL and Indraprastha Gas, North India secures the leading market position.
As per India gas valve market analysis, markets like East and Central India are set for growth acceleration, driven by fresh gas pipeline projects and CGD rounds of licensing. Bihar and Odisha are getting more government investment in the Urja Ganga scheme, which is increasing the availability of PNG and industrial gas. Likewise, South India is experiencing rapid infrastructure upgrade with valve automation and smart metering adoption taking off in Bengaluru and Chennai. All this is making these regions strong growth drivers with more valve manufacturers and suppliers making new inroads to take advantage of changing infrastructure.
The India gas valve market is highly competitive with domestic as well as international players competing in terms of technology, quality, and customization. Key India gas valve market players are emphasizing innovation, strategic partnerships, and automation to gain market share. Smart valve solutions with Internet of Things capabilities are becoming the priority to address increasing demand from digitally evolving industries. Firms are also investing in corrosion-resistant and long-duration materials to cater to varied climatic and operation conditions in India. Significant India gas valve companies such as L&T Valves, Emerson Electric, and Tekno Valves are presenting overarching portfolios to meet the requirements of CGD, petrochemicals, and refining segments. Alignment with EPC contractors and bidding in public infrastructure tenders assists players to establish their market position. Product differentiation through adherence to international safety regulations and flexibility to Indian infrastructure is a dominant strategic line. The increasing emphasis on local production, in line with the Make in India initiative, is also boosting domestic competitiveness and curbing import dependence.
Formed in 1971, having its headquarters in Kolkata, Tekno Valves provides industrial and specialty gas application cylinder valves of high performance, used extensively in CGD and gas storage industries.
Established in 1890, having its headquarters in the United States, Emerson offers sophisticated gas valve solutions such as control and pressure relief valves customized to suit refinery and process industries in India.
Founded in 1961, headquartered in Chennai, L&T Valves produces a comprehensive selection of oil, gas, and infrastructure project valves, including high-integrity ball and gate valves.
Founded in 2008 and headquartered in Pune, Novel Valves produces industrial-grade gas valves such as globe, check, and butterfly valves for process plant and pipeline applications
*Please note that this is only a partial list; the complete list of key players is available in the full report. Additionally, the list of key players can be customized to better suit your needs.*
Other key players in the report include Rache Process Equipment LLP, Oswal Industries Limited, Samson Controls Pvt. Ltd., among others.
Explore the latest trends shaping the India Gas Valve Market 2026-2035 with our in-depth report. Gain strategic insights, future forecasts, and key market developments that can help you stay competitive. Download a free sample report or contact our team for customized consultation on India Gas Valve Market trends 2026.
Upto 15% Off
USD
$2499 $2249
$3999 $3599
$4999 $4249
$5999 $5099


*While we strive to always give you current and accurate information, the numbers depicted on the website are indicative and may differ from the actual numbers in the main report. At Expert Market Research, we aim to bring you the latest insights and trends in the market. Using our analyses and forecasts, stakeholders can understand the market dynamics, navigate challenges, and capitalize on opportunities to make data-driven strategic decisions.*
In 2025, the India gas valve market reached an approximate value of USD 351.89 Million.
The market is projected to grow at a CAGR of 5.60% between 2026 and 2035.
The key players in the market includes Tekno Valves, Emerson Electric Co., L&T Valves Limited, Novel Valves India Pvt. Ltd, Rache Process Equipment LLP, Oswal Industries Limited, Samson Controls Pvt. Ltd., among others.
The lithium iron phosphate battery type is gaining traction and anticipated to expand with a 15.1% CAGR through 2035.
Key strategies involve intelligent valve technologies, growing LNG infrastructure, financing clean energy projects, growing industrial uses, improving compliance with safety, and prioritizing rural piped gas distribution to drive market penetration.
Explore our key highlights of the report and gain a concise overview of key findings, trends, and actionable insights that will empower your strategic decisions.
| REPORT FEATURES | DETAILS |
| Base Year | 2025 |
| Historical Period | 2019-2025 |
| Forecast Period | 2026-2035 |
| Scope of the Report |
Historical and Forecast Trends, Industry Drivers and Constraints, Historical and Forecast Market Analysis by Segment:
|
| Breakup by Valve |
|
| Breakup by Region |
|
| Market Dynamics |
|
| Competitive Landscape |
|
| Companies Covered |
|
Datasheet
One User
USD 2,499
USD 2,249
tax inclusive*
Single User License
One User
USD 3,999
USD 3,599
tax inclusive*
Five User License
Five User
USD 4,999
USD 4,249
tax inclusive*
Corporate License
Unlimited Users
USD 5,999
USD 5,099
tax inclusive*
*Please note that the prices mentioned below are starting prices for each bundle type. Kindly contact our team for further details.*
Flash Bundle
Small Business Bundle
Growth Bundle
Enterprise Bundle
*Please note that the prices mentioned below are starting prices for each bundle type. Kindly contact our team for further details.*
Flash Bundle
Number of Reports: 3
20%
tax inclusive*
Small Business Bundle
Number of Reports: 5
25%
tax inclusive*
Growth Bundle
Number of Reports: 8
30%
tax inclusive*
Enterprise Bundle
Number of Reports: 10
35%
tax inclusive*
How To Order

Select License Type
Choose the right license for your needs and access rights.

Click on ‘Buy Now’
Add the report to your cart with one click and proceed to register.

Select Mode of Payment
Choose a payment option for a secure checkout. You will be redirected accordingly.
Strategic Solutions for Informed Decision-Making
Gain insights to stay ahead and seize opportunities.

Get insights & trends for a competitive edge.

Track prices with detailed trend reports.

Analyse trade data for supply chain insights.

Leverage cost reports for smart savings

Enhance supply chain with partnerships.

Connect For More Information
Our expert team of analysts will offer full support and resolve any queries regarding the report, before and after the purchase.
Our expert team of analysts will offer full support and resolve any queries regarding the report, before and after the purchase.
We employ meticulous research methods, blending advanced analytics and expert insights to deliver accurate, actionable industry intelligence, staying ahead of competitors.
Our skilled analysts offer unparalleled competitive advantage with detailed insights on current and emerging markets, ensuring your strategic edge.
We offer an in-depth yet simplified presentation of industry insights and analysis to meet your specific requirements effectively.


