Sale

Indian Feed Additives Market

Indian Feed Additives Market Size, Share, Growth, Trends: By Source: Synthetic, Natural; By Product Type: Amino Acids, Phosphates, Vitamins, Acidifiers, Carotenoids, Enzymes, Mycotoxin Detoxifiers, Flavours and Sweeteners, Antibiotics, Minerals, Antioxidants, Others; By Livestock; By Form; Regional Analysis; Competitive Landscape; 2024-2032

Indian Feed Additives Market Outlook

The Indian feed additives market has been witnessing significant growth and is likely to witness a healthy growth in the forecast period as well. The Indian feed additives market is expected to grow at a CAGR of 7% in the forecast period of 2024-2032.


The massive population of the country is a significant driver for the feed additives market in India. With a population of more than 1.38 billion, India is the second-largest populous country in the world after China. By 2030, the population of India is expected to reach beyond 1.5 billion. This is likely to generate a strong demand for food, increasing the consumption of animal-derived products, including milk, meat, eggs, seafood, and others.


Indian Feed Additives Market

Read more about this report - REQUEST FREE SAMPLE COPY IN PDF


Market Segmentation

Feed additives refer to dietary supplements used in animal feeding to enhance the quality and nutritional value of animal products, including milk, meat, eggs, and other animal products. Feed additives mainly consist of amino acids, minerals, vitamins, and fatty acids, which are essential for the well-being of the animal. They also improve the digestibility, as well as the overall health of the animal, by ensuring the optimum absorption of nutrients.

On the basis of source, the Indian feed additives market can be divided into the following:

  • Synthetic  
  • Natural 

Based on product type, the market can be segmented into the following:

  • Amino AcidsPhosphates
  • Vitamins
  • Acidifiers
  • Carotenoids
  • Enzymes 
  • Mycotoxin Detoxifiers  
  • Flavours and Sweeteners  
  • Antibiotics  
  • Minerals 
  • Antioxidants  
  • Non-Protein Nitrogen  
  • Preservatives   
  • Phytogenic   
  • Probiotics   

On the basis of livestock, the market can be divided as follows:

  • Ruminants
    • Calves
    • Dairy Cattle
    • Beef Cattle
    • Others
  • Poultry 
    • Broilers
    • Layers
    • Breeders
  • Swine 
    • Starters
    • Growers
    • Sows
  • Aquatic Animal  
  • Others 

Based on form, the industry can be divided into dry and liquid.

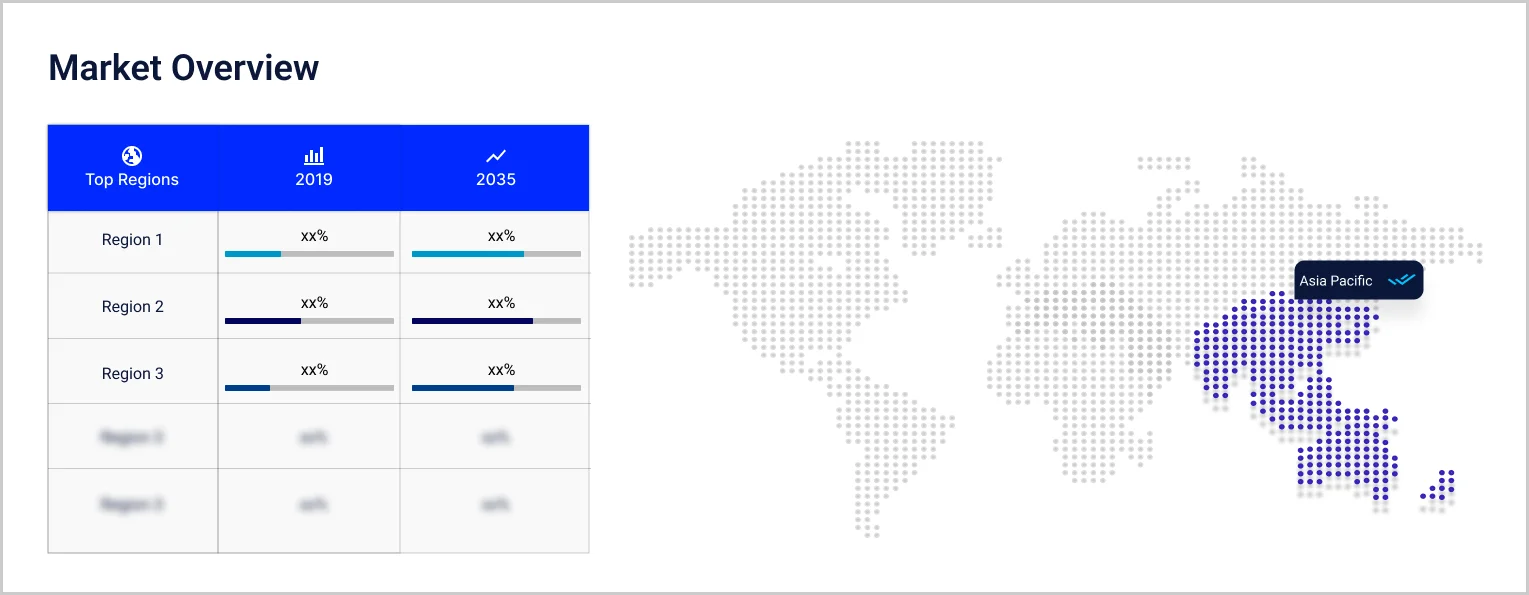
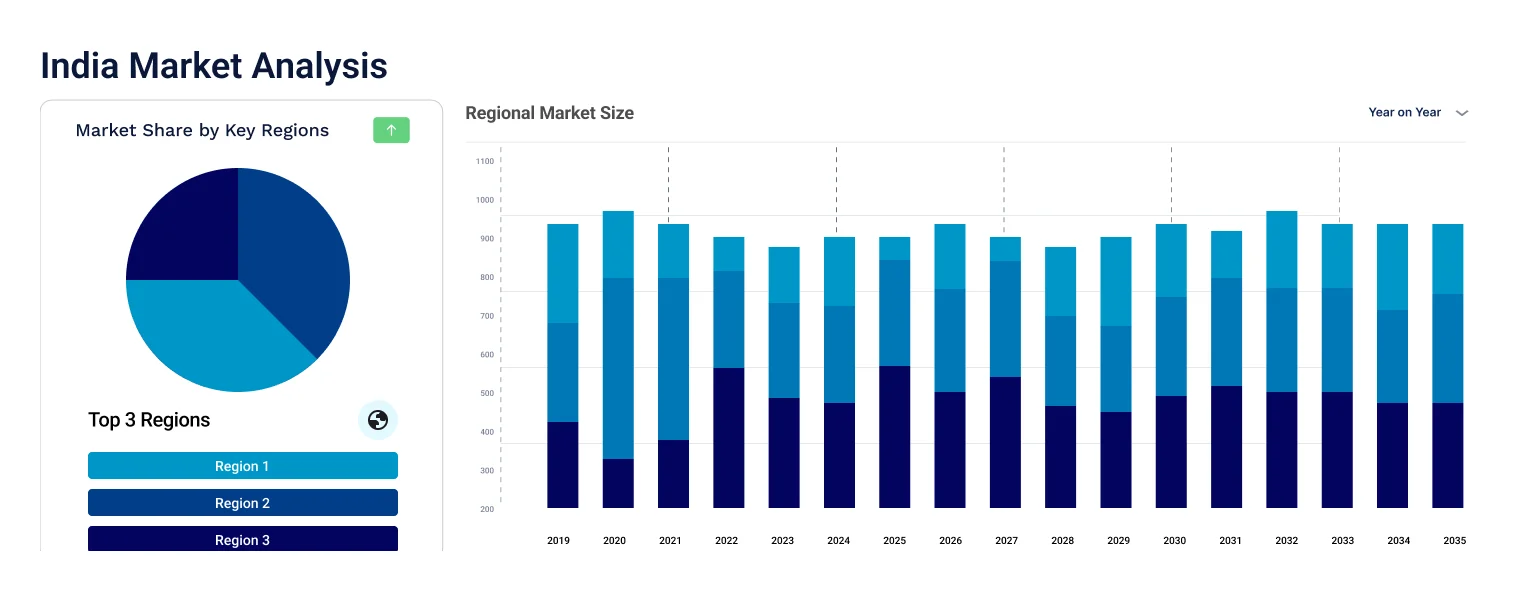
The regional markets for feed additives include North India, East India, West and Central India, and South India.


Market Analysis

India is currently one of the countries with the largest livestock population globally. It is also one of the major producers of milk, meat, broilers, eggs, and fish. This gives the Indian feed additives market an enormous potential for growth. The huge population of the country is a significant driver of the feed additives industry. Moreover, rising disposable incomes, evolving lifestyles, and the growing knowledge of health and well-being have led to a shift in Indian food preferences from cereals to foods rich in proteins, vitamins, and minerals. This drives the consumption of milk, meat, and eggs in the region. Many main factors driving the demand include the growing concentration on improving yields, growing exports, rising emphasis on the prevention of animal diseases, rising concerns about the quality of animal products, and others.


Competitive Landscape

The report gives a detailed analysis of the following key players in the Indian feed additives market, covering their competitive landscape, capacity, and latest developments like mergers, acquisitions, and investments, expansions of capacity, and plant turnarounds:

  • Vinayak Ingredients India Pvt. Ltd.  
  • ADM
  • Evonik
  • BASF SE 
  • Others

The comprehensive EMR report provides an in-depth assessment of the market based on the Porter's five forces model along with giving a SWOT analysis.


Key Highlights of the Report

REPORT FEATURES DETAILS
Base Year 2023
Historical Period 2018-2023
Forecast Period 2024-2032
Scope of the Report

Historical and Forecast Trends, Industry Drivers and Constraints, Historical and Forecast Market Analysis by Segment:

  • Source
  • Product Type
  • Livestock
  • Form
  • Region
Breakup by Source
  • Synthetic
  • Natural
Breakup by Product Type
  • Amino Acids
  • Phosphates
  • Vitamins
  • Acidifiers
  • Carotenoids
  • Enzymes
  • Mycotoxin Detoxifiers
  • Flavours and Sweeteners
  • Antibiotics
  • Minerals
  • Antioxidants
  • Non-Protein Nitrogen
  • Preservatives
  • Phytogenics
  • Probiotics
Breakup by Livestock
  • Ruminants
  • Poultry
  • Swine
  • Aquatic Animal
  • Others
Breakup by Form
  • Dry
  • Liquid
Breakup by Region
  • North India
  • West and Central India
  • South India
  • East India
Market Dynamics
  • SWOT Analysis
  • Porter's Five Forces Analysis
  • Key Indicators for Demand
  • Key Indicators for Price
Competitive Landscape
  • Market Structure
  • Company Profiles
    • Company Overview
    • Product Portfolio
    • Demographic Reach and Achievements
    • Certifications
Companies Covered
  • Vinayak Ingredients India Pvt. Ltd.  
  • ADM
  • Evonik
  • BASF SE 
  • Others
Report Price and Purchase Option Explore our purchase options that are best suited to your resources and industry needs.
Delivery Format Delivered as an attached PDF and Excel through email, with an option of receiving an editable PPT, according to the purchase option.


*At Expert Market Research, we strive to always give you current and accurate information. The numbers depicted in the description are indicative and may differ from the actual numbers in the final EMR report.

1    Preface
2    Report Coverage – Key Segmentation and Scope
3    Report Description

    3.1    Market Definition and Outlook
    3.2    Properties and Applications
    3.3    Market Analysis
    3.4    Key Players
4    Key Assumptions
5    Executive Summary

    5.1    Overview
    5.2    Key Drivers
    5.3    Key Developments
    5.4    Competitive Structure
    5.5    Key Industrial Trends
6    Indian Feed Additives Market Snapshot
7    Opportunities and Challenges in the Market
8    Indian Feed Additives Market Analysis

    8.1    Key Industry Highlights
    8.2    Indian Feed Additives Historical Market (2018-2023) 
    8.3    Indian Feed Additives Market Forecast (2024-2032)
    8.4    Indian Feed Additives Market by Source
        8.4.1    Synthetic  
            8.4.1.1    Historical Trend (2018-2023)
            8.4.1.2    Forecast Trend (2024-2032)
        8.4.2    Natural
            8.4.2.1    Historical Trend (2018-2023)
            8.4.2.2    Forecast Trend (2024-2032)
    8.5    Indian Feed Additives Market by Product Type
        8.5.1    Amino Acids
            8.5.1.1    Historical Trend (2018-2023)
            8.5.1.2    Forecast Trend (2024-2032)
            8.5.1.3    Breakup by Type
                8.5.1.3.1    Lysine
                    8.5.1.3.1.1    Historical Trend (2018-2023)
                    8.5.1.3.1.2    Forecast Trend (2024-2032)
                8.5.1.3.2    Methionine
                    8.5.1.3.2.1    Historical Trend (2018-2023)
                    8.5.1.3.2.2    Forecast Trend (2024-2032)
                8.5.1.3.3    Threonine
                    8.5.1.3.3.1    Historical Trend (2018-2023)
                    8.5.1.3.3.2    Forecast Trend (2024-2032)
                8.5.1.3.4    Tryptophan
                    8.5.1.3.4.1    Historical Trend (2018-2023)
                    8.5.1.3.4.2    Forecast Trend (2024-2032)
        8.5.2    Phosphates  
            8.5.2.1    Historical Trend (2018-2023)
            8.5.2.2    Forecast Trend (2024-2032)
            8.5.2.3    Breakup by Type
                8.5.2.3.1    Monocalcium Phosphate
                    8.5.2.3.1.1    Historical Trend (2018-2023)
                    8.5.2.3.1.2    Forecast Trend (2024-2032)
                8.5.2.3.2    Dicalcium Phosphate
                    8.5.2.3.2.1    Historical Trend (2018-2023)
                    8.5.2.3.2.2    Forecast Trend (2024-2032)
                8.5.2.3.3    Mono-Dicalcium Phosphate
                    8.5.2.3.3.1    Historical Trend (2018-2023)
                    8.5.2.3.3.2    Forecast Trend (2024-2032)
                8.5.2.3.4    Defluorinated Phosphate
                    8.5.2.3.4.1    Historical Trend (2018-2023)
                    8.5.2.3.4.2    Forecast Trend (2024-2032)
                8.5.2.3.5    Tricalcium Phosphate
                    8.5.2.3.5.1    Historical Trend (2018-2023)
                    8.5.2.3.5.2    Forecast Trend (2024-2032)
        8.5.3    Vitamins   
            8.5.3.1    Historical Trend (2018-2023)
            8.5.3.2    Forecast Trend (2024-2032)
            8.5.3.3    Breakup by Type
                8.5.3.3.1    Fat-Soluble
                    8.5.3.3.1.1    Historical Trend (2018-2023)
                    8.5.3.3.1.2    Forecast Trend (2024-2032)
                8.5.3.3.2    Water-Soluble
                    8.5.3.3.2.1    Historical Trend (2018-2023)
                    8.5.3.3.2.2    Forecast Trend (2024-2032)
        8.5.4    Acidifiers   
            8.5.4.1    Historical Trend (2018-2023)
            8.5.4.2    Forecast Trend (2024-2032)
            8.5.4.3    Breakup by Type
                8.5.4.3.1    Propionic Acid
                    8.5.4.3.1.1    Historical Trend (2018-2023)
                    8.5.4.3.1.2    Forecast Trend (2024-2032)
                8.5.4.3.2    Formic Acid
                    8.5.4.3.2.1    Historical Trend (2018-2023)
                    8.5.4.3.2.2    Forecast Trend (2024-2032)
                8.5.4.3.3    Citric Acid
                    8.5.4.3.3.1    Historical Trend (2018-2023)
                    8.5.4.3.3.2    Forecast Trend (2024-2032)
                8.5.4.3.4    Lactic Acid
                    8.5.4.3.4.1    Historical Trend (2018-2023)
                    8.5.4.3.4.2    Forecast Trend (2024-2032)
                8.5.4.3.5    Sorbic Acid
                    8.5.4.3.5.1    Historical Trend (2018-2023)
                    8.5.4.3.5.2    Forecast Trend (2024-2032)
                8.5.4.3.6    Malic Acid
                    8.5.4.3.6.1    Historical Trend (2018-2023)
                    8.5.4.3.6.2    Forecast Trend (2024-2032)
                8.5.4.3.7    Acetic Acid
                    8.5.4.3.7.1    Historical Trend (2018-2023)
                    8.5.4.3.7.2    Forecast Trend (2024-2032)
        8.5.5    Carotenoids    
            8.5.5.1    Historical Trend (2018-2023)
            8.5.5.2    Forecast Trend (2024-2032)
            8.5.5.3    Breakup by Type
                8.5.5.3.1    Astaxanthin
                    8.5.5.3.1.1    Historical Trend (2018-2023)
                    8.5.5.3.1.2    Forecast Trend (2024-2032)
                8.5.5.3.2    Canthaxanthin
                    8.5.5.3.2.1    Historical Trend (2018-2023)
                    8.5.5.3.2.2    Forecast Trend (2024-2032)
                8.5.5.3.3    Lutein
                    8.5.5.3.3.1    Historical Trend (2018-2023)
                    8.5.5.3.3.2    Forecast Trend (2024-2032)
                8.5.5.3.4    Beta-Carotene
                    8.5.5.3.4.1    Historical Trend (2018-2023)
                    8.5.5.3.4.2    Forecast Trend (2024-2032)
        8.5.6    Enzymes    
            8.5.6.1    Historical Trend (2018-2023)
            8.5.6.2    Forecast Trend (2024-2032)
            8.5.6.3    Breakup by Type
                8.5.6.3.1    Phytase
                    8.5.6.3.1.1    Historical Trend (2018-2023)
                    8.5.6.3.1.2    Forecast Trend (2024-2032)
                8.5.6.3.2    Protease
                    8.5.6.3.2.1    Historical Trend (2018-2023)
                    8.5.6.3.2.2    Forecast Trend (2024-2032)
                8.5.6.3.3    Others
        8.5.7    Mycotoxin Detoxifiers
            8.5.7.1    Historical Trend (2018-2023)
            8.5.7.2    Forecast Trend (2024-2032)
            8.5.7.3    Breakup by Type
                8.5.7.3.1    Binders
                    8.5.7.3.1.1    Historical Trend (2018-2023)
                    8.5.7.3.1.2    Forecast Trend (2024-2032)
                8.5.7.3.2    Modifiers
                    8.5.7.3.2.1    Historical Trend (2018-2023)
                    8.5.7.3.2.2    Forecast Trend (2024-2032)
        8.5.8    Flavours and Sweeteners  
            8.5.8.1    Historical Trend (2018-2023)
            8.5.8.2    Forecast Trend (2024-2032)
            8.5.8.3    Breakup by Type
                8.5.8.3.1    Flavours
                    8.5.8.3.1.1    Historical Trend (2018-2023)
                    8.5.8.3.1.2    Forecast Trend (2024-2032)
                8.5.8.3.2    Sweeteners
                    8.5.8.3.2.1    Historical Trend (2018-2023)
                    8.5.8.3.2.2    Forecast Trend (2024-2032)
        8.5.9    Antibiotics     
            8.5.9.1    Historical Trend (2018-2023)
            8.5.9.2    Forecast Trend (2024-2032)
            8.5.9.3    Breakup by Type
                8.5.9.3.1    Tetracycline
                    8.5.9.3.1.1    Historical Trend (2018-2023)
                    8.5.9.3.1.2    Forecast Trend (2024-2032)
                8.5.9.3.2    Penicillin
                    8.5.9.3.2.1    Historical Trend (2018-2023)
                    8.5.9.3.2.2    Forecast Trend (2024-2032)
                8.5.9.3.3    Others
        8.5.10    Minerals     
            8.5.10.1    Historical Trend (2018-2023)
            8.5.10.2    Forecast Trend (2024-2032)
            8.5.10.3    Breakup by Type
                8.5.10.3.1    Potassium
                    8.5.10.3.1.1    Historical Trend (2018-2023)
                    8.5.10.3.1.2    Forecast Trend (2024-2032)
                8.5.10.3.2    Calcium
                    8.5.10.3.2.1    Historical Trend (2018-2023)
                    8.5.10.3.2.2    Forecast Trend (2024-2032)
                8.5.10.3.3    Phosphorus
                    8.5.10.3.3.1    Historical Trend (2018-2023)
                    8.5.10.3.3.2    Forecast Trend (2024-2032)
                8.5.10.3.4    Magnesium
                    8.5.10.3.4.1    Historical Trend (2018-2023)
                    8.5.10.3.4.2    Forecast Trend (2024-2032)
                8.5.10.3.5    Sodium
                    8.5.10.3.5.1    Historical Trend (2018-2023)
                    8.5.10.3.5.2    Forecast Trend (2024-2032)
                8.5.10.3.6    Iron
                    8.5.10.3.6.1    Historical Trend (2018-2023)
                    8.5.10.3.6.2    Forecast Trend (2024-2032)
                8.5.10.3.7    Zinc
                    8.5.10.3.7.1    Historical Trend (2018-2023)
                    8.5.10.3.7.2    Forecast Trend (2024-2032)
                8.5.10.3.8    Copper
                    8.5.10.3.8.1    Historical Trend (2018-2023)
                    8.5.10.3.8.2    Forecast Trend (2024-2032)
                8.5.10.3.9    Manganese
                    8.5.10.3.9.1    Historical Trend (2018-2023)
                    8.5.10.3.9.2    Forecast Trend (2024-2032)
                8.5.10.3.10    Others
        8.5.11    Antioxidants     
            8.5.11.1    Historical Trend (2018-2023)
            8.5.11.2    Forecast Trend (2024-2032)
            8.5.11.3    Breakup by Type
                8.5.11.3.1    Bha
                    8.5.11.3.1.1    Historical Trend (2018-2023)
                    8.5.11.3.1.2    Forecast Trend (2024-2032)
                8.5.11.3.2    Bht
                    8.5.11.3.2.1    Historical Trend (2018-2023)
                    8.5.11.3.2.2    Forecast Trend (2024-2032)
                8.5.11.3.3    Ethoxyquin 
                    8.5.11.3.3.1    Historical Trend (2018-2023)
                    8.5.11.3.3.2    Forecast Trend (2024-2032)
                8.5.11.3.4    Others
        8.5.12    Non-Protein Nitrogen      
            8.5.12.1    Historical Trend (2018-2023)
            8.5.12.2    Forecast Trend (2024-2032)
            8.5.12.3    Breakup by Type
                8.5.12.3.1    Urea
                    8.5.12.3.1.1    Historical Trend (2018-2023)
                    8.5.12.3.1.2    Forecast Trend (2024-2032)
                8.5.12.3.2    Ammonia
                    8.5.12.3.2.1    Historical Trend (2018-2023)
                    8.5.12.3.2.2    Forecast Trend (2024-2032)
                8.5.12.3.3    Others
        8.5.13    Preservatives      
            8.5.13.1    Historical Trend (2018-2023)
            8.5.13.2    Forecast Trend (2024-2032)
            8.5.13.3    Breakup by Type
                8.5.13.3.1    Mold Inhibitors
                    8.5.13.3.1.1    Historical Trend (2018-2023)
                    8.5.13.3.1.2    Forecast Trend (2024-2032)
                8.5.13.3.2    Anticaking Agents
                    8.5.13.3.2.1    Historical Trend (2018-2023)
                    8.5.13.3.2.2    Forecast Trend (2024-2032)
        8.5.14    Phytogenics       
            8.5.14.1    Historical Trend (2018-2023)
            8.5.14.2    Forecast Trend (2024-2032)
            8.5.14.3    Breakup by Type
                8.5.14.3.1    Essential Oils
                    8.5.14.3.1.1    Historical Trend (2018-2023)
                    8.5.14.3.1.2    Forecast Trend (2024-2032)
                8.5.14.3.2    Herbs and Spices 
                    8.5.14.3.2.1    Historical Trend (2018-2023)
                    8.5.14.3.2.2    Forecast Trend (2024-2032)
                8.5.14.3.3    Oleoresin
                    8.5.14.3.3.1    Historical Trend (2018-2023)
                    8.5.14.3.3.2    Forecast Trend (2024-2032)
                8.5.14.3.4    Others
        8.5.15    Probiotics              
            8.5.15.1    Historical Trend (2018-2023)
            8.5.15.2    Forecast Trend (2024-2032)
            8.5.15.3    Breakup by Type
                8.5.15.3.1    Lactobacilli
                    8.5.15.3.1.1    Historical Trend (2018-2023)
                    8.5.15.3.1.2    Forecast Trend (2024-2032)
                8.5.15.3.2    Stretococcus Thermophilus
                    8.5.15.3.2.1    Historical Trend (2018-2023)
                    8.5.15.3.2.2    Forecast Trend (2024-2032)
                8.5.15.3.3    Bifidobacteria
                    8.5.15.3.3.1    Historical Trend (2018-2023)
                    8.5.15.3.3.2    Forecast Trend (2024-2032)
                8.5.15.3.4    Others
    8.6    Indian Feed Additives Market by Livestock
        8.6.1    Ruminants
            8.6.1.1    Historical Trend (2018-2023)
            8.6.1.2    Forecast Trend (2024-2032)
            8.6.1.3    Breakup by Type
                8.6.1.3.1    Calves
                    8.6.1.3.1.1    Historical Trend (2018-2023)
                    8.6.1.3.1.2    Forecast Trend (2024-2032)
                8.6.1.3.2    Dairy Cattle
                    8.6.1.3.2.1    Historical Trend (2018-2023)
                    8.6.1.3.2.2    Forecast Trend (2024-2032)
                8.6.1.3.3    Beef Cattle
                    8.6.1.3.3.1    Historical Trend (2018-2023)
                    8.6.1.3.3.2    Forecast Trend (2024-2032)
                8.6.1.3.4    Others
        8.6.2    Poultry    
            8.6.2.1    Historical Trend (2018-2023)
            8.6.2.2    Forecast Trend (2024-2032)
            8.6.2.3    Breakup by Type
                8.6.2.3.1    Broilers
                    8.6.2.3.1.1    Historical Trend (2018-2023)
                    8.6.2.3.1.2    Forecast Trend (2024-2032)
                8.6.2.3.2    Layers
                    8.6.2.3.2.1    Historical Trend (2018-2023)
                    8.6.2.3.2.2    Forecast Trend (2024-2032)
                8.6.2.3.3    Breeders
                    8.6.2.3.3.1    Historical Trend (2018-2023)
                    8.6.2.3.3.2    Forecast Trend (2024-2032)
        8.6.3    Swine    
            8.6.3.1    Historical Trend (2018-2023)
            8.6.3.2    Forecast Trend (2024-2032)
            8.6.3.3    Breakup by Type
                8.6.3.3.1    Starters
                    8.6.3.3.1.1    Historical Trend (2018-2023)
                    8.6.3.3.1.2    Forecast Trend (2024-2032)
                8.6.3.3.2    Growers
                    8.6.3.3.2.1    Historical Trend (2018-2023)
                    8.6.3.3.2.2    Forecast Trend (2024-2032)
                8.6.3.3.3    Sows
                    8.6.3.3.3.1    Historical Trend (2018-2023)
                    8.6.3.3.3.2    Forecast Trend (2024-2032)
        8.6.4    Aquatic Animal    
            8.6.4.1    Historical Trend (2018-2023)
            8.6.4.2    Forecast Trend (2024-2032)
        8.6.5    Others
    8.7    Indian Feed Additives Market by Form
        8.7.1    Dry    
            8.7.1.1    Historical Trend (2018-2023)
            8.7.1.2    Forecast Trend (2024-2032)
        8.7.2    Liquid    
            8.7.2.1    Historical Trend (2018-2023)
            8.7.2.2    Forecast Trend (2024-2032)
    8.8    Indian Feed Additives Market by Region
        8.8.1    North India
        8.8.2    West and Central India
        8.8.3    South India
        8.8.4    East India
9    Regional Analysis
    9.1    North India
        9.1.1    Historical Trend (2018-2023)
        9.1.2    Forecast Trend (2024-2032)
    9.2    West and Central India
        9.2.1    Historical Trend (2018-2023)
        9.2.2    Forecast Trend (2024-2032)
    9.3    South India
        9.3.1    Historical Trend (2018-2023)
        9.3.2    Forecast Trend (2024-2032)
    9.4    East India
        9.4.1    Historical Trend (2018-2023)
        9.4.2    Forecast Trend (2024-2032)
10    Market Dynamics
    10.1    SWOT Analysis
        10.1.1    Strengths
        10.1.2    Weaknesses
        10.1.3    Opportunities
        10.1.4    Threats
    10.2    Porter’s Five Forces Analysis
        10.2.1    Supplier’s Power
        10.2.2    Buyers Power
        10.2.3    Threat of New Entrants
        10.2.4    Degree of Rivalry
        10.2.5    Threat of Substitutes
    10.3    PESTEL Analysis
        10.3.1    Political
        10.3.2     Economic
        10.3.3     Social
        10.3.4     Legal
        10.3.5     Environmental
        10.3.6     Technological
    10.4    Key Indicators for Demand
    10.5    Key Indicators for Price
11    Value Chain Analysis
12    Price Analysis
13    Government Regulations
14    Strategic Recommendations
15    Competitive Landscape

    15.1    Market Structure
    15.2    Key Players
    15.3    Company Profiles
        15.3.1    Vinayak Ingredients India Pvt. Ltd.  
            15.3.1.1    Company Overview
            15.3.1.2    Product Portfolio
            15.3.1.3    Demographic Reach and Achievements
            15.3.1.4    Certifications
        15.3.2    ADM
            15.3.2.1    Company Overview
            15.3.2.2    Product Portfolio
            15.3.2.3    Demographic Reach and Achievements
            15.3.2.4    Certifications
        15.3.3    Evonik
            15.3.3.1    Company Overview
            15.3.3.2    Product Portfolio
            15.3.3.3    Demographic Reach and Achievements
            15.3.3.4    Certifications
        15.3.4    BASF SE    
            15.3.4.1    Company Overview
            15.3.4.2    Product Portfolio
            15.3.4.3    Demographic Reach and Achievements
            15.3.4.4    Certifications
        15.3.5    Others
16    Key Trends and Developments in the Market


List of Key Figures and Tables

1.    Indian Feed Additives Market: Key Industry Highlights, 2018 and 2032
2.    Indian Feed Additives Historical Market: Breakup by Source (USD Billion), 2018-2023
3.    Indian Feed Additives Market Forecast: Breakup by Source (USD Billion), 2024-2032
4.    Indian Feed Additives Historical Market: Breakup by Product Type (USD Billion), 2018-2023
5.    Indian Feed Additives Market Forecast: Breakup by Product Type (USD Billion), 2024-2032
6.    Indian Feed Additives Historical Market: Breakup by Livestock (USD Billion), 2018-2023
7.    Indian Feed Additives Market Forecast: Breakup by Livestock (USD Billion), 2024-2032
8.    Indian Feed Additives Historical Market: Breakup by Form (USD Billion), 2018-2023
9.    Indian Feed Additives Market Forecast: Breakup by Form (USD Billion), 2024-2032
10.    Indian Feed Additives Historical Market: Breakup by Region (USD Billion), 2018-2023
11.    Indian Feed Additives Market Forecast: Breakup by Region (USD Billion), 2024-2032
12.    Indian Feed Additives Market Structure

Key Questions Answered in the Report

The market is projected to grow at a CAGR of nearly 7% in the forecast period of 2024-2032.

The major drivers of the industry include rising disposable incomes, increasing population, evolving lifestyles, the rising knowledge of health and well-being of animals, growing concentration on improving yields, growing exports, and rising concerns about the quality of animal products.

The increasing emphasis on the prevention of animal diseases is expected to be a key trend guiding the growth of the industry.

North India, East India, West and Central India, and South India are the leading regions in the market.

The major sources of the product include synthetic and natural.

Amino acids, phosphates, vitamins, acidifiers, carotenoids, enzymes, mycotoxin detoxifiers, flavours and sweeteners, antibiotics, minerals, antioxidants, non-protein nitrogen, preservatives, phytogenic, and probiotics are the leading product types in the industry.   

The major livestock types in the industry are ruminants, poultry, swine, and aquatic animal, among others.

The major forms can be divided into dry and liquid.

The leading players in the market are Vinayak Ingredients India Pvt. Ltd., ADM, Evonik, and BASF SE, among others.

Analyst Review

The Indian feed additives market is driven by the evolving lifestyles of the population of India. Aided by the growing knowledge of the health and well-being of the animals, the industry is expected to witness a healthy growth in the forecast period of 2024-2032, growing at a CAGR of 7%. 

EMR’s meticulous research methodology delves deep into the industry, covering the macro and micro aspects of the industry. Based on its sources, the Indian market for feed additives can be segmented into synthetic and natural. On the basis of product types, the industry can be divided into amino acids, phosphates, vitamins, acidifiers, carotenoids, enzymes, mycotoxin detoxifiers, flavours and sweeteners, antibiotics, minerals, antioxidants, non-protein nitrogen, preservatives, phytogenic, and probiotics. By livestock, the industry can be segmented into ruminants, poultry, swine, and aquatic animal, among others. On the basis of forms, the industry can be segmented into dry and liquid. The major regional markets for feed additives are North India, East India, West and Central India, and South India. The key players in the above industry include Vinayak Ingredients India Pvt. Ltd., ADM, Evonik, and BASF SE, among others.

EMR’s research methodology uses a combination of cutting-edge analytical tools and the expertise of their highly accomplished team, thus, providing their customers with market insights that are accurate, actionable, and help them remain ahead of their competition.  

Purchase Full Report

Mini Report

$ 2199     $1999
  • Selected Sections, One User
  • Printing Not Allowed
  • Email Delivery in PDF
  • Free Limited Customisation
  • Post Sales Analyst Support
  • 50% Discount on Next Update

Single User License

$ 3299     $2999
  • All Sections, One User
  • One Print Allowed
  • Email Delivery in PDF
  • Free Limited Customisation
  • Post Sales Analyst Support
  • 50% Discount on Next Update
most popular

Five User License

$ 4399     $3999
  • All Sections, Five Users
  • Five Prints Allowed
  • Email Delivery in PDF
  • Free Limited Customisation
  • Post Sales Analyst Support
  • 50% Discount on Next Update

Corporate License

$ 5499     $4999
  • All Sections, Unlimited Users
  • Unlimited Prints Allowed
  • Email Delivery in PDF + Excel
  • Free Limited Customisation
  • Post Sales Analyst Support
  • 50% Discount on Next Update

Any Question? Speak With An Analyst

Contact Analyst

View A Sample

Request Sample

Did You Miss Anything, Ask Now

Request Customisation
Why Expert Market Research?

Right People

We are technically excellent, strategic, practical, experienced and efficient; our analysts are hand-picked based on having the right attributes to work successfully and execute projects based on your expectations.

Right Methodology

We leverage our cutting-edge technology, our access to trusted databases, and our knowledge of the current models used in the market to deliver you research solutions that are tailored to your needs and put you ahead of the curve.

Right Price

We deliver in-depth and superior quality research in prices that are reasonable, unmatchable, and shows our understanding of your resource structure. We, additionally, offer attractive discounts on our upcoming reports.

Right Support

Our team of expert analysts are at your beck and call to deliver you optimum results that are customised to meet your precise needs within the specified timeframe and help you form a better understanding of the industry.

NEWSLETTER