

Consumer Insights
Uncover trends and behaviors shaping consumer choices today
Procurement Insights
Optimize your sourcing strategy with key market data
Industry Stats
Stay ahead with the latest trends and market analysis.

The Indonesia barge fleet market was valued at USD 1.39 Billion in 2025. The market is expected to grow at a CAGR of 4.70% during the forecast period of 2026-2035 to reach a value of USD 2.20 Billion by 2035. The Indonesian barge fleet is set to experience steady expansion, fueled by ongoing investments in infrastructure, innovative technologies, and sustainable shipping methods.
The growth in this market is attributed to substantial port infrastructure enhancement and targeted government programs such as the “Tol Laut” (Maritime Highway) program. Given that Indonesia is comprised of over 17,000 islands, barge transport is the most expedient and cost-efficient way to transport bulk commodities including coal, petroleum, palm oil, and agriculture. In 2024, the government accelerated the modernization of its smart port technology, which includes plans to automate gates and develop digital logistics systems at 59 different ports to improve operational efficiency and transparency.
This process is aided by increasing fleets that comply with international emissions standards as operators transition to cleaner engines and begin utilizing digital tools to manage fleets. Taken together, all of these efforts improve the reliability and sustainability of barge operations while also accommodating Indonesia’s increasing trading activity and industrial output.
The Indonesia barge fleet market share is growing with the increasing demand for bulk commodity transport, strong import-export activity, and the government’s focus on port modernization and maritime infrastructure. Recent technological advancements, including the integration of GPS tracking, digital fleet management, and the adoption of hybrid and eco-friendly barges, are enhancing operational efficiency and ensuring better environmental compliance.
Base Year
Historical Period
Forecast Period
Barges used in Indonesia can range from 180 feet to 365 feet, carrying a total capacity of 12,000 MT.
Indonesia had one of the largest tog fleets, with 3,600 vessels being registered in 2017.
Reportedly, the export and import of fish in Indonesia amounted to 1,243,838 metric tons in 2020.
Compound Annual Growth Rate
4.7%
Value in USD Billion
2026-2035
*this image is indicative*
| Indonesia Barge Fleet Market Report Summary | Description | Value |
| Base Year | USD Billion | 2025 |
| Historical Period | USD Billion | 2019-2025 |
| Forecast Period | USD Billion | 2026-2035 |
| Market Size 2025 | USD Billion | 1.39 |
| Market Size 2035 | USD Billion | 2.20 |
| CAGR 2019-2025 | Percentage | XX% |
| CAGR 2026-2035 | Percentage | 4.70% |
| CAGR 2026-2035 - Market by Region | Sumatra | 5.0% |
| CAGR 2026-2035 - Market by Region | Sulawesi | 4.2% |
| CAGR 2026-2035 - Market by Type | Covered Barge | 5.6% |
| CAGR 2026-2035 - Market by End Use | Agricultural Products | 5.6% |
| 2025 Market Share by Region | Kalimantan | 54.0% |
The Indonesia barge fleet market is changing due to a national push for smart port infrastructure and digitalization. In 2024, 14 major ports were fully digitized and will soon be expanded to 246 ports using platforms such as Inaportnet, SIMLALA, and the National Logistics Ecosystem (NLE). These systems are equipped with onboard IoT sensors, real-time cargo tracking, and automation technologies such as AGVs and drone inspections, which contribute to increased efficiency. Pelindo introduced automatic gates and cashless systems, and Batu Ampar Port is being designed as a smart international hub that will also provide better operational transparency and lower costs.
The Indonesian barge fleet is also taking on a significant role in transporting the country’s record coal and agricultural outputs. In 2024, Indonesia produced 836 million metric tons of coal, exceeding its 18% target, and exported 555 million tons to re-confirm Indonesia's position as the world's largest thermal coal exporter. Barges remain a significant transportation method for moving coal from inland mines to export terminals, notably in Kalimantan and Sumatra. Additionally, palm oil production reached 48.16 million tones in 2024, with barges facilitating both domestic distribution and exports, offering a competitive advantage due to their ability to navigate shallow, remote waterways.
Technological innovation is reshaping the barge fleet market in Indonesia. Operators are adopting GPS tracking, telematics, and real-time remote monitoring to optimize routes, reduce fuel consumption, and improve cargo security. In March 2025, fleet telematics provider TransTRACK teamed up with Politeknik Perkapalan Negeri Surabaya (PPNS) to develop & test automation & telematics specifically for marine/fleet operations. The integration of predictive maintenance and digital compliance tools is also lowering operational costs and minimizing downtime, while partnerships between barge operators, ports, and logistics firms are enabling seamless multimodal supply chains.
Environmental sustainability is a rising priority for Indonesia’s maritime sector. In April 2025, PT PLN (Persero), the Ministry of Transportation, and private partners launched a green hydrogen collaboration to explore hydrogen-powered vessels and hybrid propulsion systems for maritime decarbonization. The government is actively converting conventional vessels to hybrid hydrogen-battery models, supporting Indonesia’s Net Zero Emissions target by 2060. Major barge operators are also retrofitting fleets with cleaner engines and adopting LNG and biofuel technologies, aligning with stringent IMO emissions standards and growing public and stakeholder demand for greener shipping solutions.
Indonesia’s archipelagic geography and government investment are fueling inter-island trade and new logistics corridors, adding to the Indonesia barge fleet market revenue. The Maritime Highway initiative, with USD 295 million allocated for new ships and expanded routes, is improving connectivity to remote islands and reducing voyage times by up to a third. The development of special economic zones and major industrial parks in Sumatra, Sulawesi, and Kalimantan is driving demand for barge transport to support import-export activity and industrial logistics. These projects, alongside regional trade agreements and the ASEAN Single Shipping Market, are opening new markets and service opportunities.
Read more about this report - REQUEST FREE SAMPLE COPY IN PDF
The EMR’s report titled “Indonesia Barge Fleet Market Report and Forecast 2026-2035” offers a detailed analysis of the market based on the following segments:
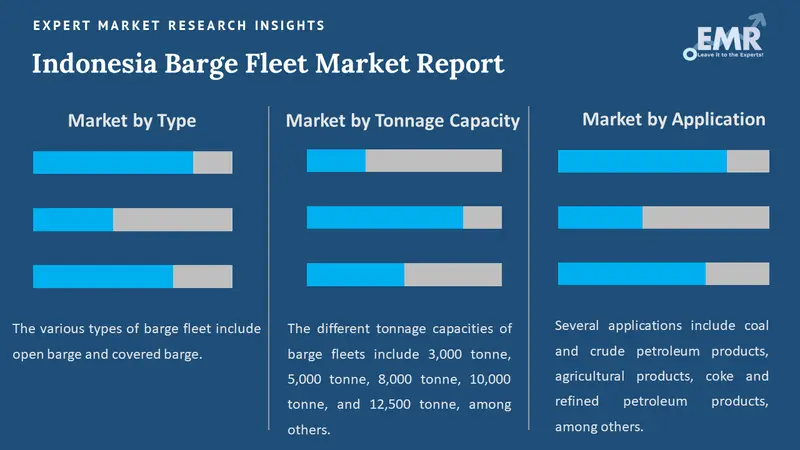
Market Breakup by Type
Key Insight: Open barges remain the most widely used vessel type in the market, favored for their versatility and efficiency in transporting bulk commodities such as coal, palm oil, and aggregates. Covered barges are becoming more popular for moving weather-sensitive cargo and finished products, but they still take up a smaller portion due to higher costs and specialization. The growth of mining and agricultural exports supports the demand for open barges, while regulatory changes and cargo with value added continues the gradual increase for covered barges.
Market Breakup by Tonnage Capacity
Key Insight: The segment with a capacity of 10,000 metric tons dominates the Indonesia barge fleet market, striking the right balance between cargo volume and satisfactory navigable conditions through the range of river and coastal conditions present in the region. Barges within this segment are used predominantly for coal and agricultural cargoes, offering economy of scale while ensuring it does not exceed draft limitations on the major inland waterways. Meanwhile, the 12,500 metric ton segment is emerging as the fastest growing segment based on increases in export volumes and the need of more efficient long-haul transport. The upgrades and newbuilds in this segment show that the industry is moving towards greater capacity and forward-looking fuel efficiency.
Market Breakup by Application
Key Insight: Coal and crude petroleum products are the largest application segment in the Indonesia barge fleet industry, reflecting Indonesia’s status as the world’s leading thermal coal exporter and a major oil producer. Barges are essential for moving these commodities from inland mines and oilfields to coastal export terminals, especially in Kalimantan and Sumatra. Agricultural products, including palm oil and rubber, represent the fastest-growing application, supported by government incentives, expanding plantation areas, and improved logistics infrastructure. The sector’s diversification into refined petroleum, chemicals, and food products is also driving demand for specialized barge solutions.
Market Breakup by Region
Key Insight: Jakarta is the leading region in the Indonesia barge fleet expansion. This is due to its strategic port infrastructure, dense concentration of shipping companies, and central role in national trade logistics. The Northeast Coast of Sumatra is the fastest-growing region, driven by new industrial parks, palm oil processing facilities, and port upgrades that are attracting both domestic and international investment. These developments are enabling Sumatra to capture a larger share of inter-island and export trade.
| CAGR 2026-2035 - Market by | Region |
| Sumatra | 5.0% |
| Sulawesi | 4.2% |
| Java | XX% |
| Kalimantan | XX% |
| Others | XX% |
By type, open barge to retain the largest market share due to rising investments
Open barges represent the dominant vessel type in the Indonesia barge fleet market. Their role has expanded well beyond the transport of coal and palm oil, with increasing utilization for aggregates, seafood, and construction materials highlighting their importance in both domestic logistics and export-oriented trade. Ongoing government initiatives, and major investments in port infrastructure, are enhancing waterway connectivity and reducing bottlenecks, creating favorable conditions for continued growth. In August 2024, Bakrie Group’s ALII disclosed plans to manage 127 ships by 2024, expanding its fleet with new open barges and tugboats.
Covered barges are emerging as the fastest-growing segment in the Indonesia barge fleet industry, driven by rising demand for secure transport of weather-sensitive and high-value goods. This momentum is supported by the rapid expansion of Indonesia’s chemical, petrochemical, and food processing industries, which increasingly require enhanced cargo protection and adherence to stringent environmental and safety standards. Government initiatives focused on fleet modernization, value-added exports, and regulatory compliance along with growing insurance requirements for sensitive shipments are further accelerating adoption.
| CAGR 2026-2035 - Market by | Type |
| Covered Barge | 5.6% |
| Open Barge | XX% |
10,000-tonne barges to capture significant share due to rising shipments
The segment for 10,000-tonne vessels is favorably suited for shipments of coal and palm oil, providing economies of scale while being consistent with draft restrictions on significant inland and coastal routes. Operators rely on this vessel class for efficient service to domestic and export markets and to facilitate streamlined logistics while following any port and waterway restrictions. The strong position of the segment has been further strengthened through fleet modernization, specifically with better fuel efficiency vessels and increased digital fleet management, such as real-time tracking and predictive maintenance.
The new 12,500-tonne barge segment is a quickly developing seam in the Indonesia barge fleet market, supported by the demand for high-capacity vessels being driven by rising export volumes and long-haul logistics within Indonesia. In October 2024, Indonesia’s BBRM purchased a 12,000 DWT self-propelled barge from the Marcopolo Shipyard for USD 6.5 million through an affiliate deal. This growth is particularly fueled by the expansion of industrial parks and special economic zones. Fleet upgrades, including newbuild deliveries from regional shipyards, have also accelerated this trend.
| CAGR 2026-2035 - Market by | End Use |
| Agricultural Products | 5.6% |
| Coke and Refined Petroleum Products | 5.0% |
| Coal and other bulk material | XX% |
| Crude Petroleum Products | XX% |
| Chemical and Petrochemical | XX% |
| Food Products, Beverages, and Tobacco | 5.8% |
| Others | XX% |
Coal and crude petroleum products to lead market growth due to cold chain infrastructure
Coal and crude petroleum products remain the largest application for barge transport in Indonesia, reflecting the country’s position as the world’s leading thermal coal exporter and a significant oil producer. The reliance on barge transport is particularly pronounced in Kalimantan and Sumatra, where inland mines and oilfields depend on riverine and coastal logistics to reach export terminals. Recent surges in coal production-836 million metric tons in 2024, surpassing government targets-have further underscored the critical role of barges in supporting Indonesia’s energy supply chain.
Agricultural products, particularly palm oil, rubber, and grains, represent the fastest-growing application for the Indonesia barge fleet market. The growth is fueled by government incentives for agribusiness, expanding plantation areas, and rising global demand for Indonesian palm oil. In June 2022, Indonesia launched a scheme to speed up palm oil exports, aiming to ship at least 1 million tones of crude palm oil and derivatives. The development of new agro-industrial parks and improved rural logistics infrastructure have enabled more efficient barge transport from remote plantations to export terminals.
Jakarta claims the dominant market position owing to port upgrades
Capital Area (Jakarta) continues to lead the Indonesia barge fleet market, underpinned by its strategic location, robust port infrastructure, and concentration of logistics companies. Jakarta's vast networks of waterways make it possible for bulk commodities such as coal, crude oil, and agricultural commodities to be moved efficiently, which is necessary to support the economic framework of Indonesia. The presence of several major shipping and logistics companies based in Jakarta illustrates the significance of the rest of Indonesia's maritime logistics system.
| 2025 Market Share by | Region |
| Kalimantan | 54.0% |
| Java | XX% |
| Sumatra | XX% |
| Sulawesi | XX% |
| Others | XX% |
The Northeast Coast of Sumatra is quickly becoming Indonesia's busiest area for barge fleet deployment, fueled by investments in port facilities and industrial parks, and agriculture for export. One of the key drivers of this development is the ongoing development of Belawan New Container Terminal (BNCT). Pelindo (Indonesia's sovereign wealth fund) has partnered with the conglomerate DP World in this endeavor with plans to double the current capacity of BNCT to 1.4 million TEU in the next six years to increase Sumatra's cargo handling capacity. Palm oil plantation developments and new industrial parks are likewise drawing domestic and foreign investment.

Read more about this report - REQUEST FREE SAMPLE COPY IN PDF
The Indonesia barge fleet market is highly competitive, with players from both the region as well as nationally competing for market share. Companies are focusing on fleet renewal, digitization, and forming strategic alliances to strengthen their position in the market. Certain innovations in vessel design, the implementation of green technologies, and the use of advanced digital fleet management systems are key drivers for firms’ to stand apart from the competition.
At the same time, consolidation in the market consists of large firms buying smaller operators to build their route network and improve fleet efficiencies. Government policy through port uplift and commitment to sustainable shipping practices have all influenced the competitive landscape. Companies are now compelled to focus on compliance and operational excellence as differentiating factors.
Habco was founded in 1991 in Pekanbaru, Indonesia. It is involved with marine logistics, tug and barge service, and bulk cargo transport. Habco's subsidiary, Habco Trans Maritima, provides services spanning from stevedoring to floating cranes. Habco focuses on end-to-end solutions and fleet expansion with larger capacity vessels and higher operational effectiveness.
GAC Indonesia's main office was established in 1990 in Jakarta. As a member of the international GAC Group, it provides ship agency, offshore and marine logistics services. The organization implements global best practices, providing integrated supporting services, warehouse capacity, operational efficiency and client satisfaction for complex logistics services.
Gurita Lintas Samudera was established in 1971 with its main office in West Jakarta, Indonesia. It operates a mixed fleet of bulk carriers and tug-barge pairs. The organization is recognized for its ISO approved operation, safe handling of cargo, and its custom-fitted maritime logistics service. Gurita Lintas Samudera specializes in operational safety, compliance, and fleet versatility with customer-focused solutions throughout the archipelago.
Established in 1998, PT Pelayaran Nasional Bina Buana Raya Tbk (BBR) has its corporate office in Central Jakarta, Indonesia. It provides vessel chartering, offshore support services, and cargo haulage. Listed in the Indonesia Stock Exchange in 2013, BBR operates AHTS, PSVs, and self-propelled barges. The company prioritizes new-generation fleet acquisition, offshore services innovation, and quality-based coal and oil logistics.
*Please note that this is only a partial list; the complete list of key players is available in the full report. Additionally, the list of key players can be customized to better suit your needs.*
Other key players in the market are PT Sillo Maritime Perdana TBK, among others.
Unlock the latest insights into the Indonesia Barge Fleet Market with our comprehensive 2026 - 2035 report. Download your free sample to explore Indonesia Barge Fleet Market Size, trends 2026, and actionable strategies for growth. Stay ahead with trusted, data-driven intelligence-ideal for fleet operators, investors, and logistics professionals seeking to capitalize on Indonesia’s dynamic maritime sector. Request your sample now to drive your business forward.


Upto 15% Off
USD
$2999 $2699
$4399 $3959
$5599 $4759
$6659 $5660


*While we strive to always give you current and accurate information, the numbers depicted on the website are indicative and may differ from the actual numbers in the main report. At Expert Market Research, we aim to bring you the latest insights and trends in the market. Using our analyses and forecasts, stakeholders can understand the market dynamics, navigate challenges, and capitalize on opportunities to make data-driven strategic decisions.*
Get in touch with us for a customized solution tailored to your unique requirements and save upto 35%!
The market is projected to grow at a CAGR of 4.70% between 2026 and 2035.
The key strategies in the market include fleet modernization with fuel-efficient, eco-friendly vessels, and increased digitalization through real-time tracking, predictive maintenance, and route optimization. Infrastructure expansion, such as improved ports, terminals, and inland waterways also plays a critical role.
The key market trends include the growing demand for cost-effective conveyance and an upsurge in the demand for coal to meet the rising energy needs.
The various types of barge fleets include open barge and covered barge.
The several applications of barge fleets include coal and crude petroleum products, agricultural products, coke and refined petroleum products, chemical and petrochemicals, and food products, beverages, and tobacco, among others.
The major regions in the market are the Capital Area (Jakarta), the Northeast Coast of Sumatra, the Southern Ports, the Northern Shores of Java, and the Western End of Surabaya.
The key players in the market include Habco Indonesia, GAC Indonesia Shipping, Gurita Lintas Samudera, PT Pelayaran Nasional Bina Buana Raya Tbk, and PT Sillo Maritime Perdana TBK, among others.
The purpose of a barge is to transport heavy and high-volume cargo across waterways such as rivers and canals.
In 2025, the market reached an approximate value of USD 1.39 Billion.
Key challenges include aging, inefficient vessels needing costly upgrades; inconsistent and burdensome regulations; infrastructure bottlenecks, fuel price volatility and severe weather disruptions.
Explore our key highlights of the report and gain a concise overview of key findings, trends, and actionable insights that will empower your strategic decisions.
| REPORT FEATURES | DETAILS |
| Base Year | 2025 |
| Historical Period | 2019-2025 |
| Forecast Period | 2026-2035 |
| Scope of the Report |
Historical and Forecast Trends, Industry Drivers and Constraints, Historical and Forecast Market Analysis by Segment:
|
| Breakup by Type |
|
| Breakup by Tonnage Capacity |
|
| Breakup by Application |
|
| Breakup by Region |
|
| Market Dynamics |
|
| Competitive Landscape |
|
| Companies Covered |
|
Datasheet
One User
USD 2,999
USD 2,699
tax inclusive*
Single User License
One User
USD 4,399
USD 3,959
tax inclusive*
Five User License
Five User
USD 5,599
USD 4,759
tax inclusive*
Corporate License
Unlimited Users
USD 6,659
USD 5,660
tax inclusive*
*Please note that the prices mentioned below are starting prices for each bundle type. Kindly contact our team for further details.*
Flash Bundle
Small Business Bundle
Growth Bundle
Enterprise Bundle
*Please note that the prices mentioned below are starting prices for each bundle type. Kindly contact our team for further details.*
Flash Bundle
Number of Reports: 3
20%
tax inclusive*
Small Business Bundle
Number of Reports: 5
25%
tax inclusive*
Growth Bundle
Number of Reports: 8
30%
tax inclusive*
Enterprise Bundle
Number of Reports: 10
35%
tax inclusive*
How To Order

Select License Type
Choose the right license for your needs and access rights.

Click on ‘Buy Now’
Add the report to your cart with one click and proceed to register.

Select Mode of Payment
Choose a payment option for a secure checkout. You will be redirected accordingly.
Gain insights to stay ahead and seize opportunities.

Get insights & trends for a competitive edge.

Track prices with detailed trend reports.

Analyse trade data for supply chain insights.

Leverage cost reports for smart savings

Enhance supply chain with partnerships.

Connect For More Information
Our expert team of analysts will offer full support and resolve any queries regarding the report, before and after the purchase.
Our expert team of analysts will offer full support and resolve any queries regarding the report, before and after the purchase.
We employ meticulous research methods, blending advanced analytics and expert insights to deliver accurate, actionable industry intelligence, staying ahead of competitors.
Our skilled analysts offer unparalleled competitive advantage with detailed insights on current and emerging markets, ensuring your strategic edge.
We offer an in-depth yet simplified presentation of industry insights and analysis to meet your specific requirements effectively.


Share