

Consumer Insights
Uncover trends and behaviors shaping consumer choices today
Procurement Insights
Optimize your sourcing strategy with key market data
Industry Stats
Stay ahead with the latest trends and market analysis.
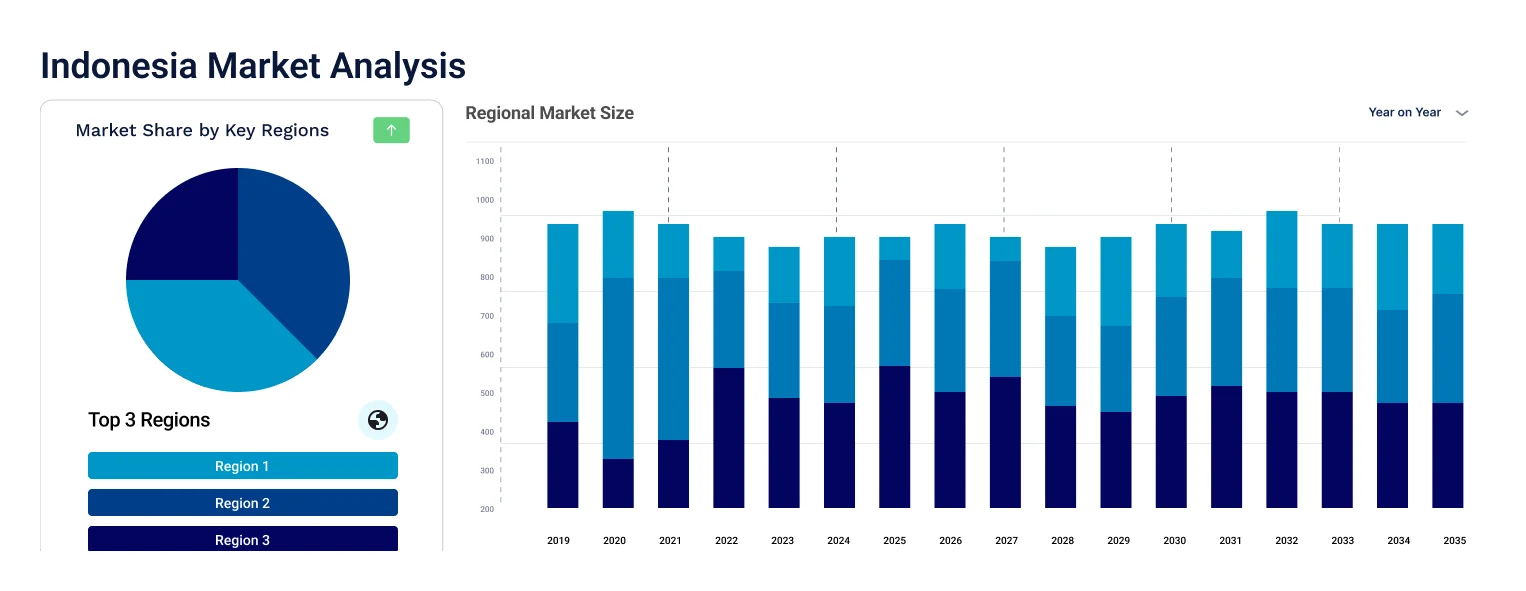
The Indonesia facility management market was valued at USD 12.41 Billion in 2025. The industry is expected to grow at a CAGR of 7.20% during the forecast period of 2026-2035 to reach a value of USD 24.87 Billion by 2035.
The Indonesia facility management (FM) market growth is majorly driven by government efforts like Proyek Strategis Nasional (PSN), a national strategic project plan allocating considerable funds for infrastructure, which directly boosts demand for FM across airports, seaports, and toll roads. Key players in Indonesia’s FM market benefit from PSN through long-term contracts for integrated services at key infrastructure sites. For example, ISS Indonesia secured multi-year facility service agreements for Jakarta’s transport terminals in 2024, ensuring steady revenue and market positioning in public infrastructure management.
Further accelerating the market is the launch of Indonesia’s Green Building Council's smart building certification in 2023 that has prompted corporates to outsource FM to firms with tech-integrated services, boosting the demand in the Indonesia facility management market. A noticeable shift toward energy-efficient buildings, reinforced by Law No. 28/2002 on Building Construction, is compelling companies to embed predictive maintenance, IoT sensors, and centralized energy dashboards into their facilities.
Moreover, the Indonesian government’s "Gerakan 100 Smart Cities Program targeting full implementation by 2045, is encouraging innovation, further boosting Indonesia facility management market dynamics. With urban infrastructure requiring scalable, technology-first facility services, players are exploring drone-based inspections, AI-powered HVAC optimization, and robotic cleaning technologies to remain relevant and competitive.
Compound Annual Growth Rate
7.2%
Value in USD Billion
2026-2035
Read more about this report - REQUEST FREE SAMPLE COPY IN PDF
| Indonesia Facility Management Market Report Summary |
Description |
Value |
|
Base Year |
USD Billion |
2025 |
|
Historical Period |
USD Billion |
2019-2025 |
|
Forecast Period |
USD Billion |
2026-2035 |
|
Market Size 2025 |
USD Billion |
12.41 |
|
Market Size 2035 |
USD Billion |
24.87 |
|
CAGR 2019-2025 |
Percentage |
XX% |
|
CAGR 2026-2035 |
Percentage |
7.20% |
|
CAGR 2026-2035 - Market by Sector |
Private |
8.1% |
|
CAGR 2026-2035 - Market by Service |
Soft Services |
7.5% |
|
CAGR 2026-2035 - Market by Form |
Out-Sourced |
7.9% |
SEG Solar opened a new PV cell manufacturing plant on the Indonesian island of Java. The company announced the successful launch of the USD 480 million factory's first production line. The facility's initial product is an n-type solar cell that was developed in-house. This enhances opportunities for energy-efficient FM integration and sustainability compliance across industrial sites in Indonesia.
OCS Indonesia, a prominent provider of facility services and facilities management (FM), partnered with Diversey, a Solenis brand, to highlight key FM trends pertinent to Indonesia's different industries. The event, headlined "Global Facilities Management Trends in the 2024 Indonesian Market," brought together industry experts, leaders, and OCS Indonesia's main account clients. The event showcased growing demand for integrated FM solutions, aligning with Indonesia's evolving commercial property and healthcare sectors.
OCS Group Indonesia, a leading integrated facilities management (FM) provider, announced expanded food catering services in Indonesia through a strategic agreement with Sunshine Food Group (SFG). This collaboration allows OCS to provide high-quality food services while also expanding SFG's superior healthcare catering capabilities to other hospitals and exposing the Maxx Coffee brand to various facilities throughout Indonesia. This diversification strengthens soft FM services such as catering and hospitality, boosting value-added offerings in healthcare and corporate segments.
ATALIAN Global Services Indonesia launched a new office with an Innovation Space. The branch office relocation and growth are in response to demand for technology-based and sector-specific FM solutions in East Java Province. The move underscores regional FM growth and rising adoption of tech-driven facility operations across industrial and commercial hubs.
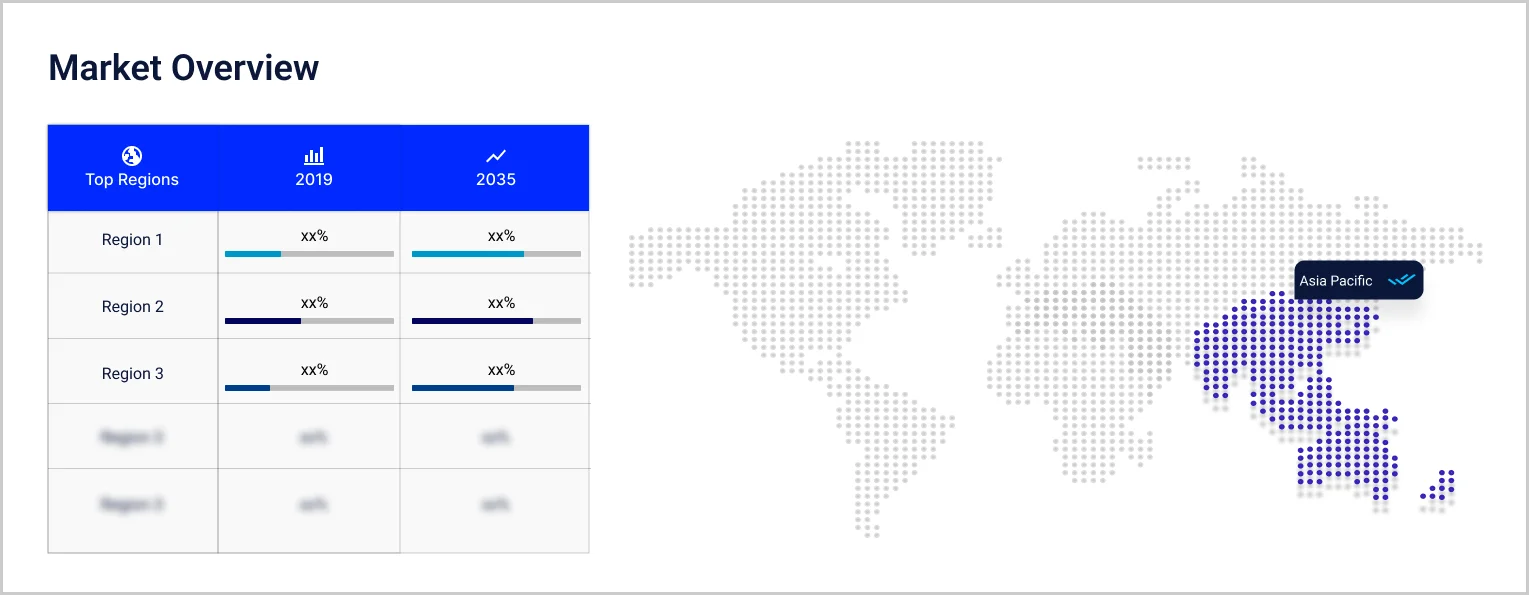
The ambitious infrastructure projects in the country are powering up demand in the Indonesia facility management market, particularly through high-impact smart city initiatives in Jakarta, Bandung, and Surabaya. These urban hubs are seeing an explosion of high-rise commercial and residential complexes, airports, and transport hubs, amplifying the demand for services like HVAC, energy, waste, and security management. According to the Ministry of National Development Planning, Indonesia plans to build 100 smart cities by 2045, aligned with the RPJMN 2020–2024 agenda which allocated IDR 6,445 trillion for infrastructure development. This surge has caught the eye of global FM players like Sodexo and CBRE, who are entering partnerships with local authorities to deliver integrated services.
Outsourcing FM functions is on the rise across Indonesia’s corporate landscape, with multinational companies, IT parks, and large-scale factories leading the trend. This trend is emerging fast in the Indonesia facility management market as it offers cost efficiency, access to skilled talent, and simplified vendor coordination. Outsourced FM providers now deliver Integrated HR + Smart Resource (SR) bundles that feature real-time monitoring and predictive maintenance. According to a Jakarta Post analysis, SMEs are increasingly turning to scalable FM solutions to extend the lifecycle of their properties without incurring high capital expenditure.
A sharp pivot from siloed service models toward Integrated Facility Management (IFM) is shaping the Indonesia facility management market dynamics. IFM models allow organizations to centralize services, like cleaning, HVAC, and security, under a single vendor with unified contracts and outcomes. This is especially noticeable in urban malls and transport terminals in Jakarta and Surabaya, where FM providers use IoT-based predictive maintenance and data dashboards to preempt equipment failure and reduce energy usage. This trend is driven by ESG-conscious organizations seeking operational transparency and environmental accountability.
Leading players now deploy IoT sensors, cloud platforms, and AI algorithms to boost service delivery and cut inefficiencies. Smart campuses like Universitas Indonesia have embedded real-time occupancy and environmental tracking tools, enabling smarter space utilization. The growth in PropTech startups like Tada and Go-Property further accelerates this trend, offering modular technology platforms for FM optimization. These innovations help facility managers shift from reactive to predictive strategies, which is critical in sectors like healthcare and education, where uptime and compliance are non-negotiable, thereby driving the Indonesia facility management market revenues.
Sustainability has emerged to be business imperative in the Indonesia facility management market. The Indonesia Green Building Council reportedly expects a 40% increase in green-certified commercial properties, driven by government incentives and rising stakeholder pressure. Facility managers are now integrating green cleaning protocols, renewable energy systems, and LEED-aligned waste management practices. Companies like JLL Indonesia and ISS Indonesia have launched eco-focused FM packages targeting malls, airports, and hospitality chains. These packages include carbon footprint audits and smart water conservation systems.
The EMR’s report titled “Indonesia Facility Management Market Report and Forecast 2026-2035” offers a detailed analysis of the market based on the following segments:
Market Breakup by Type
Key Insight: In-house facility management remains dominant in government institutions and large enterprises that prefer retaining full control to having dedicated teams internally managing building maintenance, security, and energy consumption, thereby accelerating the Indonesia facility management market value. Close adherence to organizational policies and faster decision-making characterize this model. However, it is also resource intensive, which makes it generally suitable for institutions with sufficient scale and budget, such as hospitals, public sector undertakings, and major universities.
Market Breakup by Sector
Key Insight: The public sector dominance in the Indonesia facility management market is technology-driven. Facilities like Soekarno-Hatta International Airport are embedding real-time building analytics in their FM processes. A pilot project by the Ministry of Health deployed robotic sanitation in five hospitals. Government bodies are drafting FM-specific RFPs that include clauses on technology integration, uptime SLAs, and data sharing frameworks. Local councils are even testing drone-based asset monitoring in flood-prone zones to boost infrastructure maintenance.
Market Breakup by Services
Key Insight: Hard services occupy a sizeable share in the Indonesia facility management market. A notable advancement is the rise of Building Operating Systems (BOS), where vendors integrate HVAC, fire safety, and lighting into one AI-managed dashboard. This is being tested in high-rise offices in South Jakarta. Facility managers can receive predictive alerts on transformer faults or water pressure anomalies before breakdowns, by using this system. The long-term contracts for such services often include shared KPIs on energy efficiency, carbon footprint, and downtime.
Market Breakup by Enterprise Size
Key Insight: Large enterprises have continued to be dominant in the Indonesia facility management market. Telkom Indonesia, for instance, has introduced energy dashboards across several facilities, tracking real-time usage and occupancy. Banks are following suit by installing biometric-secured server for room access managed under FM SLAs. Moreover, contracts are evolving from service logs to data-integrated insights. The focus is shifting from cost reduction to strategic business continuity and ESG reporting, making FM a board-level concern rather than a back-office line item.
Market Breakup by Industry Vertical
Key Insight: The facility management market growth is heavily boosted by the BFSI sector, wherein the management is becoming an integral part of the customer journey, with smart scent diffusion and AI-aided queuing systems already live in select branches. FM vendors are embedding machine learning to predict ATM footfall. Some banks even track real-time occupancy to improve energy efficiency during off-peak hours.
Read more about this report - REQUEST FREE SAMPLE COPY IN PDF
By Type, the In-house Segment Accounts for the Bigger Market Share
In-house FM continues to dominate the Indonesia facility management market, especially among state-run facilities and legacy corporate buildings. Companies prefer retaining internal control over sensitive operational areas, particularly in banking and defense. The Indonesian Real Estate Association revealed that a considerable number of public institutions still manage FM internally, citing better data confidentiality and real-time accountability. However, this dominance faces cost-efficiency challenges. With rising inflation and labor costs, large enterprises are slowly blending internal oversight with partial outsourcing.
Outsourced facility management is gaining ground within the Indonesia facility management market, among commercial offices, malls, and private hospitals. This type of management promises reduced capital and operational burdens. Global and regional players are tying up with local vendors to provide tailor-made, scalable solutions. FM vendors like ISS Indonesia and JLL are offering bundled AI-enhanced packages, from predictive HVAC servicing to energy analytics. Moreover, new labor regulations like UU Cipta Kerja (Omnibus Law) simplify outsourcing compliance, enabling SMEs and MNCs alike to scale FM services rapidly. This trend is being reinforced by a growing gig economy and better regulatory frameworks for service providers managing multiple locations.
By Sector, the Public Segment Holds the Dominant Position in the Market
The public sector largely contributes to the Indonesia facility management market revenue, with infrastructure investments. Government agencies managing airports, healthcare facilities, and educational campuses remain the largest FM consumers. A key development is the FM integration into Jakarta’s LRT and MRT projects, where service-level agreements now mandate uptime metrics tied to FM vendor performance. Even in regional cities like Makassar and Medan, FM vendors are contracted to deploy AI-based lighting controls and waste management optimization.
The private sector’s demand for facility management is growing at a fast pace, particularly in co-working spaces, logistics hubs, and data centers. For instance, in 2024, over 150,000 sqm of new office space was added in Jakarta. FM players are responding with real-time space utilization tools, smart washroom sensors, and integrated ESG reporting systems. Moreover, private firms are investing in circadian lighting, air purification technology, and digital concierge services to boost employee retention.
By Services, Hard Services Account for the Largest Share of the Market
Hard services, especially HVAC, electrical, and fire safety, hold the dominant share in the Indonesia facility management market. The country’s tropical climate demands year-round HVAC usage, making smart climate control a necessity. Moreover, there is also a strong government push to integrate energy-efficient retrofits in old buildings, supported by the Green Retrofit Program. These services are in demand across manufacturing parks and the aging building.
Soft services like hygiene, landscaping, and pest control are witnessing faster adoption, especially in post-pandemic facilities prioritizing health, adding to the Indonesia facility management market value. With growing commercial and healthcare real estate, vendors are bundling soft services with health certifications like ISO 45001 and SNI Clean. A 2023 initiative by the Ministry of Health mandates digital logbooks for hospital sanitation audits, automatically boosting technology integration in soft FM services. The hospitality industry is investing in aromatherapy HVAC filters, indoor air quality monitoring, and AI-enabled restroom supply management. Such innovations are transforming mundane services into high-impact offerings that directly influence occupant experience and brand image.
|
CAGR 2026-2035 - Market by |
Service |
| Soft Services |
7.5% |
| Hard Services |
XX% |
By Enterprise Size, Large Enterprises Register the Leading Position in the Market
Large enterprises account for the majority of the Indonesia facility management market revenue, with most adopting integrated FM (IFM) models. Companies in telecom, banking, and manufacturing sectors now use central command centers to manage multiple sites in real time. Multi-year FM contracts feature performance-based clauses, incentivizing vendors to align with enterprise ESG goals. Even tech unicorns are integrating FM analytics into their business dashboards, merging facility data with employee productivity and occupancy insights.
The SME segment, despite its cost-conscious nature, is increasingly outsourcing FM to simplify compliance and scale operations, accelerating the facility management market opportunities in Indonesia. With over 64 million MSMEs active in the country, tech-enabled FM firms offer modular packages tailored to micro-industrial units and budget hotels. Cloud-based CMMS tools also come with Bahasa language support and pay-as-you-go pricing, making them SME-friendly. Government programs like UMKM Digital are indirectly fueling FM outsourcing by promoting digital-first operations, which require specialized upkeep.
By Industry Verticals, Banking, Financial Services, and Insurance Hold the Dominant Revenue Share
The BFSI sector is the most advanced adopter of FM innovations in Indonesia. Considering regulatory compliance and customer experience, banks and insurers are integrating AI-led surveillance, biometric entry, and humidity-controlled server rooms. Facility managers now work with cybersecurity teams to secure ATM kiosks and branch networks under FM supervision. Insurers are also using FM data to calculate building risk scores, tying it to underwriting practices. This alignment of physical and digital infrastructure is boosting the demand for facility management in financial institutions.
The healthcare vertical is rapidly emerging as a significant niche in the Indonesia facility management market, due to stringent compliance and growing infrastructure. Hospital FM now includes temperature-mapped storage rooms for vaccines, robotic floor cleaners in ICUs, and AI-driven waste disposal monitoring. The Ministry of Health’s Hospital Accreditation 2.0 program mandates tech-supported facility operations, opening up opportunities for FM vendors. Firms like Sodexo are deploying AI-based hygiene audits, integrating with national health data platforms. Even rural clinics are adopting smart asset tracking to manage equipment uptime, cutting repair costs and minimizing service outages.
The Indonesia facility management market players like ISS, JLL, Sodexo, and CBRE are focusing on data integration, predictive analytics, and ESG compliance. There has been a noticeable shift from transactional services to performance-based contracts. Many firms are also targeting niche markets. For example, Sodexo is targeting healthcare, ISS is aiming for education, and CBRE is focused on data centers. Local startups are gaining traction by offering ultra-customized, mobile-first solutions for SMEs. The rise of B2B marketplaces for FM procurement is another innovation, giving buyers price transparency and vendor performance histories. The Indonesia facility management companies are offering green building certifications, energy audits, and retrofitting. Technology-driven energy and asset management are emerging as competitive differentiators. Another important area of focus for companies is training and certification for the workforce. Opportunity exists in regional cities where tech penetration is low, but FM requirements are high. Cross-border players are also eyeing Indonesia as a hub for ASEAN FM operations.
CBRE established in 1906, has its headquarters located in Dallas, Texas. The company is one of the leading global players in facility management services. CBRE focuses on integrated solutions, technology adoption, and sustainability consulting to support large commercial real estate portfolios in Indonesia.
Founded in 1910 and located in Chicago, Illinois, Cushman Wakefield provides facility management with great asset optimization. Cushman is using analytics and remote monitoring in Indonesia to enhance the performance across office and retail space.
ISS A/S ISS, founded in 1901 in Copenhagen, Denmark, offers full facility and workplace experience services. The company’s offered services are directed towards workforce training, hygiene excellence, and integrated services for healthcare and educational sectors.
Headquartered in Chicago and founded in 1999, JLL is well known for real estate and facility services. In Indonesia, JLL is imparting smart facility management solutions to corporate clients using IoT platforms for predictive maintenance and energy optimization.
*Please note that this is only a partial list; the complete list of key players is available in the full report. Additionally, the list of key players can be customized to better suit your needs.*
Other key players in the market are OCS Group Holdings Ltd., PT. SGS Indonesia (SGS SA), Sodexo Group, AEON Group, and PT. Spektra Solusindo, among others.
Explore the latest trends shaping the Indonesia facility management Market 2026-2035 with our in-depth report. Gain strategic insights, future forecasts, and key market developments that can help you stay competitive. Download a free sample report or contact our team for customized consultation on Indonesia facility management Market trends 2026.
Upto 15% Off
USD
$2499 $2249
$3999 $3599
$4999 $4249
$5999 $5099


*While we strive to always give you current and accurate information, the numbers depicted on the website are indicative and may differ from the actual numbers in the main report. At Expert Market Research, we aim to bring you the latest insights and trends in the market. Using our analyses and forecasts, stakeholders can understand the market dynamics, navigate challenges, and capitalize on opportunities to make data-driven strategic decisions.*
In 2025, the Indonesia facility management market reached an approximate value of USD 12.41 Billion.
The market is projected to grow at a CAGR of 7.20% between 2026 and 2035.
The key players in the market include CBRE Inc., Cushman & Wakefield PLC, ISS A/S, Jones Lang LaSalle Inc., OCS Group Holdings Ltd., PT. SGS Indonesia (SGS SA), Sodexo Group, AEON Group, and PT. Spektra Solusindo, among others.
Key strategies driving the market include digitizing asset monitoring, adopting ESG scoring, offering mobile-first interfaces, training FM staff in analytics, and creating scalable solutions for tier-2 cities.
The key challenges are high dependency on manual processes, fragmented vendor base, low tech adoption in tier-2 cities, regulatory uncertainty, and rising operational costs.
Explore our key highlights of the report and gain a concise overview of key findings, trends, and actionable insights that will empower your strategic decisions.
| REPORT FEATURES | DETAILS |
| Base Year | 2025 |
| Historical Period | 2019-2025 |
| Forecast Period | 2026-2035 |
| Scope of the Report |
Historical and Forecast Trends, Industry Drivers and Constraints, Historical and Forecast Market Analysis by Segment:
|
| Breakup by Type |
|
| Breakup by Sector |
|
| Breakup by Services |
|
| Breakup by Enterprise Size |
|
| Breakup by Industry Vertical |
|
| Market Dynamics |
|
| Competitive Landscape |
|
| Companies Covered |
|
Datasheet
One User
USD 2,499
USD 2,249
tax inclusive*
Single User License
One User
USD 3,999
USD 3,599
tax inclusive*
Five User License
Five User
USD 4,999
USD 4,249
tax inclusive*
Corporate License
Unlimited Users
USD 5,999
USD 5,099
tax inclusive*
*Please note that the prices mentioned below are starting prices for each bundle type. Kindly contact our team for further details.*
Flash Bundle
Small Business Bundle
Growth Bundle
Enterprise Bundle
*Please note that the prices mentioned below are starting prices for each bundle type. Kindly contact our team for further details.*
Flash Bundle
Number of Reports: 3
20%
tax inclusive*
Small Business Bundle
Number of Reports: 5
25%
tax inclusive*
Growth Bundle
Number of Reports: 8
30%
tax inclusive*
Enterprise Bundle
Number of Reports: 10
35%
tax inclusive*
How To Order

Select License Type
Choose the right license for your needs and access rights.

Click on ‘Buy Now’
Add the report to your cart with one click and proceed to register.

Select Mode of Payment
Choose a payment option for a secure checkout. You will be redirected accordingly.
Strategic Solutions for Informed Decision-Making
Gain insights to stay ahead and seize opportunities.

Get insights & trends for a competitive edge.

Track prices with detailed trend reports.

Analyse trade data for supply chain insights.

Leverage cost reports for smart savings

Enhance supply chain with partnerships.

Connect For More Information
Our expert team of analysts will offer full support and resolve any queries regarding the report, before and after the purchase.
Our expert team of analysts will offer full support and resolve any queries regarding the report, before and after the purchase.
We employ meticulous research methods, blending advanced analytics and expert insights to deliver accurate, actionable industry intelligence, staying ahead of competitors.
Our skilled analysts offer unparalleled competitive advantage with detailed insights on current and emerging markets, ensuring your strategic edge.
We offer an in-depth yet simplified presentation of industry insights and analysis to meet your specific requirements effectively.


