Reports
Reports
The global indoor entertainment centres market is expected to grow at a CAGR of about 11% in the forecast period of 2023-2028.
Read more about this report - REQUEST FREE SAMPLE COPY IN PDF
The indoor entertainment centres market growth is being driven by the rising technological advancements. North America leads the market. However, the industry is expected to grow at a faster rate in the Asia Pacific region.
An indoor entertainment centre is a small amusement park that is marketed for families with small children to teenagers and is often entirely indoor or associated with a larger operation, such as a theme park. They usually cater to sub-regional markets of larger metropolitan areas.
Read more about this report - REQUEST FREE SAMPLE COPY IN PDF
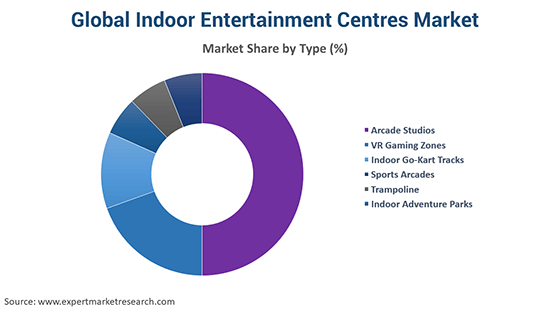
Based on types, the market can be divided into the following:
The facility size can be segmented as follows:
The market can be broadly categorised based on its revenue source into:
The EMR report looks into the regional markets like North America, Latin America, Europe, the Middle East and Africa, and the Asia Pacific.
Read more about this report - REQUEST FREE SAMPLE COPY IN PDF
The rise in disposable incomes of the consumers, the availability of diversified gaming and entertainment options, and the favourable demographic trends among young people in the Asia-Pacific region are driving the growth of the demand for indoor entertainment centres.
The leading type of centres is the arcade studios, which are expected to continue to dominate the indoor entertainment centres market in the forecast period as well.
Due to various economic factors, ticket prices at entertainment centres continually increase. Ticket prices will also differ depending on the location of family entertainment centres, which also hinders the market’s growth in revenues during the projected period.
The report presents a detailed analysis of the following key players in the global indoor entertainment centres market, looking into their capacity, market shares, and latest developments like capacity expansions, plant turnarounds, and mergers and acquisitions:
The EMR report gives an in-depth insight into the market by providing a SWOT analysis as well as an analysis of Porter’s Five Forces model.
REPORT FEATURES | DETAILS |
---|---|
Base Year | 2022 |
Historical Period | 2018-2022 |
Forecast Period | 2023-2028 |
Scope of the Report | Historical and Forecast Trends, Industry Drivers and Constraints, Historical and Forecast Market Analysis by Segment- Type, Facility Size, Revenue Source, Region |
Breakup by Type | Arcade Studios, VR Gaming Zones, Indoor Go-Kart Tracks, Sports Arcades, Trampoline, Indoor Adventure Parks |
Breakup by Facility Size | <5,000 Sq. Feet, 5,001 to 10,000 Sq. Feet, 10,001 to 20,000 Sq. Feet, 20,001 to 40,000 Sq. Feet, >40,000 Sq. Feet |
Breakup by Revenue Source | Entry Fees and Ticket Sales, Food and Beverages, Merchandising, Advertisement, Others |
Breakup by Region | North America, Europe, Asia Pacific, Latin America, Middle East and Africa |
Market Dynamics | SWOT, Porter's Five Forces, Key Indicators for Price and Demand |
Competitive Landscape | Market Structure, Company Profiles- Company Overview, Product Portfolio, Demographic Reach and Achievements, Certifications |
Companies Covered | CEC Entertainment, Inc., CAVU Designwerks Inc, Main Event Entertainment, Legoland Discovery Centers US LLC, Scene 75 Entertainment Centers, Others |
Report Price and Purchase Option | Explore our purchase options that are best suited to your resources and industry needs. |
Delivery Format | Delivered as an attached PDF and Excel through email, with an option of receiving an editable PPT, according to the purchase option. |
*At Expert Market Research, we strive to always give you current and accurate information. The numbers depicted in the description are indicative and may differ from the actual numbers in the final EMR report.
1 Preface
2 Report Coverage – Key Segmentation and Scope
3 Report Description
3.1 Market Definition and Outlook
3.2 Properties and Applications
3.3 Market Analysis
3.4 Key Players
4 Key Assumptions
5 Executive Summary
5.1 Overview
5.2 Key Drivers
5.3 Key Developments
5.4 Competitive Structure
5.5 Key Industrial Trends
6 Snapshot
6.1 Global
6.2 Regional
7 Opportunities and Challenges in the Market
8 Global Indoor Entertainment Centres Market Analysis
8.1 Key Industry Highlights
8.2 Global Indoor Entertainment Centres Historical Market (2018-2022)
8.3 Global Indoor Entertainment Centres Market Forecast (2023-2028)
8.4 Global Indoor Entertainment Centres Market by Type
8.4.1 Arcade Studios
8.4.1.1 Market Share
8.4.1.2 Historical Trend (2018-2022)
8.4.1.3 Forecast Trend (2023-2028)
8.4.2 VR Gaming Zones
8.4.2.1 Market Share
8.4.2.2 Historical Trend (2018-2022)
8.4.2.3 Forecast Trend (2023-2028)
8.4.3 Indoor Go-Kart Tracks
8.4.3.1 Market Share
8.4.3.2 Historical Trend (2018-2022)
8.4.3.3 Forecast Trend (2023-2028)
8.4.4 Sports Arcades
8.4.4.1 Market Share
8.4.4.2 Historical Trend (2018-2022)
8.4.4.3 Forecast Trend (2023-2028)
8.4.5 Trampoline
8.4.5.1 Market Share
8.4.5.2 Historical Trend (2018-2022)
8.4.5.3 Forecast Trend (2023-2028)
8.4.6 Indoor Adventure Parks
8.4.6.1 Market Share
8.4.6.2 Historical Trend (2018-2022)
8.4.6.3 Forecast Trend (2023-2028)
8.5 Global Indoor Entertainment Centres Market by Facility Size
8.5.1 <5,000 Sq. Feet
8.5.1.1 Market Share
8.5.1.2 Historical Trend (2018-2022)
8.5.1.3 Forecast Trend (2023-2028)
8.5.2 5,001 to 10,000 Sq. Feet
8.5.2.1 Market Share
8.5.2.2 Historical Trend (2018-2022)
8.5.2.3 Forecast Trend (2023-2028)
8.5.3 10,001 to 20,000 Sq. Feet
8.5.3.1 Market Share
8.5.3.2 Historical Trend (2018-2022)
8.5.3.3 Forecast Trend (2023-2028)
8.5.4 20,001 to 40,000 Sq. Feet
8.5.4.1 Market Share
8.5.4.2 Historical Trend (2018-2022)
8.5.4.3 Forecast Trend (2023-2028)
8.5.5 >40,000 Sq. Feet
8.5.5.1 Market Share
8.5.5.2 Historical Trend (2018-2022)
8.5.5.3 Forecast Trend (2023-2028)
8.6 Global Indoor Entertainment Centres Market by Revenue Source
8.6.1 Entry Fees and Ticket Sales
8.6.1.1 Market Share
8.6.1.2 Historical Trend (2018-2022)
8.6.1.3 Forecast Trend (2023-2028)
8.6.2 Food and Beverages
8.6.2.1 Market Share
8.6.2.2 Historical Trend (2018-2022)
8.6.2.3 Forecast Trend (2023-2028)
8.6.3 Merchandising
8.6.3.1 Market Share
8.6.3.2 Historical Trend (2018-2022)
8.6.3.3 Forecast Trend (2023-2028)
8.6.4 Advertisement
8.6.4.1 Market Share
8.6.4.2 Historical Trend (2018-2022)
8.6.4.3 Forecast Trend (2023-2028)
8.6.5 Others
8.7 Global Indoor Entertainment Centres Market by Region
8.7.1 North America
8.7.1.1 Market Share
8.7.1.2 Historical Trend (2018-2022)
8.7.1.3 Forecast Trend (2023-2028)
8.7.2 Europe
8.7.2.1 Market Share
8.7.2.2 Historical Trend (2018-2022)
8.7.2.3 Forecast Trend (2023-2028)
8.7.3 Asia Pacific
8.7.3.1 Market Share
8.7.3.2 Historical Trend (2018-2022)
8.7.3.3 Forecast Trend (2023-2028)
8.7.4 Latin America
8.7.4.1 Market Share
8.7.4.2 Historical Trend (2018-2022)
8.7.4.3 Forecast Trend (2023-2028)
8.7.5 Middle East and Africa
8.7.5.1 Market Share
8.7.5.2 Historical Trend (2018-2022)
8.7.5.3 Forecast Trend (2023-2028)
9 North America Indoor Entertainment Centres Market Analysis
9.1 United States of America
9.1.1 Market Share
9.1.2 Historical Trend (2018-2022)
9.1.3 Forecast Trend (2023-2028)
9.2 Canada
9.2.1 Market Share
9.2.2 Historical Trend (2018-2022)
9.2.3 Forecast Trend (2023-2028)
10 Europe Indoor Entertainment Centres Market Analysis
10.1 United Kingdom
10.1.1 Market Share
10.1.2 Historical Trend (2018-2022)
10.1.3 Forecast Trend (2023-2028)
10.2 Germany
10.2.1 Market Share
10.2.2 Historical Trend (2018-2022)
10.2.3 Forecast Trend (2023-2028)
10.3 France
10.3.1 Market Share
10.3.2 Historical Trend (2018-2022)
10.3.3 Forecast Trend (2023-2028)
10.4 Italy
10.4.1 Market Share
10.4.2 Historical Trend (2018-2022)
10.4.3 Forecast Trend (2023-2028)
10.5 Others
11 Asia Pacific Indoor Entertainment Centres Market Analysis
11.1 China
11.1.1 Market Share
11.1.2 Historical Trend (2018-2022)
11.1.3 Forecast Trend (2023-2028)
11.2 Japan
11.2.1 Market Share
11.2.2 Historical Trend (2018-2022)
11.2.3 Forecast Trend (2023-2028)
11.3 India
11.3.1 Market Share
11.3.2 Historical Trend (2018-2022)
11.3.3 Forecast Trend (2023-2028)
11.4 ASEAN
11.4.1 Market Share
11.4.2 Historical Trend (2018-2022)
11.4.3 Forecast Trend (2023-2028)
11.5 Australia
11.5.1 Market Share
11.5.2 Historical Trend (2018-2022)
11.5.3 Forecast Trend (2023-2028)
11.6 Others
12 Latin America Indoor Entertainment Centres Market Analysis
12.1 Brazil
12.1.1 Market Share
12.1.2 Historical Trend (2018-2022)
12.1.3 Forecast Trend (2023-2028)
12.2 Argentina
12.2.1 Market Share
12.2.2 Historical Trend (2018-2022)
12.2.3 Forecast Trend (2023-2028)
12.3 Mexico
12.3.1 Market Share
12.3.2 Historical Trend (2018-2022)
12.3.3 Forecast Trend (2023-2028)
12.4 Others
13 Middle East and Africa Indoor Entertainment Centres Market Analysis
13.1 Saudi Arabia
13.1.1 Market Share
13.1.2 Historical Trend (2018-2022)
13.1.3 Forecast Trend (2023-2028)
13.2 United Arab Emirates
13.2.1 Market Share
13.2.2 Historical Trend (2018-2022)
13.2.3 Forecast Trend (2023-2028)
13.3 Nigeria
13.3.1 Market Share
13.3.2 Historical Trend (2018-2022)
13.3.3 Forecast Trend (2023-2028)
13.4 South Africa
13.4.1 Market Share
13.4.2 Historical Trend (2018-2022)
13.4.3 Forecast Trend (2023-2028)
13.5 Others
14 Market Dynamics
14.1 SWOT Analysis
14.1.1 Strengths
14.1.2 Weaknesses
14.1.3 Opportunities
14.1.4 Threats
14.2 Porter’s Five Forces Analysis
14.2.1 Supplier’s Power
14.2.2 Buyer’s Power
14.2.3 Threat of New Entrants
14.2.4 Degree of Rivalry
14.2.5 Threat of Substitutes
14.3 Key Indicators for Demand
14.4 Key Indicators for Price
15 Value Chain Analysis
16 Competitive Landscape
16.1 Market Structure
16.2 Company Profiles
16.2.1 CEC Entertainment, Inc.
16.2.1.1 Company Overview
16.2.1.2 Product Portfolio
16.2.1.3 Demographic Reach and Achievements
16.2.1.4 Certifications
16.2.2 CAVU Designwerks Inc
16.2.2.1 Company Overview
16.2.2.2 Product Portfolio
16.2.2.3 Demographic Reach and Achievements
16.2.2.4 Certifications
16.2.3 Main Event Entertainment
16.2.3.1 Company Overview
16.2.3.2 Product Portfolio
16.2.3.3 Demographic Reach and Achievements
16.2.3.4 Certifications
16.2.4 Legoland Discovery Centers US LLC
16.2.4.1 Company Overview
16.2.4.2 Product Portfolio
16.2.4.3 Demographic Reach and Achievements
16.2.4.4 Certifications
16.2.5 Scene 75 Entertainment Centers
16.2.5.1 Company Overview
16.2.5.2 Product Portfolio
16.2.5.3 Demographic Reach and Achievements
16.2.5.4 Certifications
16.2.5 Others
17 Key Trends and Developments in the Market
List of Key Figures and Tables
1. Global Indoor Entertainment Centres Market: Key Industry Highlights, 2018 and 2028
2. Global Indoor Entertainment Centres Historical Market: Breakup by Type (USD Million), 2018-2022
3. Global Indoor Entertainment Centres Market Forecast: Breakup by Type (USD Million), 2023-2028
4. Global Indoor Entertainment Centres Historical Market: Breakup by Facility Size (USD Million), 2018-2022
5. Global Indoor Entertainment Centres Market Forecast: Breakup by Facility Size (USD Million), 2023-2028
6. Global Indoor Entertainment Centres Historical Market: Breakup by Revenue Source (USD Million), 2018-2022
7. Global Indoor Entertainment Centres Market Forecast: Breakup by Revenue Source (USD Million), 2023-2028
8. Global Indoor Entertainment Centres Historical Market: Breakup by Region (USD Million), 2018-2022
9. Global Indoor Entertainment Centres Market Forecast: Breakup by Region (USD Million), 2023-2028
10. North America Indoor Entertainment Centres Historical Market: Breakup by Country (USD Million), 2018-2022
11. North America Indoor Entertainment Centres Market Forecast: Breakup by Country (USD Million), 2023-2028
12. Europe Indoor Entertainment Centres Historical Market: Breakup by Country (USD Million), 2018-2022
13. Europe Indoor Entertainment Centres Market Forecast: Breakup by Country (USD Million), 2023-2028
14. Asia Pacific Indoor Entertainment Centres Historical Market: Breakup by Country (USD Million), 2018-2022
15. Asia Pacific Indoor Entertainment Centres Market Forecast: Breakup by Country (USD Million), 2023-2028
16. Latin America Indoor Entertainment Centres Historical Market: Breakup by Country (USD Million), 2018-2022
17. Latin America Indoor Entertainment Centres Market Forecast: Breakup by Country (USD Million), 2023-2028
18. Middle East and Africa Indoor Entertainment Centres Historical Market: Breakup by Country (USD Million), 2018-2022
19. Middle East and Africa Indoor Entertainment Centres Market Forecast: Breakup by Country (USD Million), 2023-2028
20. Global Indoor Entertainment Centres Market Structure
The market is estimated to witness a healthy growth at a CAGR of 11% in the forecast period of 2023-2028.
The major drivers of the market include the technological advancements and rising disposable incomes, growing popularity of arcade games and amusement parks, growing GDP, and rising middle-class population.
The increasing availability of diversified gaming and entertainment options and the favourable demographic trends among young people are the key trends guiding the growth of the industry.
The major regions in the industry are North America, Latin America, the Middle East and Africa, Europe, and the Asia Pacific, with North America accounting for the largest share in the market.
Arcade studios, VR gaming zones, indoor go-kart tracks, sports arcades, trampoline, and indoor adventure parks are the major types of the product in the market.
<5,000sq. feet, 5,001 to 10,000 sq. feet, 10,001 to 20,000 sq. feet, 20,001 to 40,000 sq. feet and >40,000 sq. feet are the different sizes of facility in the market.
Entry fees and ticket sales, food and beverage, merchandising, and advertisement, among others are the significant revenue sources of the product in the market.
The major players in the industry are CEC Entertainment, Inc., CAVU Designwerks Inc, Main Event Entertainment, Legoland Discovery Centers US LLC, and Scene 75 Entertainment Centers, among others.
The global indoor entertainment centres market has been driven by the increasing availability of diversified gaming and entertainment options in the historical period. Aided by the technological advancements and favourable demographic trends among young people, the market is anticipated to grow at a CAGR of 11% in the forecast period during 2023-2028.
EMR’s meticulous research methodology delves deep into the market, covering the macro and micro aspects of the industry. Based on types, the market is divided into Arcade studios, VR gaming zones, indoor go-kart tracks, sports arcades and trampoline, and indoor adventure parks. Based on facility sizes, the market is divided into <5,000sq. feet, 5,001 to 10,000 sq. feet, 10,001 to 20,000 sq. feet, 20,001 to 40,000 sq. feet and >40,000 sq. feet. Based on revenue source, the market is divided into entry fees and ticket sales, food and beverage, merchandising, and advertisement, among others. The major regional markets for indoor entertainment centres market are North America, Europe, the Asia Pacific, Latin America, and the Middle East and Africa, with North America accounting for the largest share in the market. The key players in the above market include CEC Entertainment, Inc., CAVU Designwerks Inc, Main Event Entertainment, Legoland Discovery Centers US LLC, and Scene 75 Entertainment Centers, among others.
EMR’s research methodology uses a combination of cutting-edge analytical tools and the expertise of their highly accomplished team, thus, providing their customers with market insights that are accurate, actionable, and help them remain ahead of their competition.
Mini Report
Single User License
Five User License
Corporate License
Any Question? Speak With An Analyst
View A Sample
Did You Miss Anything, Ask Now
Right People
We are technically excellent, strategic, practical, experienced and efficient; our analysts are hand-picked based on having the right attributes to work successfully and execute projects based on your expectations.
Right Methodology
We leverage our cutting-edge technology, our access to trusted databases, and our knowledge of the current models used in the market to deliver you research solutions that are tailored to your needs and put you ahead of the curve.
Right Price
We deliver in-depth and superior quality research in prices that are reasonable, unmatchable, and shows our understanding of your resource structure. We, additionally, offer attractive discounts on our upcoming reports.
Right Support
Our team of expert analysts are at your beck and call to deliver you optimum results that are customised to meet your precise needs within the specified timeframe and help you form a better understanding of the industry.