

Consumer Insights
Uncover trends and behaviors shaping consumer choices today
Procurement Insights
Optimize your sourcing strategy with key market data
Industry Stats
Stay ahead with the latest trends and market analysis.
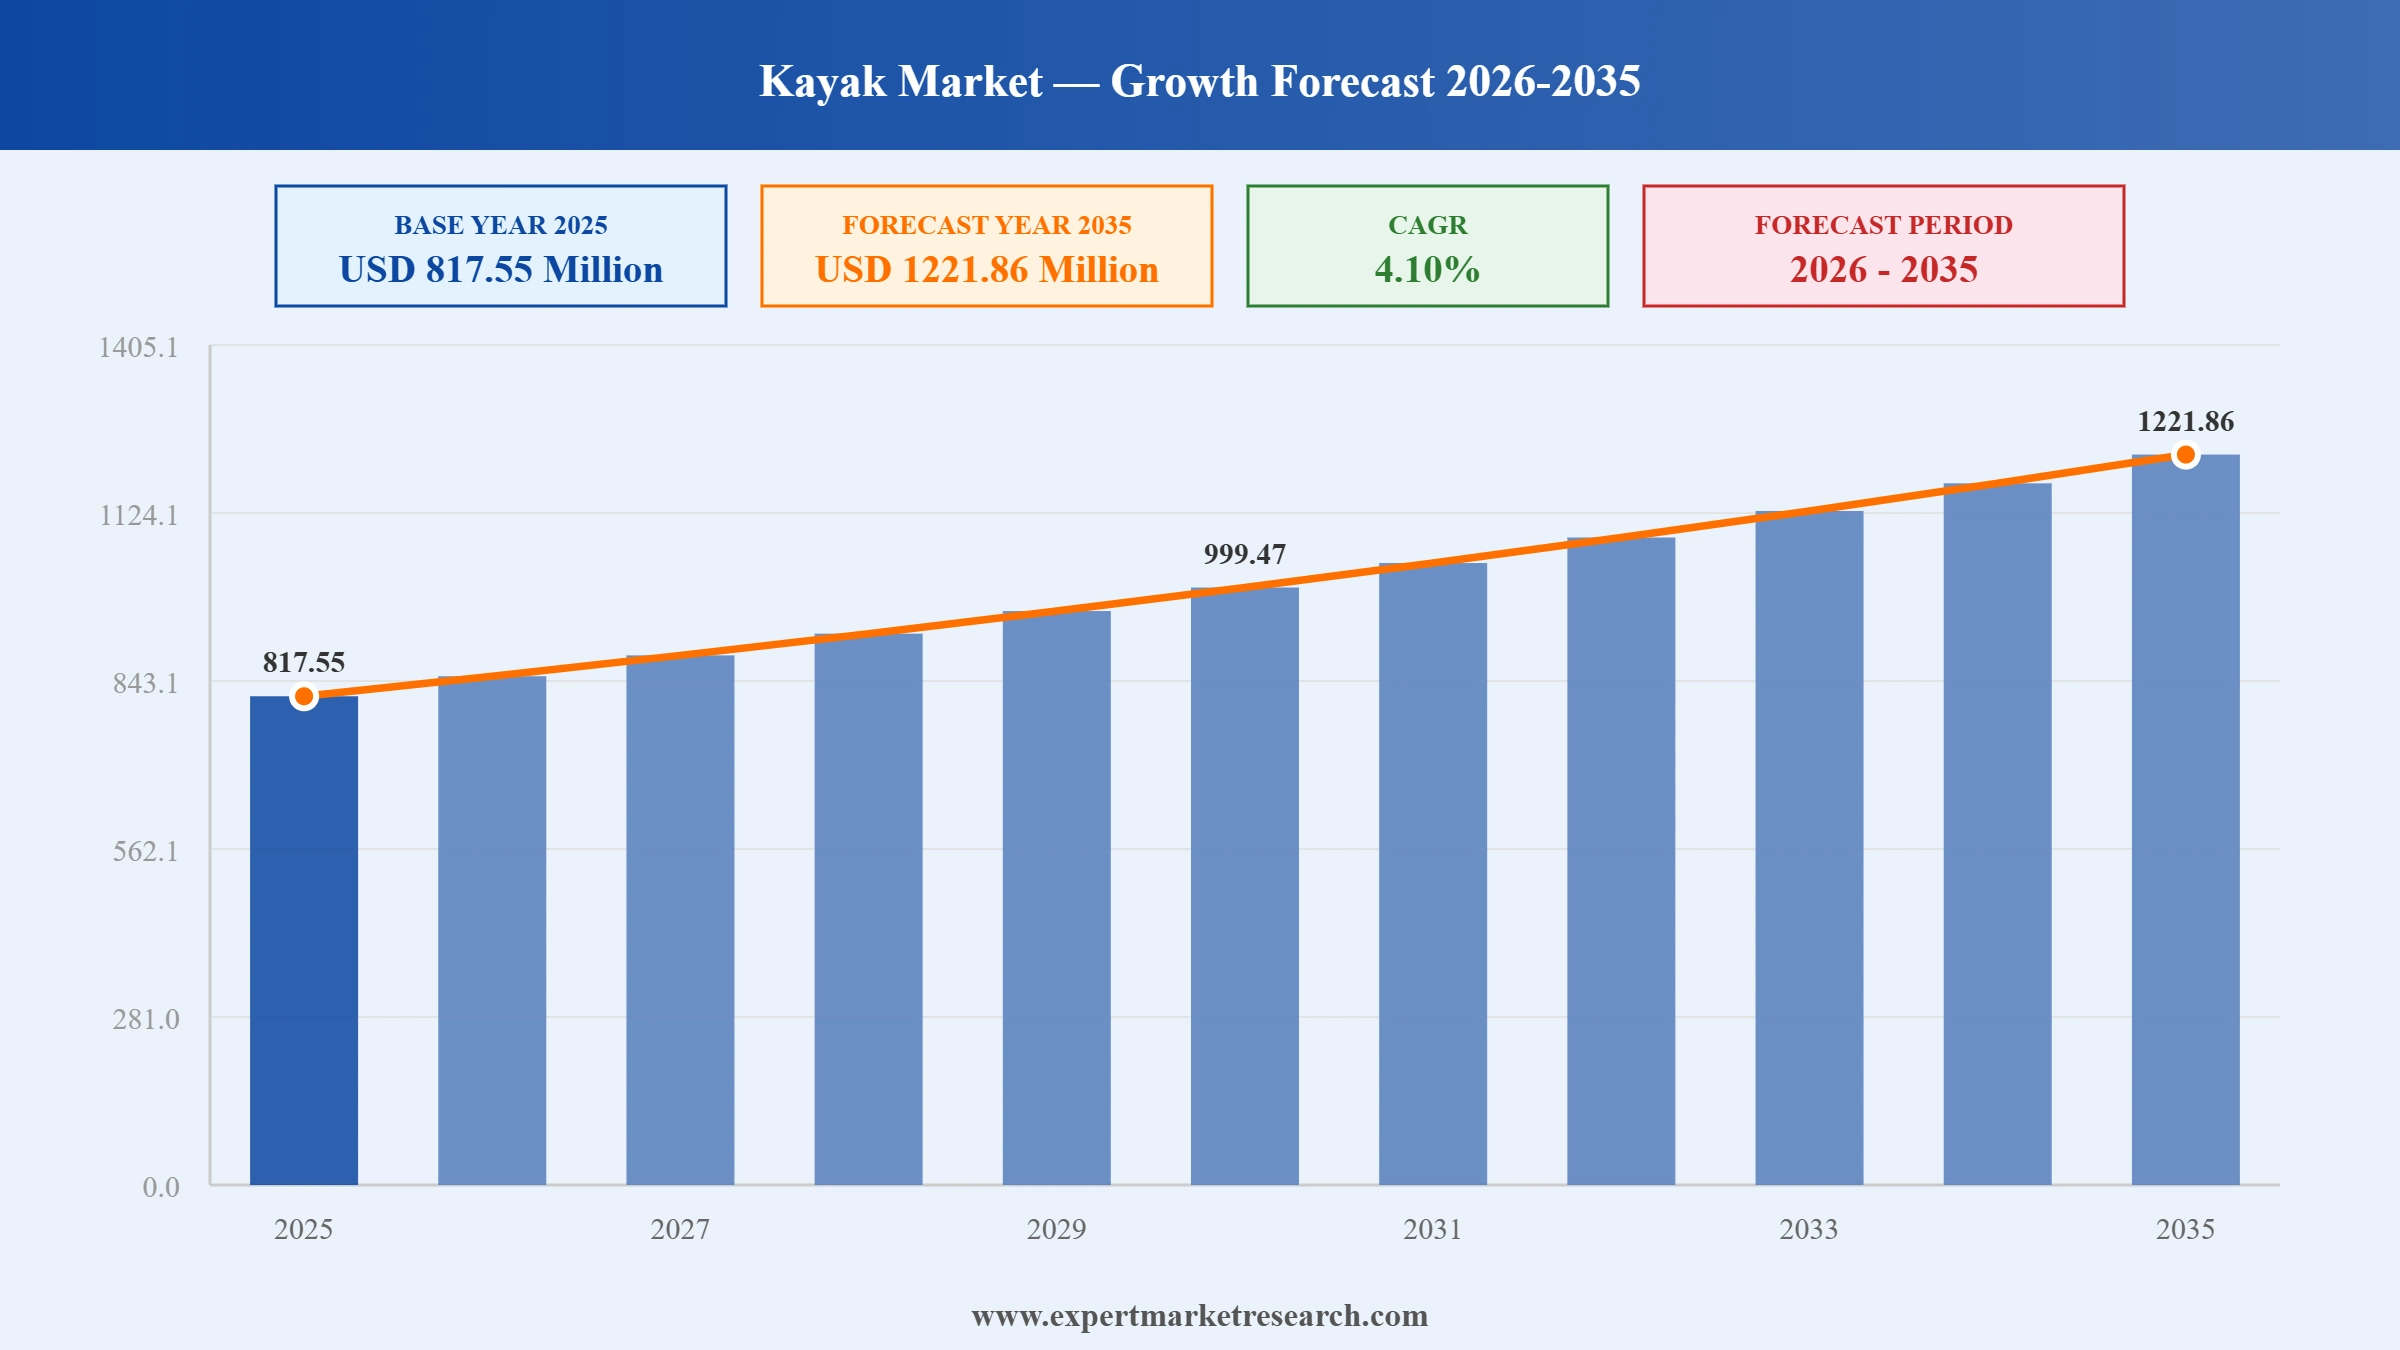
The Global Kayak Market reached a value of USD 817.55 Million at 2025 and is projected to expand at a CAGR of around 4.10% during the forecast period of 2026-2035. With rising participation in recreational paddlesports, expanding adventure tourism globally, growing adoption of innovative kayak designs including inflatable and foldable formats, and increasing demand for eco-friendly outdoor recreation equipment, the market is expected to reach USD 1221.86 Million by 2035.
Read more about this report - REQUEST FREE SAMPLE COPY IN PDF
| Global Kayak Market Report Summary | Description | Value |
| Base Year | USD Million | 2025 |
| Historical Period | USD Million | 2019-2025 |
| Forecast Period | USD Million | 2026-2035 |
| Market Size 2025 | USD Million | 817.55 |
| Market Size 2035 | USD Million | 1221.86 |
| CAGR 2019-2025 | Percentage | XX% |
| CAGR 2026-2035 | Percentage | 4.10% |
| CAGR 2026-2035 - Market by Region | Asia Pacific | 4.6% |
| CAGR 2026-2035 - Market by Country | India | 4.8% |
| CAGR 2026-2035 - Market by Country | Brazil | 4.5% |
| CAGR 2026-2035 - Market by Product Type | Recreational | 4.9% |
| CAGR 2026-2035 - Market by Buyer Type | Direct-To-Customer Online Channel | 5.3% |
| Market Share by Country 2025 | Australia | 2.3% |
The global kayak market is being shaped by several powerful trends, including a surge in adventure and eco-tourism, adoption of innovative materials and foldable designs, growing fitness-oriented outdoor participation, and the rising influence of social media on outdoor recreation choices. These forces are collectively expanding the global kayaking participant base beyond traditional enthusiast demographics.
In February 2026, Jackson Kayak completed the acquisition of Eddyline Kayaks, a premium manufacturer well regarded for its lightweight thermoformed ABS kayak construction. The acquisition led to the relocation of Eddyline's production operations from Mexico to Jackson Kayak's facility in Sparta, Tennessee, aimed at improving supply chain efficiency and product quality control. The transaction strengthens Jackson Kayak's product portfolio by adding Eddyline's technically advanced, lightweight recreational and touring kayak range, consolidating its position as one of North America's most diversified and vertically integrated kayak manufacturers.
In May 2024, Jackson Kayak, headquartered in Sparta, Tennessee, completed the acquisition of Werner Paddles, one of North America's most recognised paddle brands. The transaction consolidates two specialty outdoor brands under a single ownership structure while maintaining separate sales and marketing operations. Production of Werner paddles is transitioning to Jackson Kayak's Tennessee facility. Both companies are committed to continuing their focus on specialty retail channels and premium product quality, with the deal reflecting the ongoing consolidation trend among North American paddlesports equipment manufacturers seeking to broaden their product portfolios.
In 2024, Oru Kayak introduced the Lake+ Series, a foldable kayak weighing under 8 kilograms with an assembly time of under 10 minutes and an ergonomic design suited for calm water recreational paddling. The product sold over 48,000 units in its first six months following launch, demonstrating strong consumer appetite for portable and easily stored kayak solutions among urban paddlers, apartment residents, and travelers. The Lake+ Series exemplifies the broader market shift toward lightweight, compact kayak formats that lower the participation barrier and broaden the addressable consumer base for recreational paddling globally.
In February 2024, Oru Kayak, the origami-inspired foldable kayak specialist, launched a significant upgrade to its product range by introducing electric motor capability developed in partnership with Bixpy Motors. The collaboration equipped Oru's foldable kayaks with a lightweight electric-assist propulsion system, enhancing maneuverability and extending time on water while retaining the portability central to the Oru product offering. The launch represents a noteworthy convergence of innovation in materials science and propulsion technology, positioning Oru Kayak at the leading edge of the growing segment of accessible, tech-enhanced recreational paddling equipment.
In October 2023, Sanborn Canoe Co. announced the acquisition of Current Designs Kayaks, a long-established manufacturer recognised for pioneering sea kayak development since the late 1970s. The transaction expands Sanborn Canoe's portfolio into high-performance composite kayaks designed for sea kayaking enthusiasts and experienced paddlers. Current Designs' reputation for meticulously crafted, high-quality vessels is expected to strengthen Sanborn's premium positioning and broaden its appeal across both recreational paddlers and thrill-seeking consumers seeking performance sea kayaks for challenging water conditions.
The rapid growth of adventure tourism and nature-based travel is a primary catalyst for global kayak market growth. As travellers increasingly seek distinctive, sustainable, and physically engaging experiences, kayaking has emerged as a leading activity in guided eco-tours, resort programmes, and national park visitor experiences worldwide. In 2024, approximately 285 million people engaged in international travel during Q1 alone, reflecting continued recovery and growth in global tourism. Kayaking's low environmental footprint and accessibility for beginners make it a natural fit for the expanding ecotourism segment, which is driving fleet expansion by rental operators, tour companies, and resort facilities across coastal and inland water destinations.
Lightweight, compact kayak formats, including foldable origami-inspired designs and inflatable models, are rapidly expanding the global addressable market by removing key barriers of storage, transportation, and cost. Inflatable kayak sales grew approximately 15% in 2024 globally, and over 350,000 foldable kayaks were sold in 2023, up 26% year-over-year. In February 2024, Oru Kayak's launch of electric-assist capability on its foldable range demonstrated how portability and technology are converging to create a new category of premium, versatile recreational kayaks. Global Kayak Market growth is being directly supported by these accessible product formats, which are attracting urban consumers, apartment dwellers, and travelers who previously faced storage constraints.
Kayak fishing has evolved from a niche activity into a commercially significant market segment, driving demand for purpose-built vessels equipped with rod holders, gear tracks, sonar mounts, and pedal-drive propulsion systems. Over 310,000 fishing kayaks were sold globally in 2023, and pedal-powered models grew 12% as anglers seek hands-free paddling while actively fishing. Manufacturers including Hobie Cat Company, Johnson Outdoors, and Jackson Kayak have invested significantly in specialist fishing kayak development, with premium models commanding considerably higher price points than recreational variants. The segment's growth is creating differentiated revenue streams and improving average selling prices across major kayak manufacturers.
Consumer demand for environmentally responsible outdoor products is driving kayak manufacturers toward sustainable material strategies, including recycled polymers, plant-based resins, and responsibly sourced wood construction. In 2024, companies including Pelican International and Oru Kayak highlighted sustainability as a core brand positioning element, responding to growing consumer expectations among millennial and Gen Z outdoor enthusiasts. This shift aligns with broader trends in the outdoor recreation industry, where brand reputation for environmental responsibility increasingly influences purchasing decisions. Regulatory pressure in key markets including the European Union is also accelerating the adoption of greener manufacturing practices across the global kayak supply chain.
"Global Kayak Market Report and Forecast 2026-2035" offers a detailed analysis of the market based on the following segments:
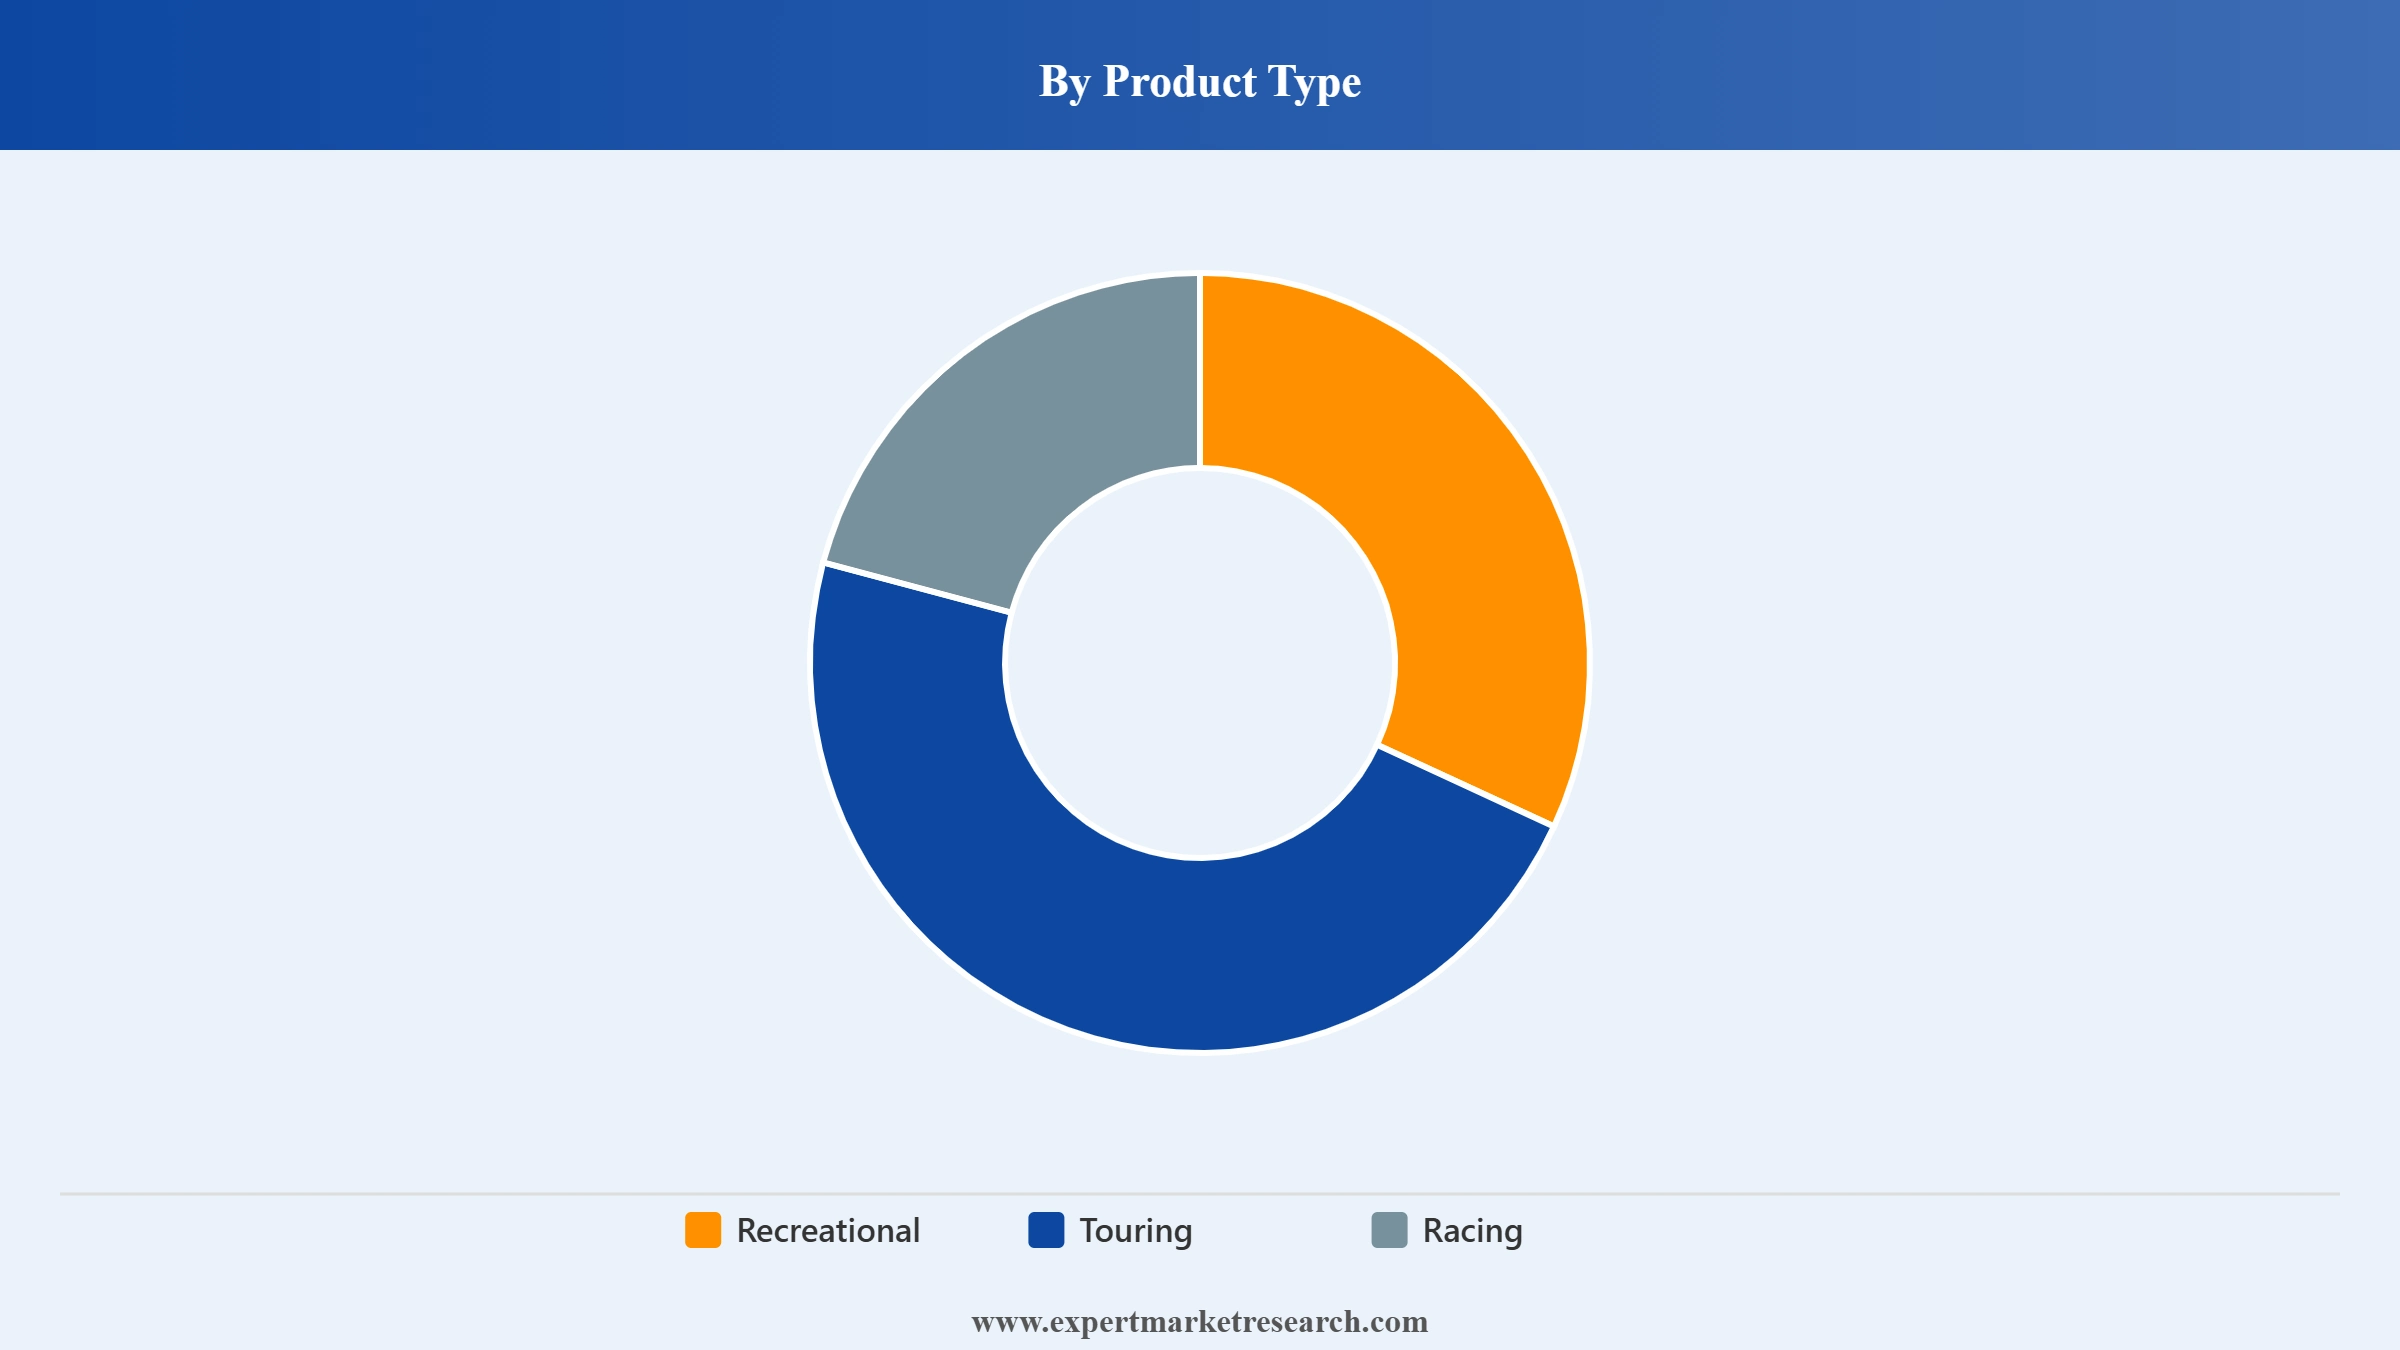
Market Breakup by Product Type
Key Insight: The Recreational segment dominates the global kayak market by product type, accounting for approximately 37% or more of total market share by volume, underpinned by its broad appeal across all skill levels and its suitability for calm water activities including lake paddling, coastal exploration, and leisure fitness. The segment is projected to grow at a CAGR of 4.9% through 2035, as adventure tourism and health-conscious outdoor participation fuel new entrant demand. Manufacturers such as Pelican International, Oru Kayak, and KL Outdoor have made recreational kayaks the centrepiece of their product strategies, releasing new models annually featuring improved stability, lighter materials, and ergonomic seating for family and casual users.
Market Breakup by Buyer Type
Key Insight: The Sports Variety Stores segment dominates the global kayak market by buyer type, capturing the largest market share owing to the consumer preference for physical inspection, expert in-store guidance, and the immediate availability of bulky equipment. However, the Direct-To-Customer (DTC) Online Channel and Third-Party Online Channels are projected to witness the fastest growth during the forecast period through 2035. This rapid expansion is driven by the rising penetration of e-commerce, attractive online discounts, flexible delivery options, and the increasing trend of manufacturers selling directly to end-users to enhance profit margins. Major players are strategically expanding their digital footprint while maintaining partnerships with prominent sports retail chains like Decathlon and REI to cater to both offline and online consumer bases.
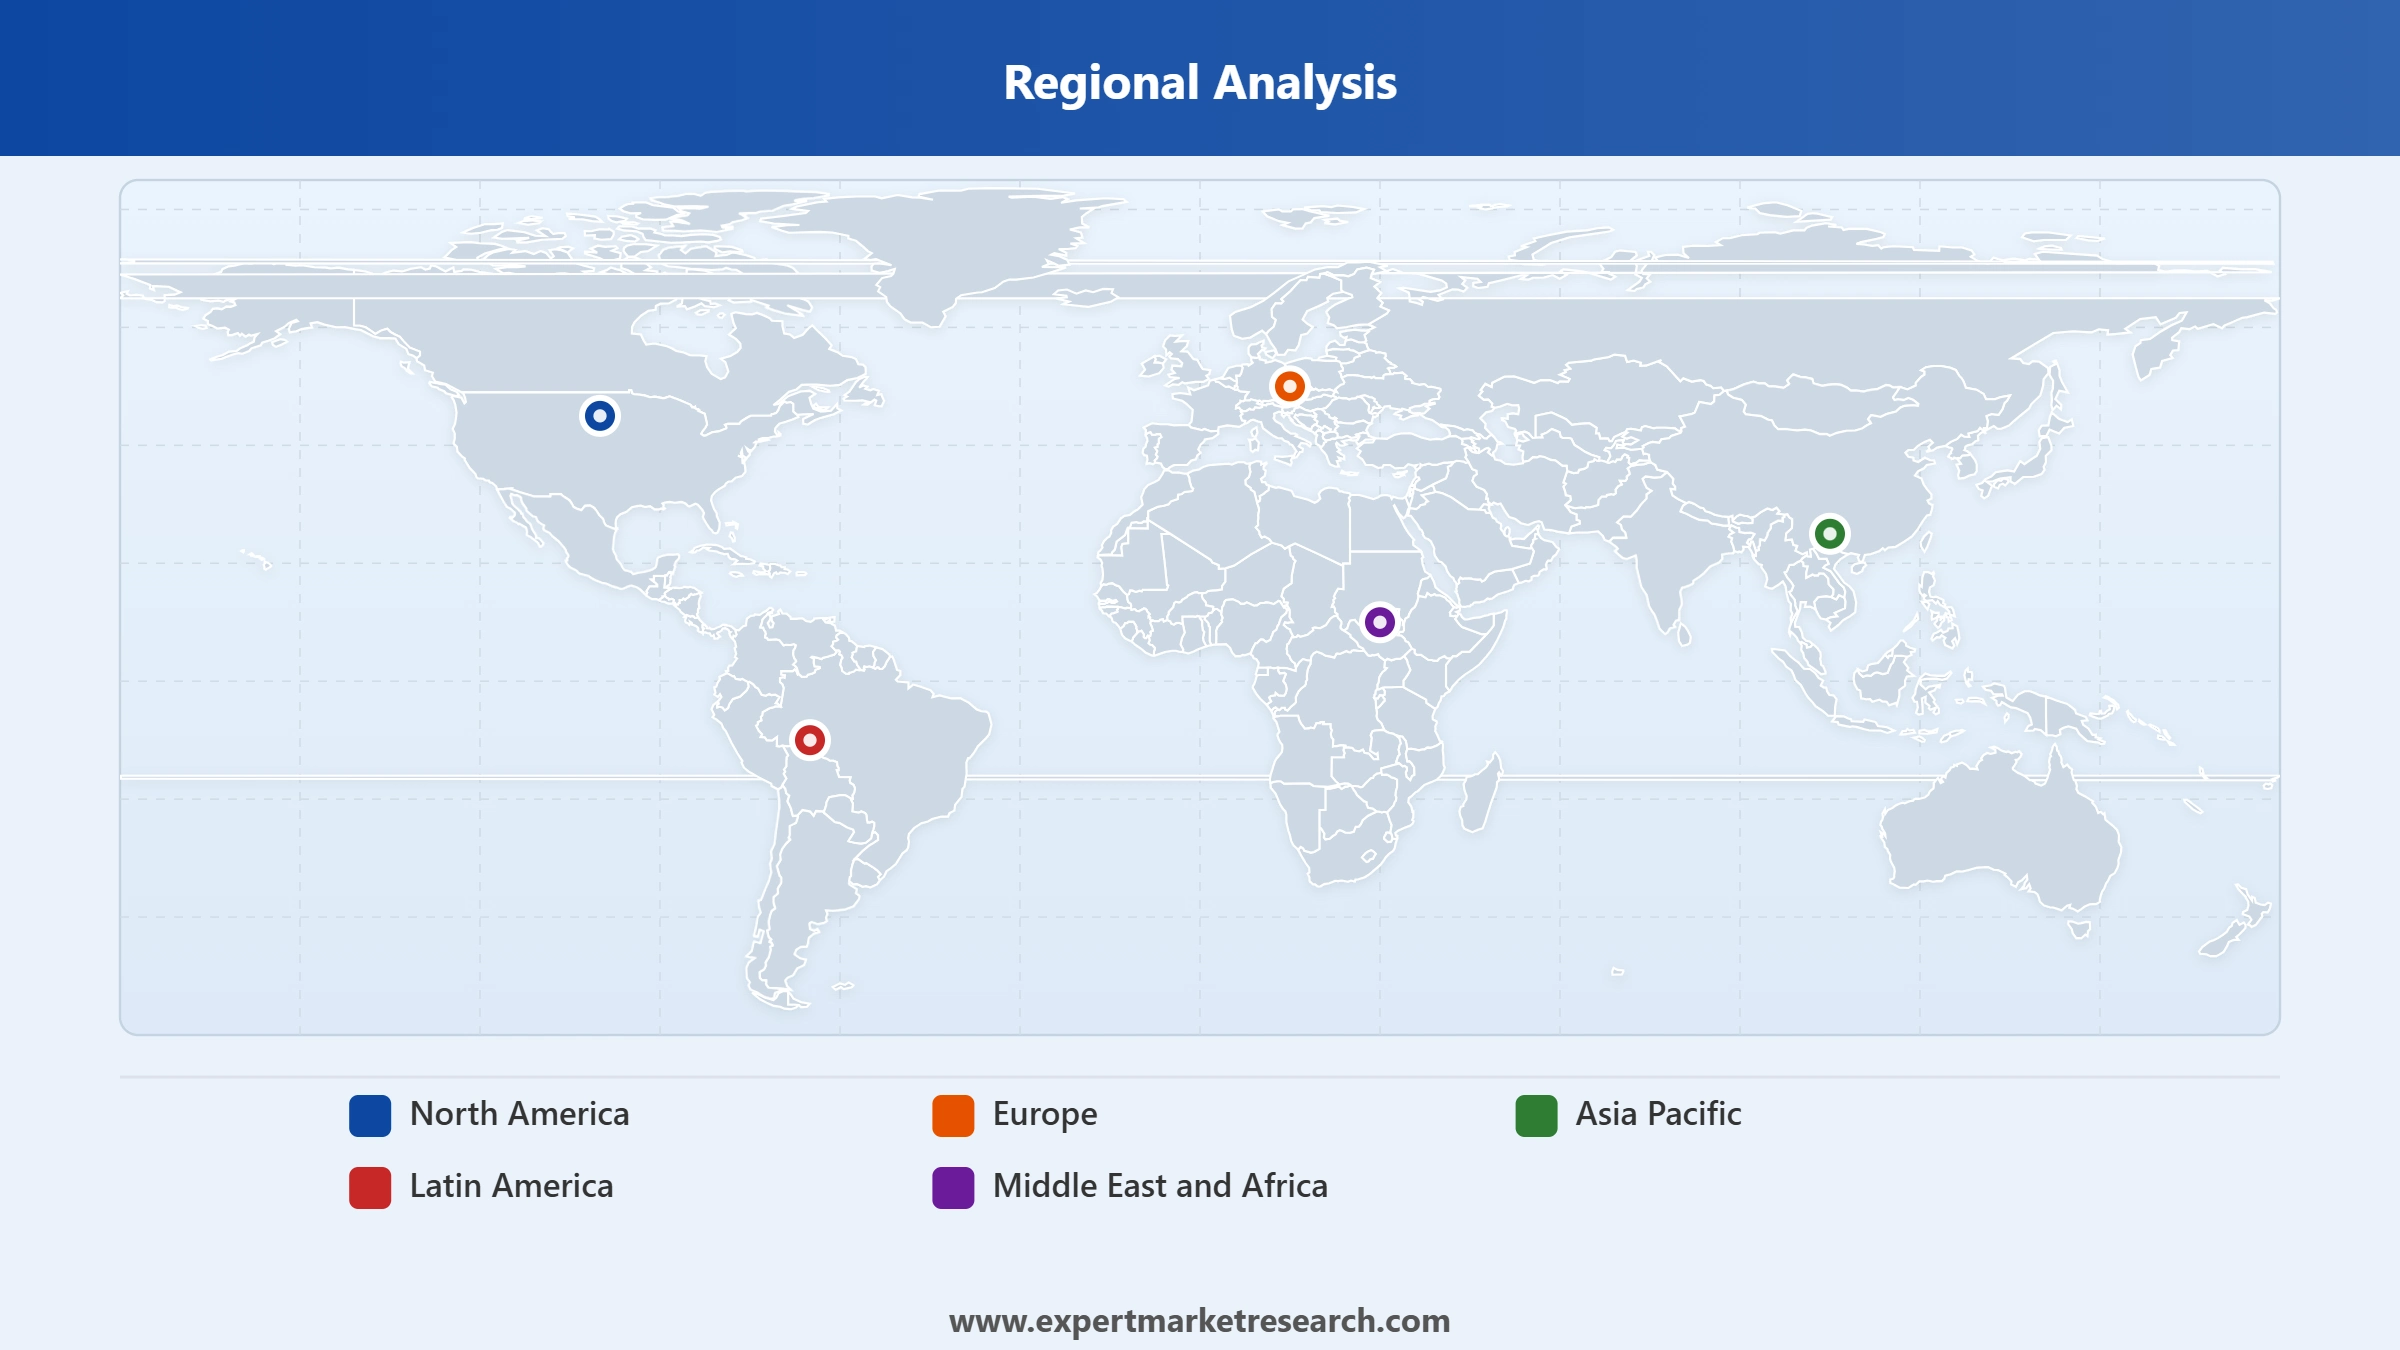
Market Breakup by Region
Key Insight: North America leads the global kayak market in absolute revenue terms, driven by over 18 million annual paddlesports participants in the United States, a mature retail infrastructure, and well-established outdoor recreation culture supported by national and state park systems. The region benefits from a large network of rivers, lakes, and coastal areas that sustain year-round demand across recreational, fishing, and touring kayak segments. Asia Pacific is the fastest-growing regional market, with rising disposable incomes, government investment in adventure tourism infrastructure, and rapid expansion of water-based leisure activities in China, Australia, Japan, and Southeast Asian coastal markets driving robust compound growth through 2035.


Read more about this report - REQUEST FREE SAMPLE COPY IN PDF
The Recreational product type holds the dominant position within the global kayak market, estimated at approximately 37% of total market volume in the historical period. Its supremacy reflects the sheer breadth of the target consumer base, ranging from families seeking weekend leisure activities to fitness enthusiasts using kayaking as a low-impact cardiovascular workout. The recreational segment's appeal is reinforced by its lower price entry point compared to touring and racing variants, and by the expanding range of inflatable and foldable recreational models that have removed the storage and transportation barriers that previously deterred casual adopters. Major manufacturers have concentrated their R&D investment here, resulting in a steady pipeline of new models year after year.
Read more about this report - REQUEST FREE SAMPLE COPY IN PDF
North America holds the leading regional share of the global kayak market, supported by the United States' position as the single largest national kayak market globally with over 18 million active annual participants. The Outdoor Industry Association's 2022 Outdoor Participation Trends Report identified kayaking as the highest-ranked water sport in the US, reflecting its deep cultural embedding in American outdoor recreation. The region's dominance is further cemented by the presence of leading manufacturers including Johnson Outdoors, Jackson Kayak, and Pelican International, all headquartered in North America, along with a robust specialty retail network and an established tradition of government-supported outdoor recreational programming.
North America maintains its position as the world's largest and most mature kayak market, driven by a uniquely strong cultural affinity for paddlesports that spans recreational paddling, kayak fishing, sea kayaking, and competitive whitewater sports. The United States accounts for the majority of regional revenues, with Canada contributing significantly through its abundance of freshwater lake systems and national parks that serve as natural kayaking environments. Government programmes including those administered by the US National Park Service actively support paddlesports access, while annual competitions and paddling festivals sustain enthusiast engagement and brand visibility. Major manufacturers including Jackson Kayak, Pelican International, and KL Outdoor are concentrated in the region, enabling fast product iteration cycles and strong specialty retail relationships.
Read more about this report - REQUEST FREE SAMPLE COPY IN PDF
Asia Pacific is the fastest-growing regional market for kayaks globally, with growth momentum driven by rising disposable incomes in China, Australia, Japan, Thailand, and the Philippines, expanding coastal and inland water tourism infrastructure, and strong government investment in outdoor sports development. The Asia Pacific Tourism Board projected adventure tourism in the region to grow at a CAGR of 14% through 2033, directly expanding the addressable market for kayaks and paddlesports equipment. Japan hosts significant kayaking events including an annual sea kayak competition at Amami Oshima Island in Kagoshima Prefecture, recognised as the largest of its kind in the country. China's growing middle class and the development of lakeside and riverside recreation parks are creating new consumer entry points for recreational kayak ownership across the region.
The global kayak market is moderately fragmented, with a mix of large multinational outdoor equipment companies, regional specialists, and innovative direct-to-consumer brands competing across product type, price, and distribution channel dimensions. North American manufacturers including Johnson Outdoors, Jackson Kayak, and Pelican International hold leading positions by revenue and brand recognition, while European brands such as TAHE and FEELFREE compete strongly in touring and sea kayak categories. Recent M&A activity, including Jackson Kayak's acquisitions of Werner Paddles in 2024 and Eddyline Kayaks in 2026, reflects the growing strategic importance of portfolio breadth and vertical integration.
Competitive priorities in the market increasingly centre on material innovation, sustainability credentials, digital and direct-to-consumer distribution strategies, and the development of specialty segments including fishing kayaks and electric-assist models. New entrants such as Oru Kayak have disrupted the traditional product landscape by targeting urban consumers with foldable designs, generating strong media coverage and building premium brand positioning through social media and direct-to-consumer channels. The market's competitive intensity is expected to increase as Asia Pacific manufacturers expand globally and as established brands accelerate investment in next-generation product categories.
Founded in 1970 and headquartered in Racine, Wisconsin, Johnson Outdoors is a publicly listed outdoor recreation equipment company. Its Watercraft segment, which includes Old Town Canoe, Ocean Kayak, and Carlisle brands, positions it as a dominant force in the North American kayak market. Johnson Outdoors competes across recreational, fishing, and touring segments, leveraging its scale, brand portfolio, and established specialty retail relationships to maintain leadership across multiple price tiers.
Founded in 1968 and headquartered in Laval, Quebec, Canada, Pelican International is one of the world's largest kayak manufacturers. The company produces a broad range of recreational, fishing, and youth kayaks in high-density polyethylene, targeting value-conscious consumers and beginners. Following its acquisition of Confluence Outdoor in 2022, Pelican became the largest paddlesports company by product portfolio breadth, adding brands including Perception Kayaks and Wilderness Systems.
Founded in 2012 and headquartered in San Francisco, California, Oru Kayak is an innovative direct-to-consumer kayak manufacturer known for its origami-inspired foldable kayak designs. Its products fold from flat-pack form into fully functional kayaks in under 10 minutes, targeting urban consumers, travelers, and apartment dwellers. Oru Kayak's Lake+ Series sold over 48,000 units in its first six months in 2024, and the company's electric-assist partnership with Bixpy Motors demonstrates its commitment to technology-forward product development.
Founded in 2003 and headquartered in Sparta, Tennessee, Jackson Kayak is a leading manufacturer of whitewater, recreational, and fishing kayaks. The company has grown significantly through organic innovation and strategic acquisitions, including Werner Paddles in May 2024 and Eddyline Kayaks in February 2026. Jackson Kayak's strong athlete endorsement relationships and competitive kayaking heritage have built substantial brand equity among serious paddlers, while its broader recreational and fishing kayak lines serve mainstream consumer demand.
Other key players in the market are AIRE, Aqua Xtreme, Clear Blue Hawaii, KL Outdoor LLC, FEELFREE US LLC, TAHE, and Others.
*Please note that this is only a partial list; the complete list of key players is available in the full report. Additionally, the list of key players can be customized to better suit your needs.*
Stay ahead in the Global Kayak Market 2026 with our comprehensive industry report. Explore the latest intelligence on product innovation in recreational and specialty kayaking, regional growth opportunities across North America and Asia Pacific, sustainability trends reshaping manufacturing, and the competitive strategies driving market consolidation. Whether you are an established kayak brand, a retail investor, or a tourism operator expanding your watercraft fleet, our report delivers the clarity and confidence your decisions require. Download your complimentary sample now and explore the growth opportunities shaping global kayaking through 2035.
Upto 15% Off
USD
$2499 $2249
$3999 $3599
$4999 $4249
$5999 $5099


*While we strive to always give you current and accurate information, the numbers depicted on the website are indicative and may differ from the actual numbers in the main report. At Expert Market Research, we aim to bring you the latest insights and trends in the market. Using our analyses and forecasts, stakeholders can understand the market dynamics, navigate challenges, and capitalize on opportunities to make data-driven strategic decisions.*
In 2025, the market attained a value of nearly USD 817.55 Million.
The market is assessed to grow at a CAGR of 4.10% between 2026 and 2035.
The market is estimated to reach around USD 1221.86 Million by 2035.
The market is being driven by rising disposable incomes and rising participation in recreational activities.
The key trends aiding the market expansion include the growth of the tourism sector and rising social media influence.
The major product types of kayaks are recreational, touring, and racing.
The major regions considered in the market are North America, Europe, the Asia Pacific, Latin America, and the Middle East and Africa.
The major players in the market are Johnson Outdoors Inc., AIRE, Aqua Xtreme, Clear Blue Hawaii, KL Outdoor LLC, FEELFREE US LLC, Jackson Kayak, Pelican International Inc., Oru Kayak Inc., and TAHE, among others.
Explore our key highlights of the report and gain a concise overview of key findings, trends, and actionable insights that will empower your strategic decisions.
| REPORT FEATURES | DETAILS |
| Base Year | 2025 |
| Historical Period | 2019-2025 |
| Forecast Period | 2026-2035 |
| Scope of the Report |
Historical and Forecast Trends, Industry Drivers and Constraints, Historical and Forecast Market Analysis by Segment
|
| Breakup by Product Type |
|
| Breakup by Buyer Type |
|
| Breakup by Region |
|
| Market Dynamics |
|
| Competitive Landscape |
|
| Companies Covered |
|
Datasheet
One User
USD 2,499
USD 2,249
tax inclusive*
Single User License
One User
USD 3,999
USD 3,599
tax inclusive*
Five User License
Five User
USD 4,999
USD 4,249
tax inclusive*
Corporate License
Unlimited Users
USD 5,999
USD 5,099
tax inclusive*
*Please note that the prices mentioned below are starting prices for each bundle type. Kindly contact our team for further details.*
Flash Bundle
Small Business Bundle
Growth Bundle
Enterprise Bundle
*Please note that the prices mentioned below are starting prices for each bundle type. Kindly contact our team for further details.*
Flash Bundle
Number of Reports: 3
20%
tax inclusive*
Small Business Bundle
Number of Reports: 5
25%
tax inclusive*
Growth Bundle
Number of Reports: 8
30%
tax inclusive*
Enterprise Bundle
Number of Reports: 10
35%
tax inclusive*
How To Order

Select License Type
Choose the right license for your needs and access rights.

Click on ‘Buy Now’
Add the report to your cart with one click and proceed to register.

Select Mode of Payment
Choose a payment option for a secure checkout. You will be redirected accordingly.
Strategic Solutions for Informed Decision-Making
Gain insights to stay ahead and seize opportunities.

Get insights & trends for a competitive edge.

Track prices with detailed trend reports.

Analyse trade data for supply chain insights.

Leverage cost reports for smart savings

Enhance supply chain with partnerships.

Connect For More Information
Our expert team of analysts will offer full support and resolve any queries regarding the report, before and after the purchase.
Our expert team of analysts will offer full support and resolve any queries regarding the report, before and after the purchase.
We employ meticulous research methods, blending advanced analytics and expert insights to deliver accurate, actionable industry intelligence, staying ahead of competitors.
Our skilled analysts offer unparalleled competitive advantage with detailed insights on current and emerging markets, ensuring your strategic edge.
We offer an in-depth yet simplified presentation of industry insights and analysis to meet your specific requirements effectively.


