

Consumer Insights
Uncover trends and behaviors shaping consumer choices today
Procurement Insights
Optimize your sourcing strategy with key market data
Industry Stats
Stay ahead with the latest trends and market analysis.
The global kiosks market attained USD 36.48 Billion by 2035. The global kiosks market is expected to grow at a CAGR of 11.20% in the forecast period of 2026-2035 to attain USD 105.46 Billion by 2035.
Compound Annual Growth Rate
11.2%
Value in USD Billion
2026-2035
Read more about this report - REQUEST FREE SAMPLE COPY IN PDF
| Global Kiosks Market Report Summary | Description | Value |
| Base Year | USD Billion | 2025 |
| Historical Period | USD Billion | 2019-2025 |
| Forecast Period | USD Billion | 2026-2035 |
| Market Size 2025 | USD Billion | 36.48 |
| Market Size 2035 | USD Billion | 105.46 |
| CAGR 2019-2025 | Percentage | XX% |
| CAGR 2026-2035 | Percentage | 11.20% |
| CAGR 2026-2035 - Market by Region | Asia Pacific | 12.2% |
| CAGR 2026-2035 - Market by Country | India | 12.4% |
| CAGR 2026-2035 - Market by Country | China | 11.7% |
| CAGR 2026-2035 - Market by Type | Interactive | 13.2% |
| CAGR 2026-2035 - Market by Product Type | Self-Service Kiosks | 12.8% |
| Market Share by Country 2025 | Australia | 2.3% |
Region-wise, the Asia Pacific region is significantly supporting the growth of the kiosks industry. This could be attributed to the growth of end use industries like banking and financial industries, convenience store, and food and beverages store. Further, due to advancements in technology and new business model, countries like India, China, Japan, Singapore, and Australia are adapting to self-service technology, which is boosting the growth of the kiosks industry. In addition, a rise in services like self-ticketing, ATMs, food and beverages vending machines, as well as increasing retail industries and changing lifestyle of the people are bolstering the market growth in this region. Moreover, high-tech kiosks are predicted to witness rapid growth over the forecast period.
Read more about this report - REQUEST FREE SAMPLE COPY IN PDF
Kiosks refer to customised computer made for public use so as to offer information and objects and facilitate transactions. These terminals are designed with an aim to empower consumers and businesses to implement automated self-service functions. They enhance the consumer experience and are therefore considered an essential investment for businesses to adopt them in their processes.
Breakup by Type
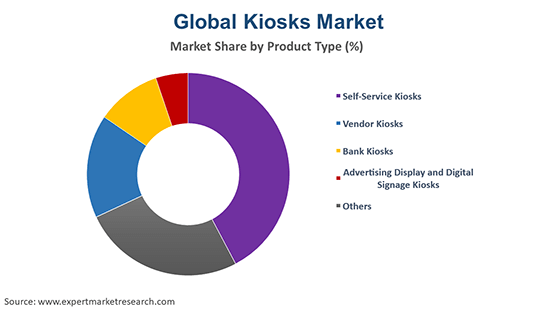
Breakup by Product Type
Breakup by Display Size
Breakup by End User
Breakup by Region
| CAGR 2026-2035 - Market by | Country |
| India | 12.4% |
| China | 11.7% |
| Mexico | 11.5% |
| UK | 11.3% |
| Germany | 10.7% |
| USA | 10.7% |
| Canada | XX% |
| France | XX% |
| Italy | XX% |
| Japan | XX% |


Read more about this report - REQUEST FREE SAMPLE COPY IN PDF
The market for kiosks is driven by the enhanced customer experience offered by the use of kiosks. Further, the usage of kiosks is instrumental in accelerating sales across an extensive range of industries, consequently boosting the use of kiosk marketing as a key strategy to enhance their profits. Further, factors like rising internet penetration and growing mobile phone users are aiding the market growth of kiosks. However, growing security concerns could obstruct the market growth of kiosks. In addition, the high initial investment required, and further maintenance costs of kiosks could pose a challenge to the growth of the market in the forecast period.
The report gives a detailed analysis of the following key players in the global kiosks market, covering their competitive landscape, capacity, and latest developments like mergers, acquisitions, and investments, expansions of capacity, and plant turnarounds:
The comprehensive EMR report provides an in-depth assessment of the market based on the Porter's five forces model along with giving a SWOT analysis.
Upto 15% Off
USD
$2499 $2249
$3999 $3599
$4999 $4249
$5999 $5099


*While we strive to always give you current and accurate information, the numbers depicted on the website are indicative and may differ from the actual numbers in the main report. At Expert Market Research, we aim to bring you the latest insights and trends in the market. Using our analyses and forecasts, stakeholders can understand the market dynamics, navigate challenges, and capitalize on opportunities to make data-driven strategic decisions.*
The global kiosks market attained a value of nearly USD 36.48 Billion in 2025.
The market is projected to grow at a CAGR of 11.20% between 2026 and 2035.
The market is estimated to witness a healthy growth in the forecast period of 2026-2035 to reach USD 105.46 Billion by 2035.
The major market drivers include the rise in services like self-ticketing, ATMs, food and beverages vending machines, the expanding retail sector, and evolving consumer lifestyles.
The key trends guiding the market include the surging internet penetration, the enhanced customer experience offered by kiosks, and the rising use of kiosks to accelerate sales in various end-use sectors.
The major regions in the kiosks market include North America, Latin America, the Middle East and Africa, Europe, and the Asia Pacific.
Interactive and non-interactive are the major kiosk types in the market.
The various product types of kiosks in the market are self-service kiosks, vendor kiosks, bank kiosks, and advertising display and digital signage kiosks, among others.
The significant display sizes of kiosks considered in the market report include less than 17-inch, 17 inch to 25-inch, 26 inch to 40 inch, and more than 40 inch.
The several end uses of kiosks include banking, financial services, and insurance (BFSI), food and beverage, retail, healthcare, transportation, entertainment, and hospitality, among others.
The major players in the market are NCR Corporation, KIOSK Information System, SZZT Electronics Shenzhen Co., Ltd., Acante Solutions Ltd, NEXCOM International Co., Ltd., and SLABB Inc., among others.
Explore our key highlights of the report and gain a concise overview of key findings, trends, and actionable insights that will empower your strategic decisions.
| REPORT FEATURES | DETAILS |
| Base Year | 2025 |
| Historical Period | 2019-2025 |
| Forecast Period | 2026-2035 |
| Scope of the Report |
Historical and Forecast Trends, Industry Drivers and Constraints, Historical and Forecast Market Analysis by Segment:
|
| Breakup by Type |
|
| Breakup by Product Type |
|
| Breakup by Display Size |
|
| Breakup by End Use |
|
| Breakup by Region |
|
| Market Dynamics |
|
| Competitive Landscape |
|
| Companies Covered |
|
| Report Price and Purchase Option | Explore our purchase options that are best suited to your resources and industry needs. |
| Delivery Format | Delivered as an attached PDF and Excel through email, with an option of receiving an editable PPT, according to the purchase option. |
Datasheet
One User
USD 2,499
USD 2,249
tax inclusive*
Single User License
One User
USD 3,999
USD 3,599
tax inclusive*
Five User License
Five User
USD 4,999
USD 4,249
tax inclusive*
Corporate License
Unlimited Users
USD 5,999
USD 5,099
tax inclusive*
*Please note that the prices mentioned below are starting prices for each bundle type. Kindly contact our team for further details.*
Flash Bundle
Small Business Bundle
Growth Bundle
Enterprise Bundle
*Please note that the prices mentioned below are starting prices for each bundle type. Kindly contact our team for further details.*
Flash Bundle
Number of Reports: 3
20%
tax inclusive*
Small Business Bundle
Number of Reports: 5
25%
tax inclusive*
Growth Bundle
Number of Reports: 8
30%
tax inclusive*
Enterprise Bundle
Number of Reports: 10
35%
tax inclusive*
How To Order

Select License Type
Choose the right license for your needs and access rights.

Click on ‘Buy Now’
Add the report to your cart with one click and proceed to register.

Select Mode of Payment
Choose a payment option for a secure checkout. You will be redirected accordingly.
Strategic Solutions for Informed Decision-Making
Gain insights to stay ahead and seize opportunities.

Get insights & trends for a competitive edge.

Track prices with detailed trend reports.

Analyse trade data for supply chain insights.

Leverage cost reports for smart savings

Enhance supply chain with partnerships.

Connect For More Information
Our expert team of analysts will offer full support and resolve any queries regarding the report, before and after the purchase.
Our expert team of analysts will offer full support and resolve any queries regarding the report, before and after the purchase.
We employ meticulous research methods, blending advanced analytics and expert insights to deliver accurate, actionable industry intelligence, staying ahead of competitors.
Our skilled analysts offer unparalleled competitive advantage with detailed insights on current and emerging markets, ensuring your strategic edge.
We offer an in-depth yet simplified presentation of industry insights and analysis to meet your specific requirements effectively.


