

Consumer Insights
Uncover trends and behaviors shaping consumer choices today
Procurement Insights
Optimize your sourcing strategy with key market data
Industry Stats
Stay ahead with the latest trends and market analysis.
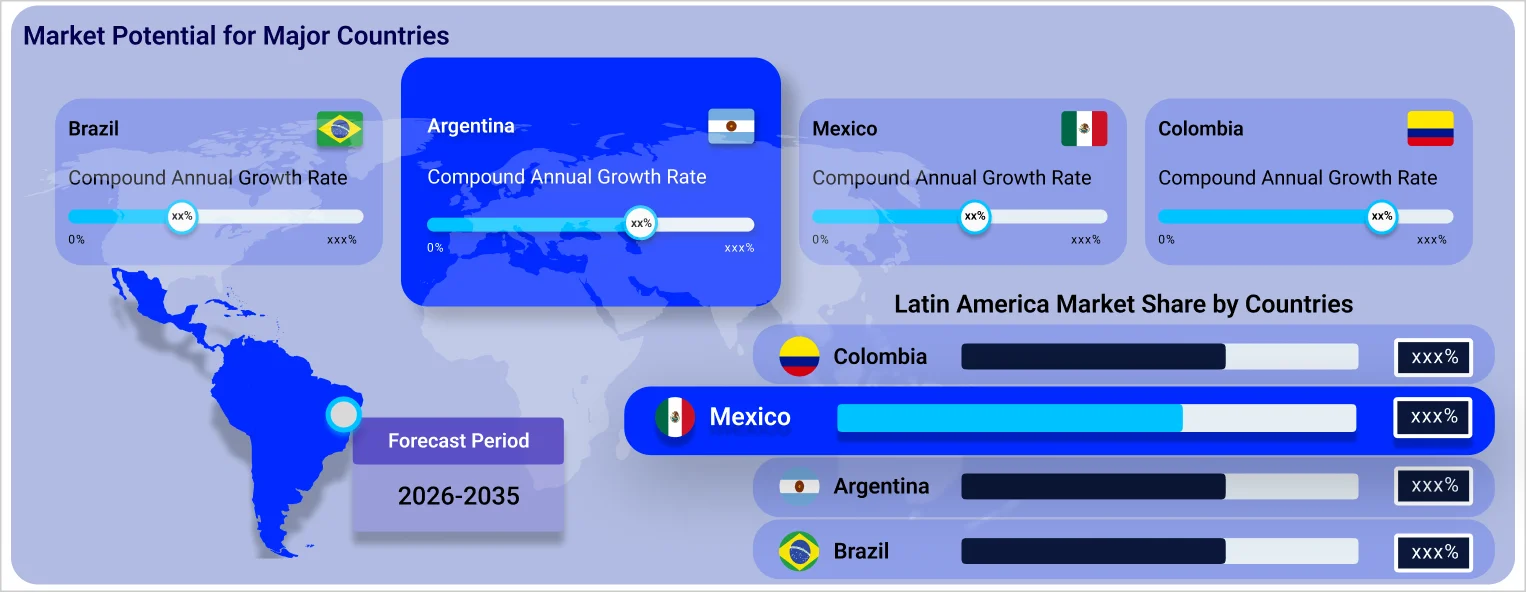
The Latin America non-alcoholic beverages market is projected to grow at a CAGR of 4.30% between 2026 and 2035. The market is being driven by the robust growth of the e-commerce sector in countries like Mexico.
According to Beverage Daily, PepsiCo, Nestle, and Coca-Cola accelerated investment across Mexico in April 2026, with PepsiCo opening its USD 467 million Sabritas plant in Celaya as part of a USD 2 billion programme through 2028. The investment surge underscores Mexico and Latin America's growing strategic importance for non-alcoholic beverage producers chasing growth, supply-chain resilience, and stable demand.
According to Hospitality Career Profile, Coca-Cola replaced PepsiCo as the global beverage supplier for Marriott International hotels in early 2026, including across Latin American properties. The win materially expands Coca-Cola's hospitality channel footprint and is expected to reshape competitive dynamics, sponsorship spend, and shelf placement across the Latin America non-alcoholic beverages market in the coming quarters.
In Mexico, 74% of the population consumes soft drinks daily, averaging 115 litres per person annually.
The total volume of online transactions in Latin America experienced a growth of 3.1 times from 2019 to 2023, showcasing a robust e-commerce sector.
In 2022, consumer spending in Latin America and the Caribbean amounted to $4,180.45 billion, indicating a 16.69% increase from the previous year, 2021.
Compound Annual Growth Rate
4.3%
2026-2035
Read more about this report - REQUEST FREE SAMPLE COPY IN PDF
Reportedly, the e-commerce sector in Latin America has experienced an impressive 2.8-fold increase in sales value. The region has over 300 million digital consumers, a number expected to grow by more than 20% by 2027. This data underscores Latin America's position as one of the fastest-growing e-commerce markets globally. Furthermore, Brazil and Mexico are anticipated to lead the Latin American e-commerce landscape, with projected compound annual growth rates of 77.2% and 68.2%, respectively, by 2027. The expansion of e-commerce is driving demand for non-alcoholic beverages by enhancing product accessibility and variety, facilitating convenient online shopping, and utilising targeted marketing and subscription services, all of which improve consumer engagement and contribute to increased sales.
The market in Latin America is experiencing a significant transformation, driven by evolving consumer preferences. Clean labels and natural ingredients are gaining prominence, with 37% of Mexican consumers emphasising the importance of beverages that feature natural claims. Additionally, there is a notable rise in consumer interest in functional beverages that promote both immediate and long-term health benefits. Specifically, 81% of Mexican consumers express interest in foods and drinks that enhance bone or heart health, while 79% seek products that support gut health. Furthermore, 76% of consumers are drawn to items that contribute to mental well-being. Another notable trend is the growing demand for beverages that provide a natural energy boost, with 69% of Mexican consumers indicating their interest in products that sustain their energy levels throughout the day, and 74% favouring those that offer a natural energy enhancement.
Health and wellness trends, rising demand for functional beverages, changing social norms, innovative product development, and growing environmental and ethical concerns are the major trends impacting the Latin America non-alcoholic beverages market growth.
São Geraldo partnered with CANPACK Brazil to launch its flagship beverage, Cajuína São Geraldo, in 350ml infinitely recyclable cans across Brazil. The soda, with 5% juice from the fruits of native cashew trees, offers innovative flavours integrated with the cultural roots of Brazil.
Britvic completed the acquisition of four Brazilian non-alcoholic beverage brands, Extra Power energy drink brand from GlobalBev and acai smoothie, Flying Horse, and Juxx from Amazoo. Through the acquisitions, the company aims to expand its footprint in the country.
Britvic launched two new exclusive beverage flavours in Brazil, expanding its line-up of Britvic Club Soda, Ginger Ale, Cranberry Juice, and Indian Tonic Water (regular and low-calorie). This move aims to capitalise on the growing popularity of soft drinks in bars, stores, and events in Brazil.
The demand for non-alcoholic beverages enriched with health-enhancing components, including vitamins, minerals, probiotics, and adaptogens, is on the rise as consumers increasingly look for drinks that provide benefits beyond mere hydration.
The growing trend towards sobriety and conscious drinking reflects a significant cultural shift in how society views alcohol consumption. This change is largely driven by various social movements that advocate for healthier lifestyles, mental well-being, and a greater awareness of the effects of alcohol on both physical and mental health.
The introduction of new flavours, innovative packaging, and unique formulations captivates consumers who seek fresh and thrilling beverage options. In today's competitive market, beverage companies are constantly striving to differentiate themselves from their rivals by offering products that not only taste great but also provide an exciting experience for the consumer.
The increasing awareness of environmental issues and the impact of consumer choices on the planet has led to a significant shift in consumer behaviour, particularly in the beverage sector. More consumers are prioritising sustainability in their purchasing decisions, which has resulted in a marked preference for non-alcoholic drinks that not only taste good but also align with their values regarding environmental responsibility.
The growing emphasis on health and wellness is prompting consumers to choose non-alcoholic beverages, as they seek options that are low in calories, low in sugar, and offer functional benefits. The heightened focus on consuming a balanced diet and the desire to avoid alcohol for health-related reasons are driving the demand for non-alcoholic alternatives.
Read more about this report - REQUEST FREE SAMPLE COPY IN PDF
The younger demographics, particularly millennials and Generation Z, are increasingly gravitating towards non-alcoholic beverages, a trend that can be attributed to several interrelated factors. The current generations are more inclined towards their physical and mental well-being. This focus on health is reflected in their dietary choices, with many opting for beverages that align with their wellness goals, such as low-calorie, low-sugar, or nutrient-rich options.
Moreover, the emphasis on sustainability among consumers is reshaping the market, driving innovation and encouraging brands to adopt more environmentally friendly practices. This shift not only benefits the planet but also fosters a deeper connection between consumers and the brands they choose to support, as they align their purchasing habits with their values.
Latin America Non-alcoholic Beverages Market Report and Forecast 2026-2035 offers a detailed analysis of the market based on the following segments:
Market Breakup by Type
Market Breakup by Packaging Type
Market Breakup by End Use
Market Breakup by Distribution Channels
Market Breakup by Country
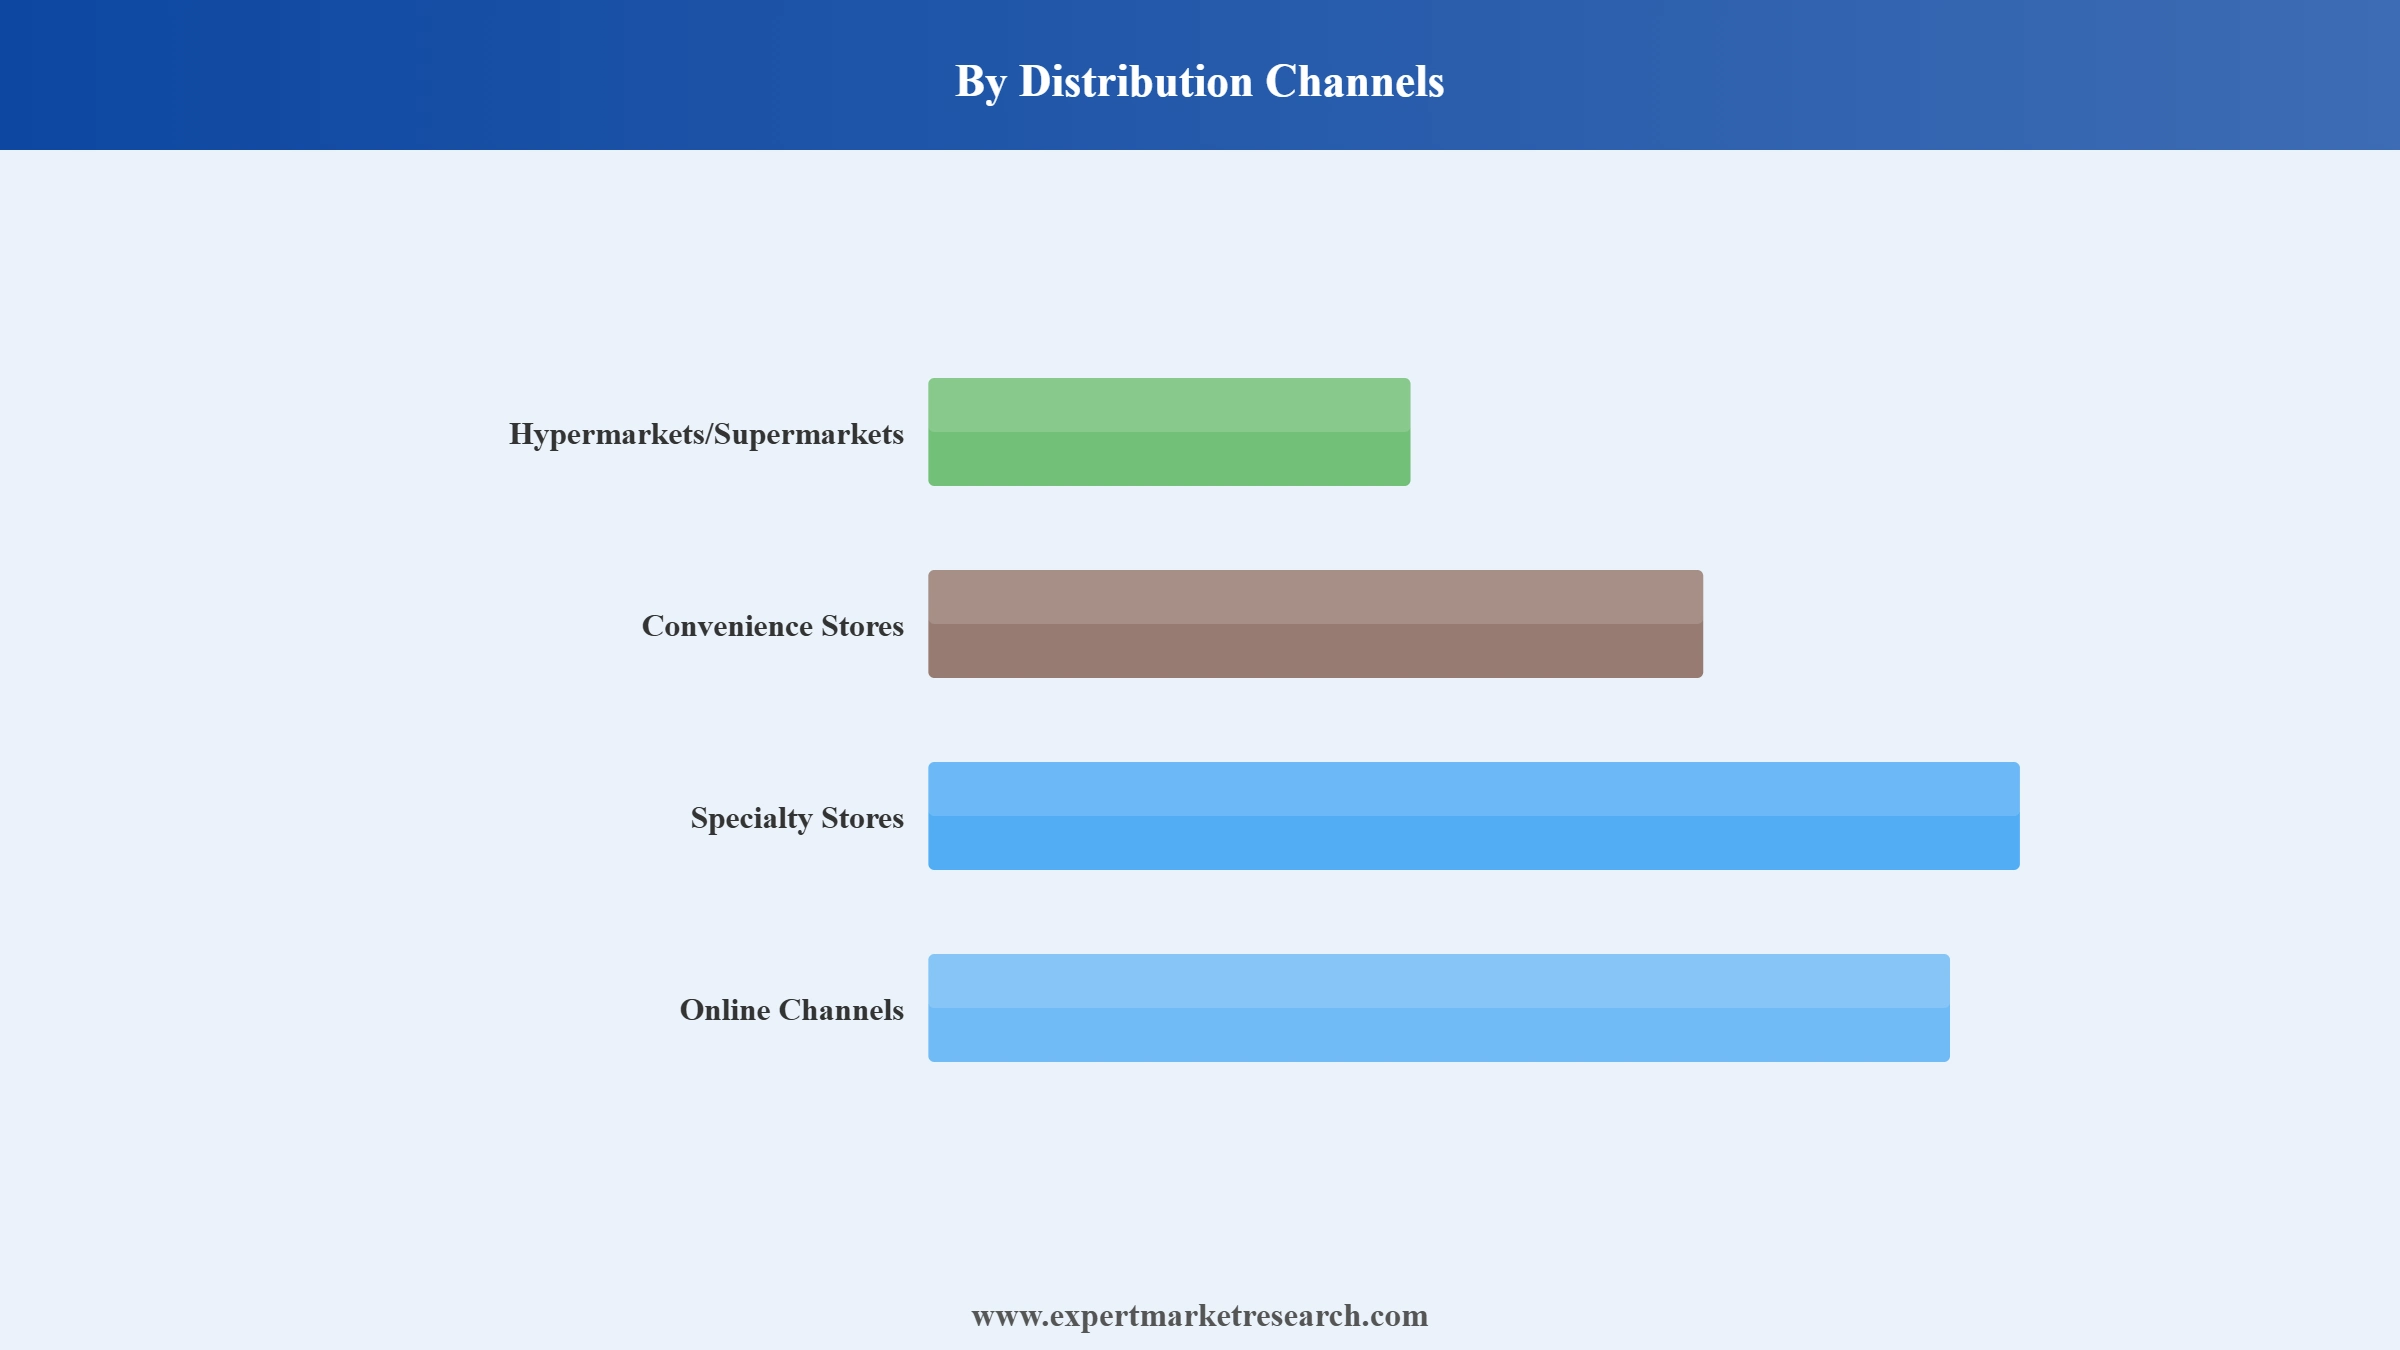
Based on distribution channels, the market segmentation includes supermarkets and hypermarkets, convenience stores, speciality stores, and online, among others. The online segment is projected to grow at a CAGR of 6.9% during the forecast period of 2026-2035. The expansion of online platforms enhances the demand for non-alcoholic beverages by improving product availability, presenting a variety of choices, and facilitating convenient shopping experiences.
Read more about this report - REQUEST FREE SAMPLE COPY IN PDF
Major players are focusing on the production of natural and chemical-free non-alcoholic beverages to gain a competitive edge in the market.
The comprehensive report looks into the macro and micro aspects of the market. The EMR report gives an in-depth insight into the market by providing a SWOT analysis as well as an analysis of Porter’s Five Forces model.
Upto 15% Off
USD
$3999 $3599
$2499 $2249
$4999 $4249
$5999 $5099


*While we strive to always give you current and accurate information, the numbers depicted on the website are indicative and may differ from the actual numbers in the main report. At Expert Market Research, we aim to bring you the latest insights and trends in the market. Using our analyses and forecasts, stakeholders can understand the market dynamics, navigate challenges, and capitalize on opportunities to make data-driven strategic decisions.*
The market is assessed to grow at a CAGR of 4.30% between 2026 and 2035.
The market is being driven by the rising health and wellness trend, increasing disposable incomes, and increasing demand for functional beverages in the region.
The key trends aiding the market expansion include the rise in the production of innovative non-alcoholic beverage products and increasing demand for nature-based and organic beverages.
The different types of non-alcoholic beverages in the market are carbonated soft drinks, fruit juice, RTD tea and coffee, energy and sports drinks, and bottled water, among others.
The different packaging types of non-alcoholic beverages in the market are bottles, cans, and cartons, among others.
The distribution channels in the market are supermarkets and hypermarkets, convenience stores, speciality stores, and online, among others.
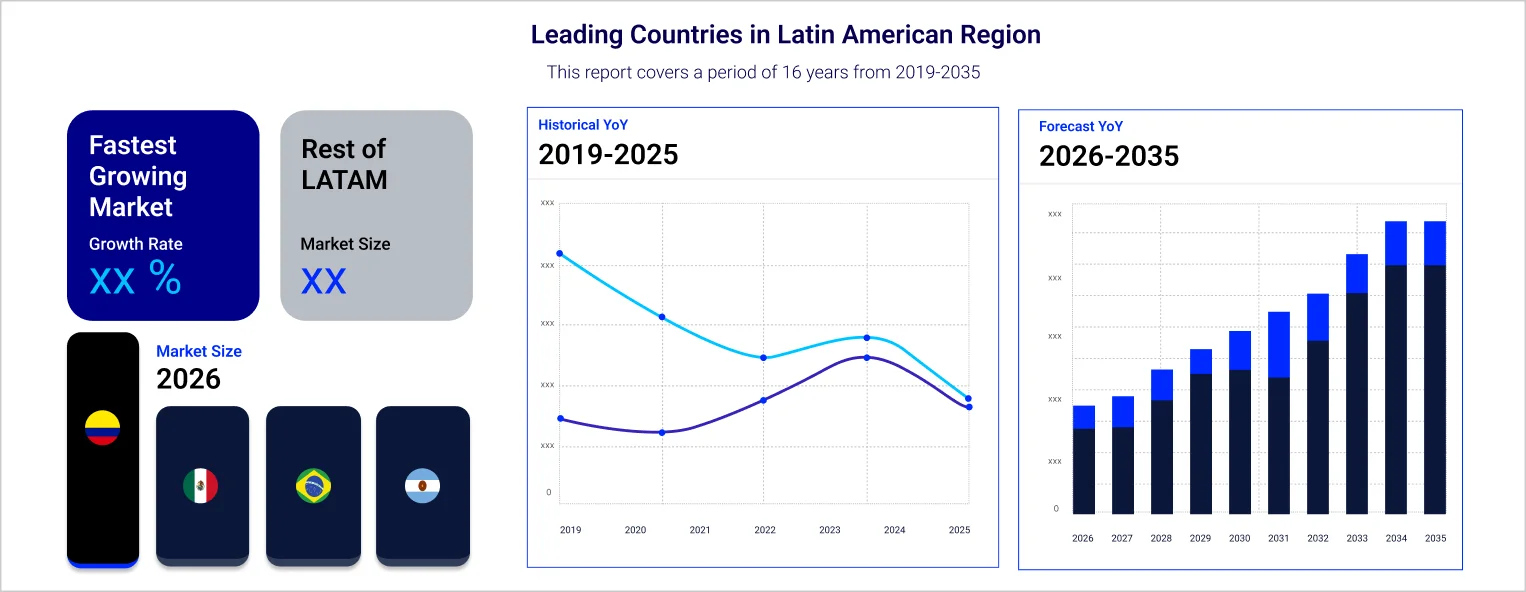
The countries considered in the market are Brazil, Mexico, Chile, Colombia, and Argentina, among others.
The major players in the market are PepsiCo, Inc., The Coca-Cola Company, Nestle S.A., Novamex, Red Cola, Mott’s LLP, Denone SA, and Keurig Dr Pepper Inc., among others.
Explore our key highlights of the report and gain a concise overview of key findings, trends, and actionable insights that will empower your strategic decisions.
| REPORT FEATURES | DETAILS |
| Base Year | 2025 |
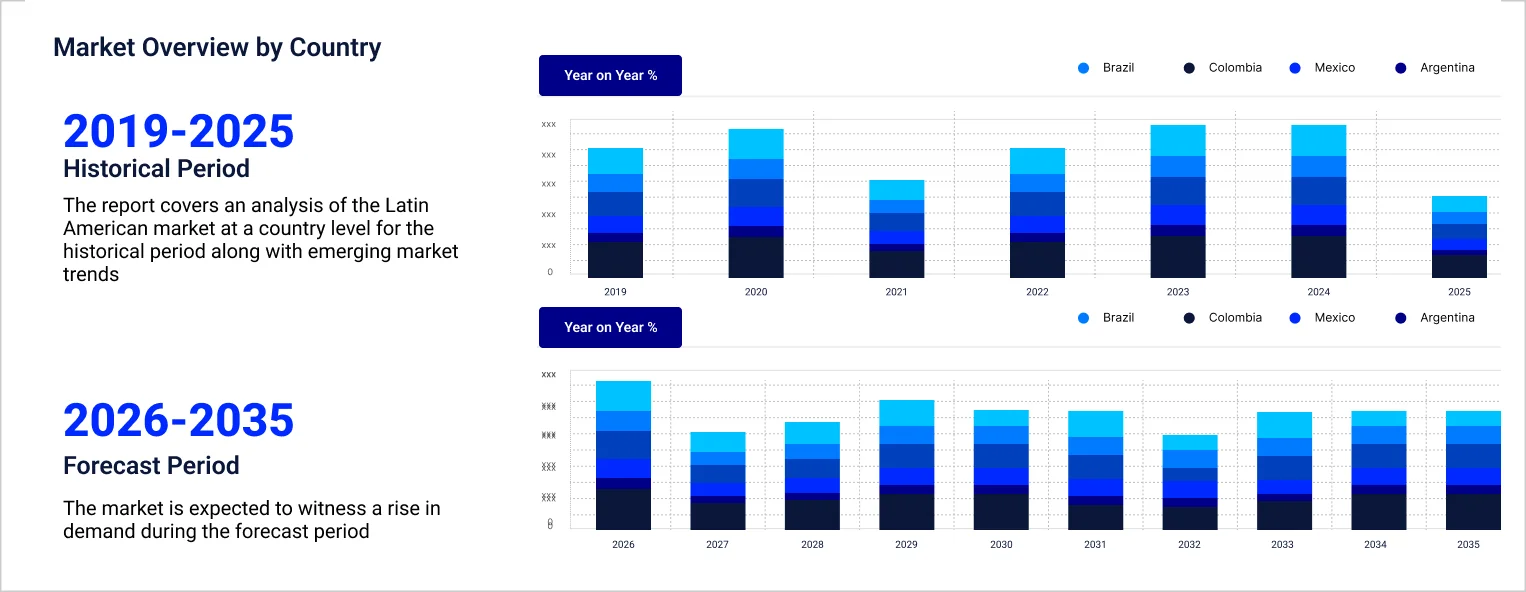
| Historical Period | 2019-2025 |
| Forecast Period | 2026-2035 |
| Scope of the Report |
Historical and Forecast Trends, Industry Drivers and Constraints, Historical and Forecast Market Analysis by Segment
|
| Breakup by Type |
|
| Breakup by Packaging Type |
|
| Breakup by End Use |
|
| Breakup by Distribution Channels |
|
| Breakup by Region |
|
| Market Dynamics |
|
| Competitive Landscape |
|
| Companies Covered |
|
Single User License
One User
USD 3,999
USD 3,599
tax inclusive*
Datasheet
One User
USD 2,499
USD 2,249
tax inclusive*
Five User License
Five User
USD 4,999
USD 4,249
tax inclusive*
Corporate License
Unlimited Users
USD 5,999
USD 5,099
tax inclusive*
*Please note that the prices mentioned below are starting prices for each bundle type. Kindly contact our team for further details.*
Flash Bundle
Small Business Bundle
Growth Bundle
Enterprise Bundle
*Please note that the prices mentioned below are starting prices for each bundle type. Kindly contact our team for further details.*
Flash Bundle
Number of Reports: 3
20%
tax inclusive*
Small Business Bundle
Number of Reports: 5
25%
tax inclusive*
Growth Bundle
Number of Reports: 8
30%
tax inclusive*
Enterprise Bundle
Number of Reports: 10
35%
tax inclusive*
How To Order

Select License Type
Choose the right license for your needs and access rights.

Click on ‘Buy Now’
Add the report to your cart with one click and proceed to register.

Select Mode of Payment
Choose a payment option for a secure checkout. You will be redirected accordingly.
Strategic Solutions for Informed Decision-Making
Gain insights to stay ahead and seize opportunities.

Get insights & trends for a competitive edge.

Track prices with detailed trend reports.

Analyse trade data for supply chain insights.

Leverage cost reports for smart savings

Enhance supply chain with partnerships.

Connect For More Information
Our expert team of analysts will offer full support and resolve any queries regarding the report, before and after the purchase.
Our expert team of analysts will offer full support and resolve any queries regarding the report, before and after the purchase.
We employ meticulous research methods, blending advanced analytics and expert insights to deliver accurate, actionable industry intelligence, staying ahead of competitors.
Our skilled analysts offer unparalleled competitive advantage with detailed insights on current and emerging markets, ensuring your strategic edge.
We offer an in-depth yet simplified presentation of industry insights and analysis to meet your specific requirements effectively.


