

Consumer Insights
Uncover trends and behaviors shaping consumer choices today
Procurement Insights
Optimize your sourcing strategy with key market data
Industry Stats
Stay ahead with the latest trends and market analysis.
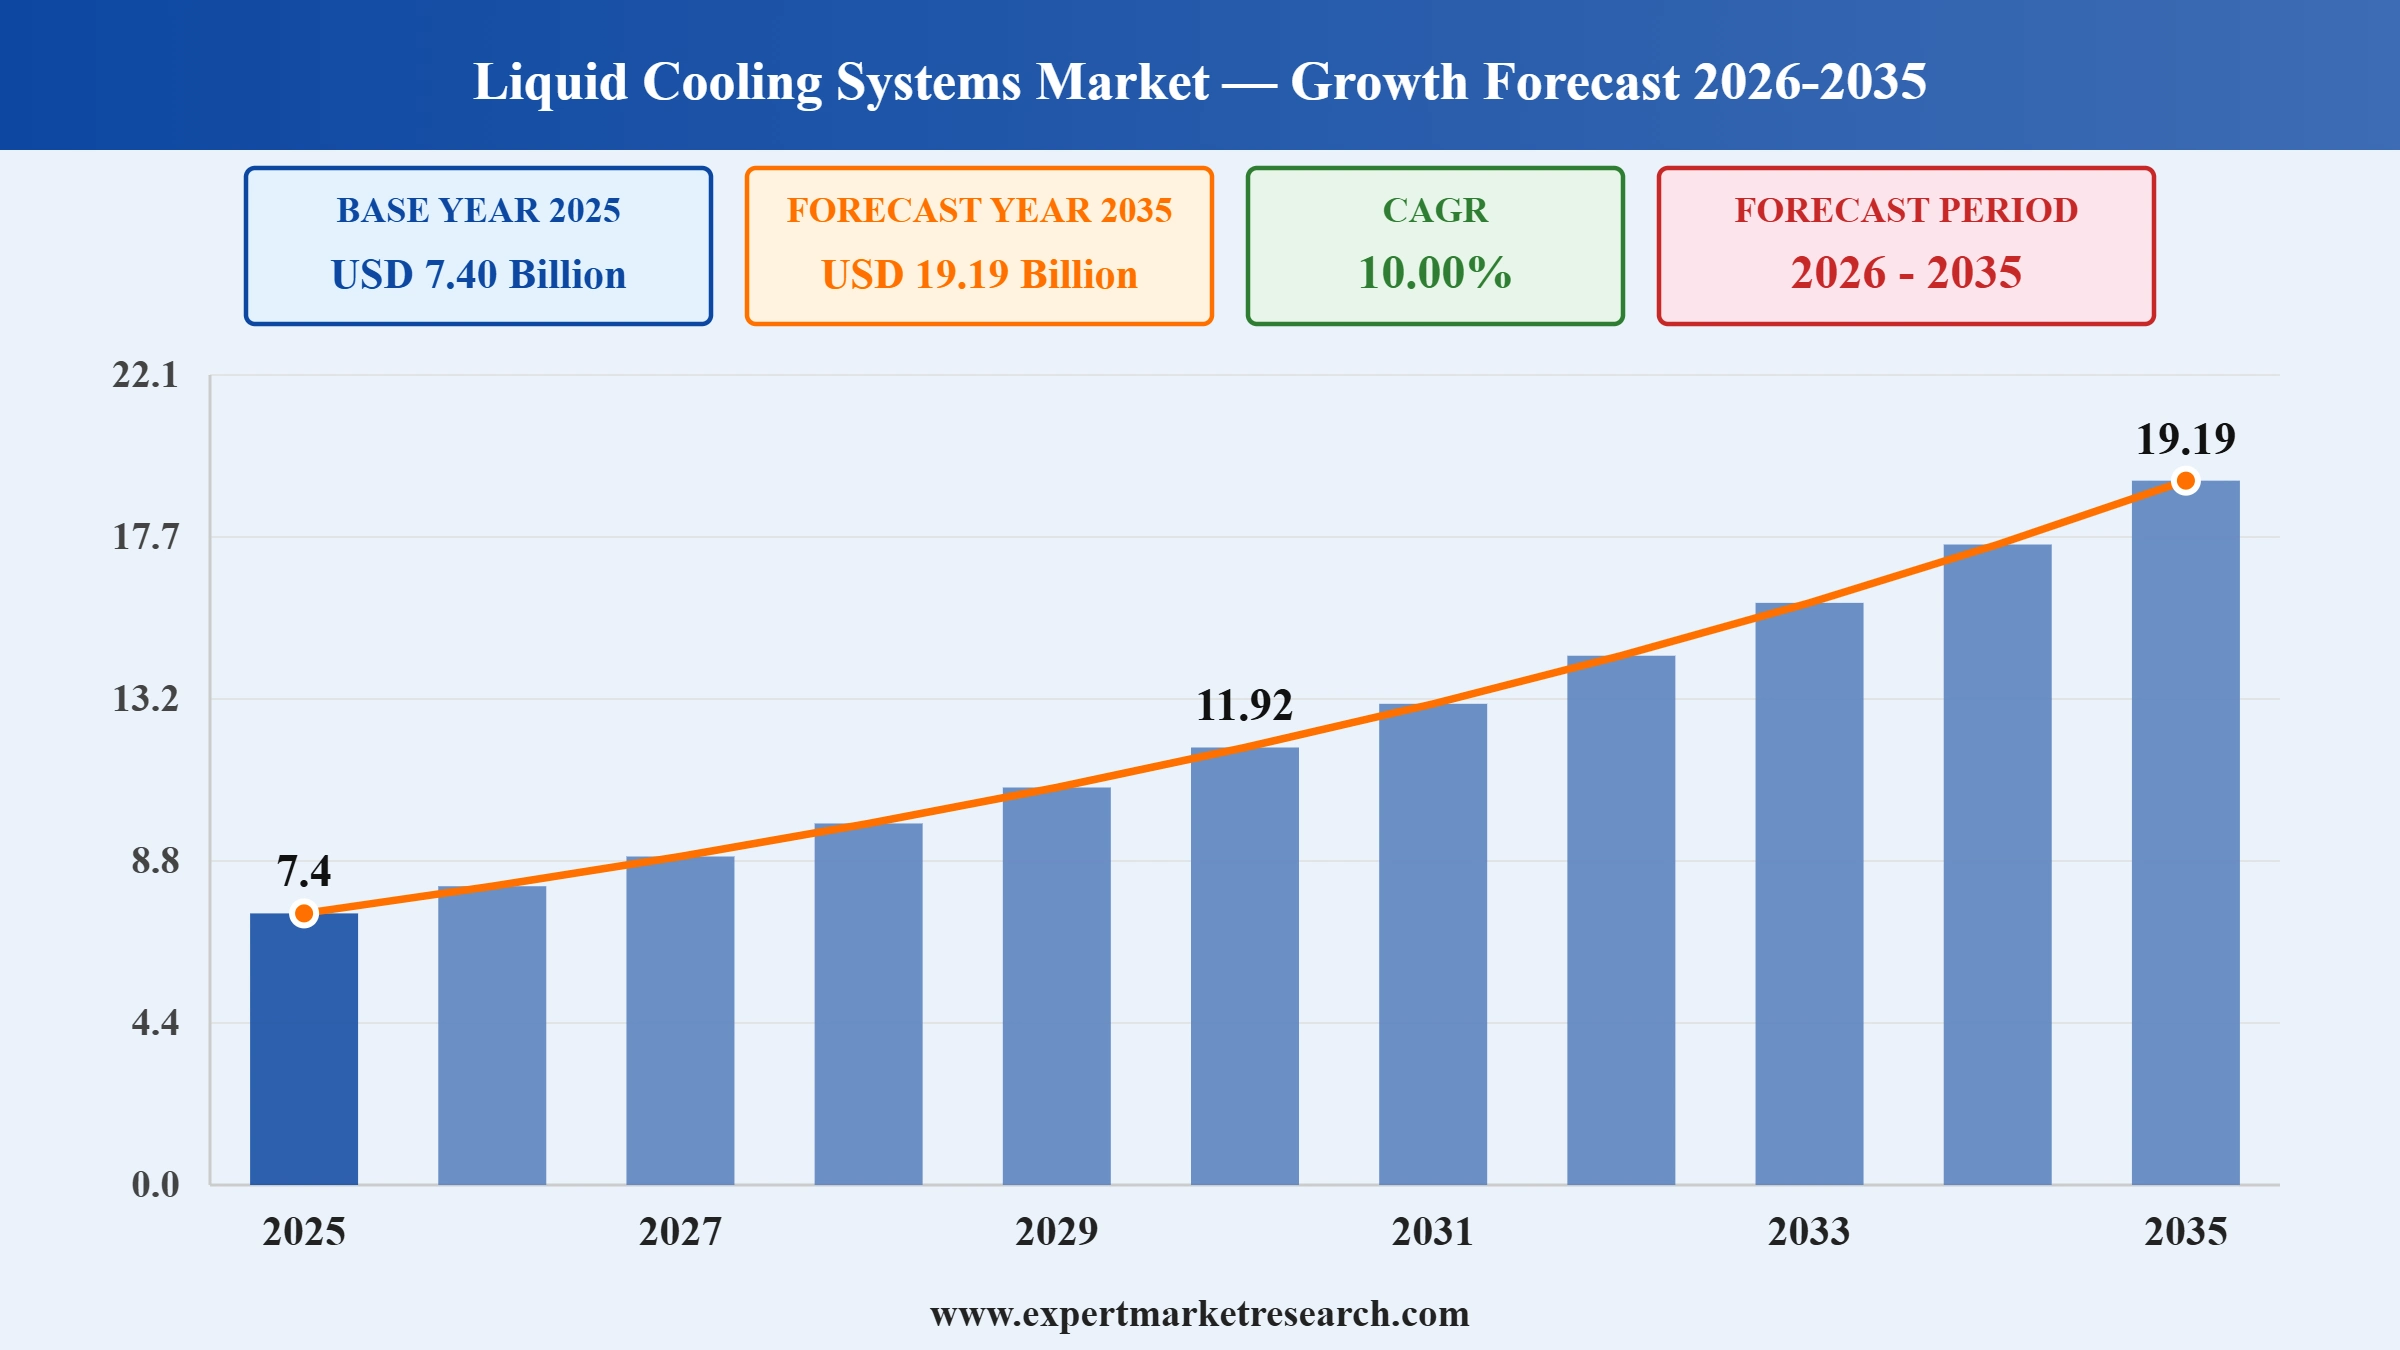
The global liquid cooling systems market is expected to grow by USD 7.40 Billion at a CAGR of 10.00% during the forecast period of 2026-2035. The market is further to reach a value of USD 19.19 Billion in 2035.
Read more about this report - REQUEST FREE SAMPLE COPY IN PDF
| Global Liquid Cooling Systems Market Report Summary | Description | Value |
| Base Year | USD Billion | 2025 |
| Historical Period | USD Billion | 2019-2025 |
| Forecast Period | USD Billion | 2026-2035 |
| Market Size 2025 | USD Billion | 7.40 |
| Market Size 2035 | USD Billion | 19.19 |
| CAGR 2019-2025 | Percentage | XX% |
| CAGR 2026-2035 | Percentage | 10.00% |
| CAGR 2026-2035 - Market by Region | Asia Pacific | 10.8% |
| CAGR 2026-2035 - Market by Country | India | 12.4% |
| CAGR 2026-2035 - Market by Country | Brazil | 10.7% |
| CAGR 2026-2035 - Market by Product Type | Compressor-based Systems (Recirculating Chillers) | 10.9% |
| CAGR 2026-2035 - Market by End Use | Data Centre | 11.3% |
| Market Share by Country 2025 | Italy | 3.4% |
The liquid cooling systems market covers technologies that use liquid coolants to remove heat from electronic, industrial, and mechanical systems more efficiently than air cooling. It spans liquid heat exchanger systems and compressor-based recirculating chillers, deployed across data centres, telecommunications, healthcare, analytical equipment, industrial, automotive, and military applications. Growth is led by data centre demand tied to artificial intelligence, high-performance computing, and rising rack power densities that exceed the limits of traditional air cooling.
Read more about this report - REQUEST FREE SAMPLE COPY IN PDF
With the rapid technological advancements, smartphone manufacturers are transforming the products into pocket-fitting mini-computers. The increased penetration of the Internet of Things (IoT) and the rapid development of artificial intelligence (AI) technology are driving the growth of the liquid cooling systems market. Numerous industrial verticals such as food and drinks, healthcare, data centres, and telecommunications require control over liquid media for industrial activities within a specified temperature range, which is aiding the market growth.
Read more about this report - REQUEST FREE SAMPLE COPY IN PDF
With the increasing penetration of smartphones, especially in emerging economies, the demand for thermal management has increased, leading to increased incorporation of liquid cooling alternatives in smartphones, which is driving the market growth. Also, the increasing worries about thermal management in engineering applications such as nuclear reactors, industrial heat exchangers, micro equipment, and others, is a key trend in liquid cooling systems market where liquid cooling systems can play a crucial role. Further, a strategic collaboration by major players with technological giants, healthcare industries, and data centres to provide customisable solutions to the consumers is further aiding the market for liquid cooling systems globally.
As per the liquid cooling system market dynamics and trends, Microsoft announced that it is adopting direct-to-chip liquid cooling technology in July 2024. The company is also developing a new generation of data center designs for direct-to-chip cooling.
According to United States International Trade Commission, the United States leads the number of data centre, globally, with 33%, driven by its tech giants and robust infrastructure. As per the liquid cooling systems industry analysis, the UK follows with 6%, reflecting its status as a European tech hub with advanced digital infrastructure.
China and Germany each hold 5%, with China's rapid technological growth and Germany's strong industrial base contributing to their shares. Canada, Australia, France, Japan, and the Netherlands each have 3%, while Russia, Mexico, Brazil, and Italy each hold 2%, supported by their growing digital economies. The remaining 26% is distributed among other countries, indicating the global nature of data storage needs. This distribution highlights the economic and technological capabilities of these nations, with the US leading due to its infrastructure and demand for digital services and boosts the growth of the liquid cooling systems industry.
Meta Platforms (Facebook) owns the largest data center in the U.S., covering 4.6 million square feet in Prineville, Oregon, a city about 150 miles southeast of Portland. Northern Virginia is the largest data center market in the United States. This region includes Loudoun County (Ashburn, Sterling, Leesburg, Arcola), Prince William County (Manassas, Gainesville, Haymarket), and Fairfax County (Reston, Herndon, Chantilly, Vienna, McLean, Tysons), among others. The data centers in Northern Virginia are primarily powered by Dominion Energy, the largest electric utility in the area, with NOVEC (Northern Virginia Electric Cooperative) also being a significant power provider, which can further boost the liquid cooling systems industry revenue. Major cloud computing services operating in this region include Amazon Web Services (AWS), Microsoft Azure, Google Cloud, and Meta Platforms (Facebook).
The report of Expert Market Research's titled "Global Liquid Cooling Systems Market Report and Forecast 2026-2035" offers a detailed analysis of the market based on the following segments:
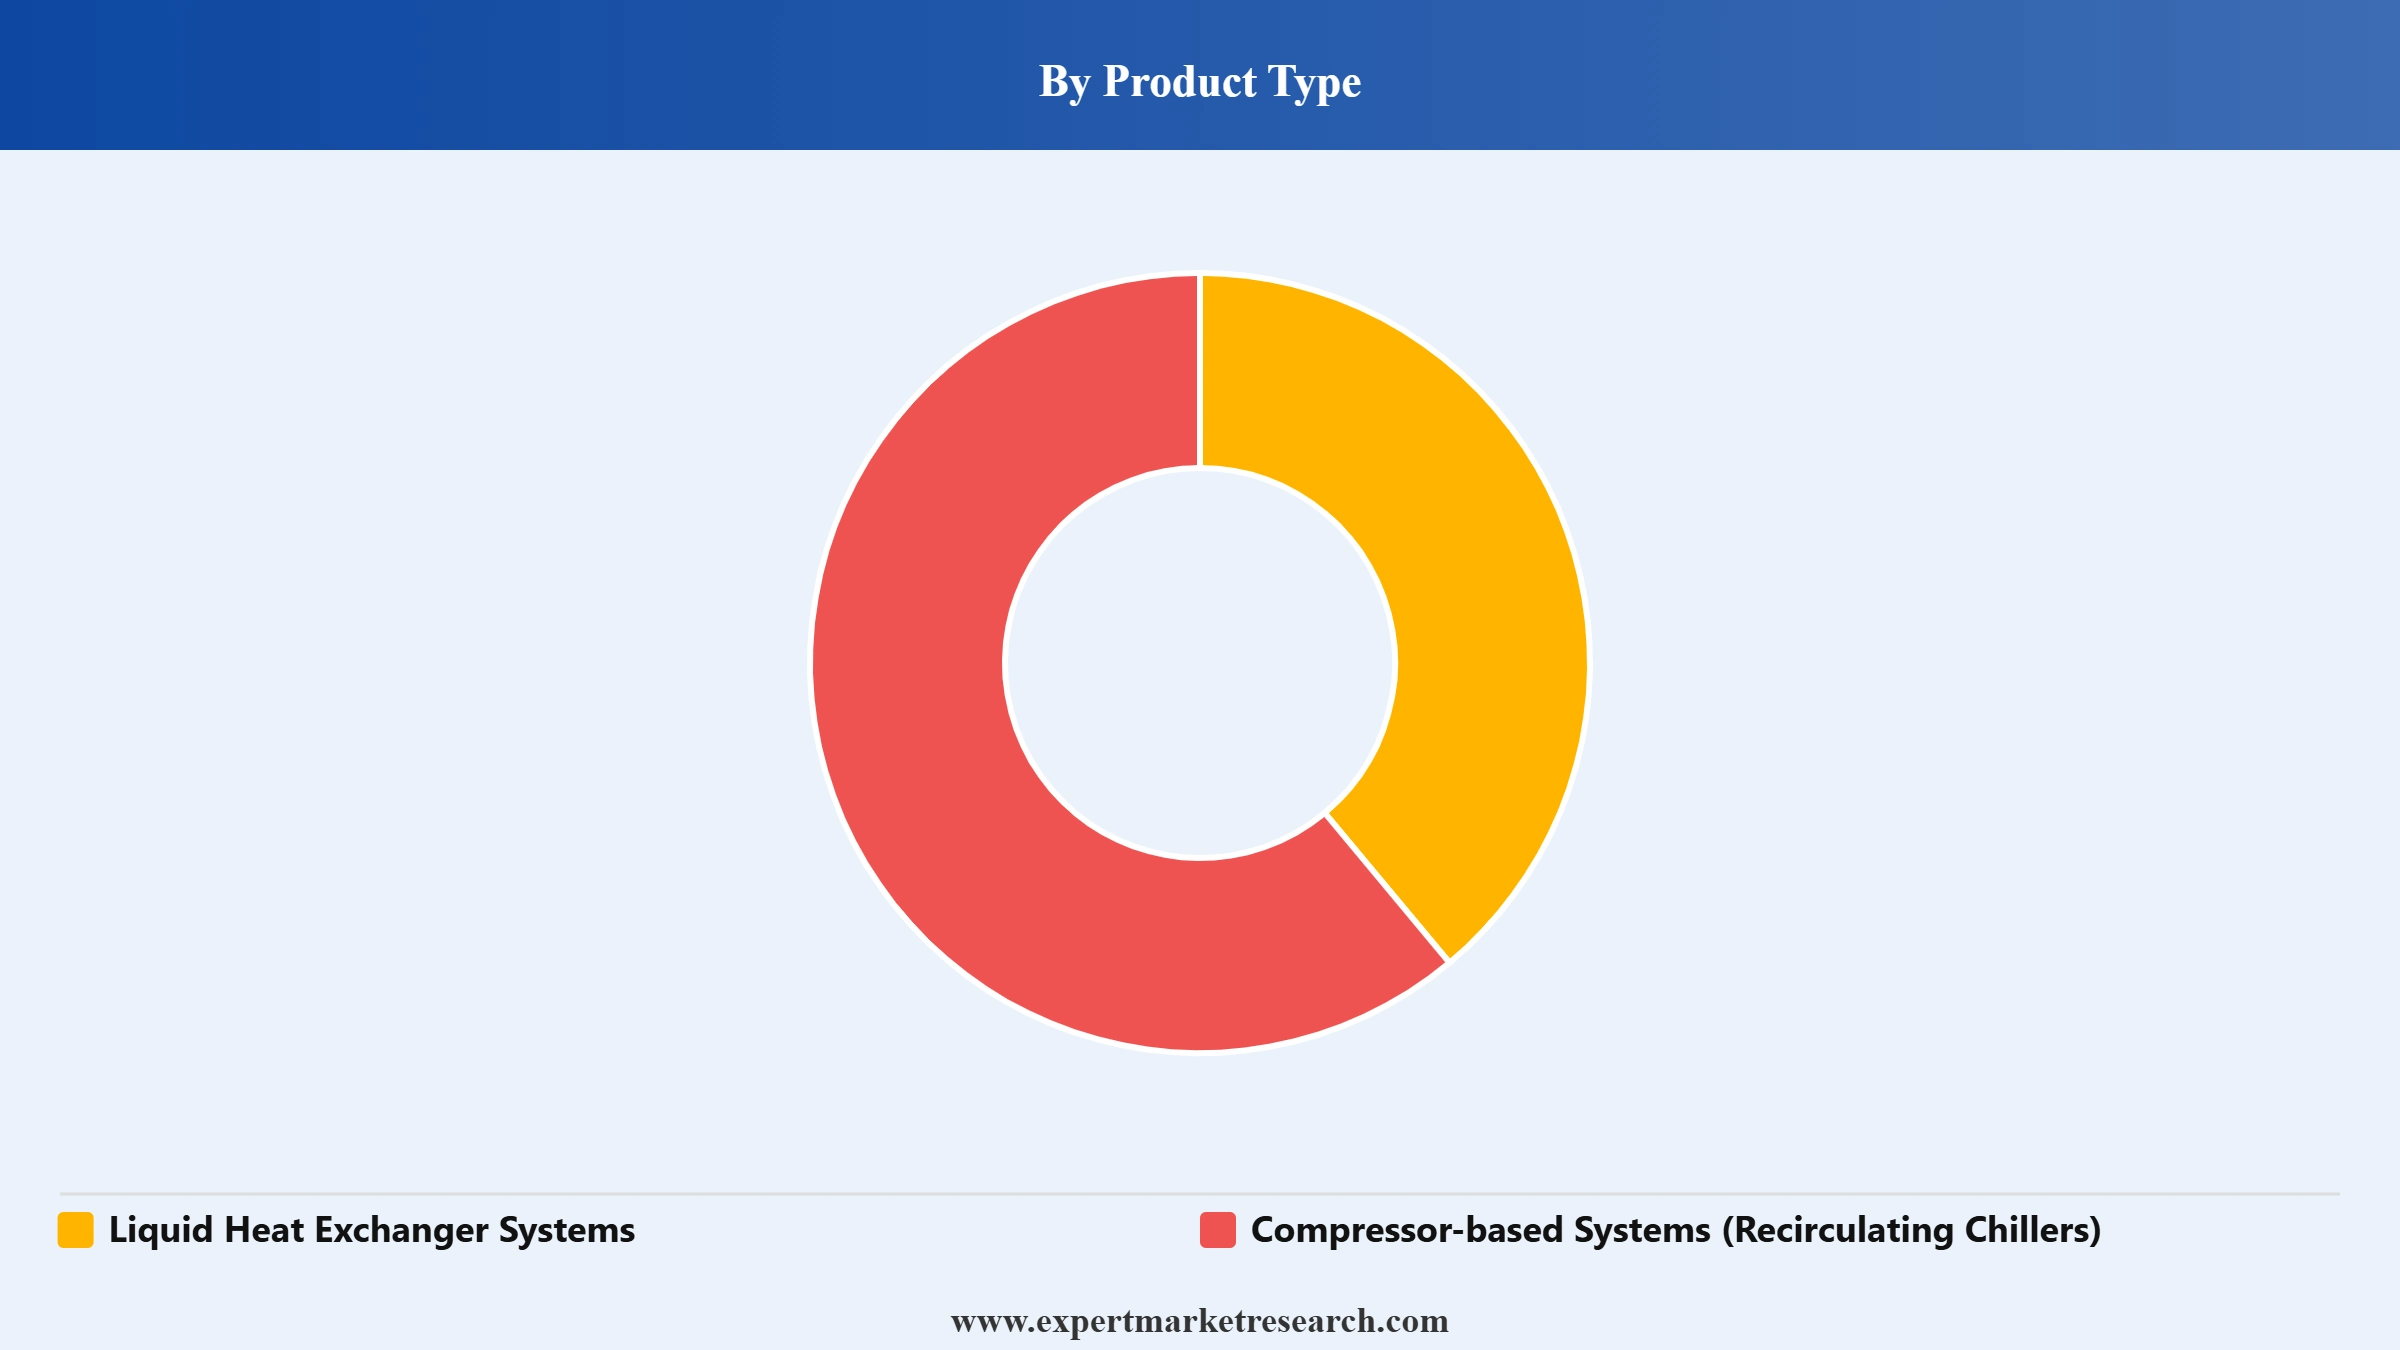
Market Breakup by Product Type
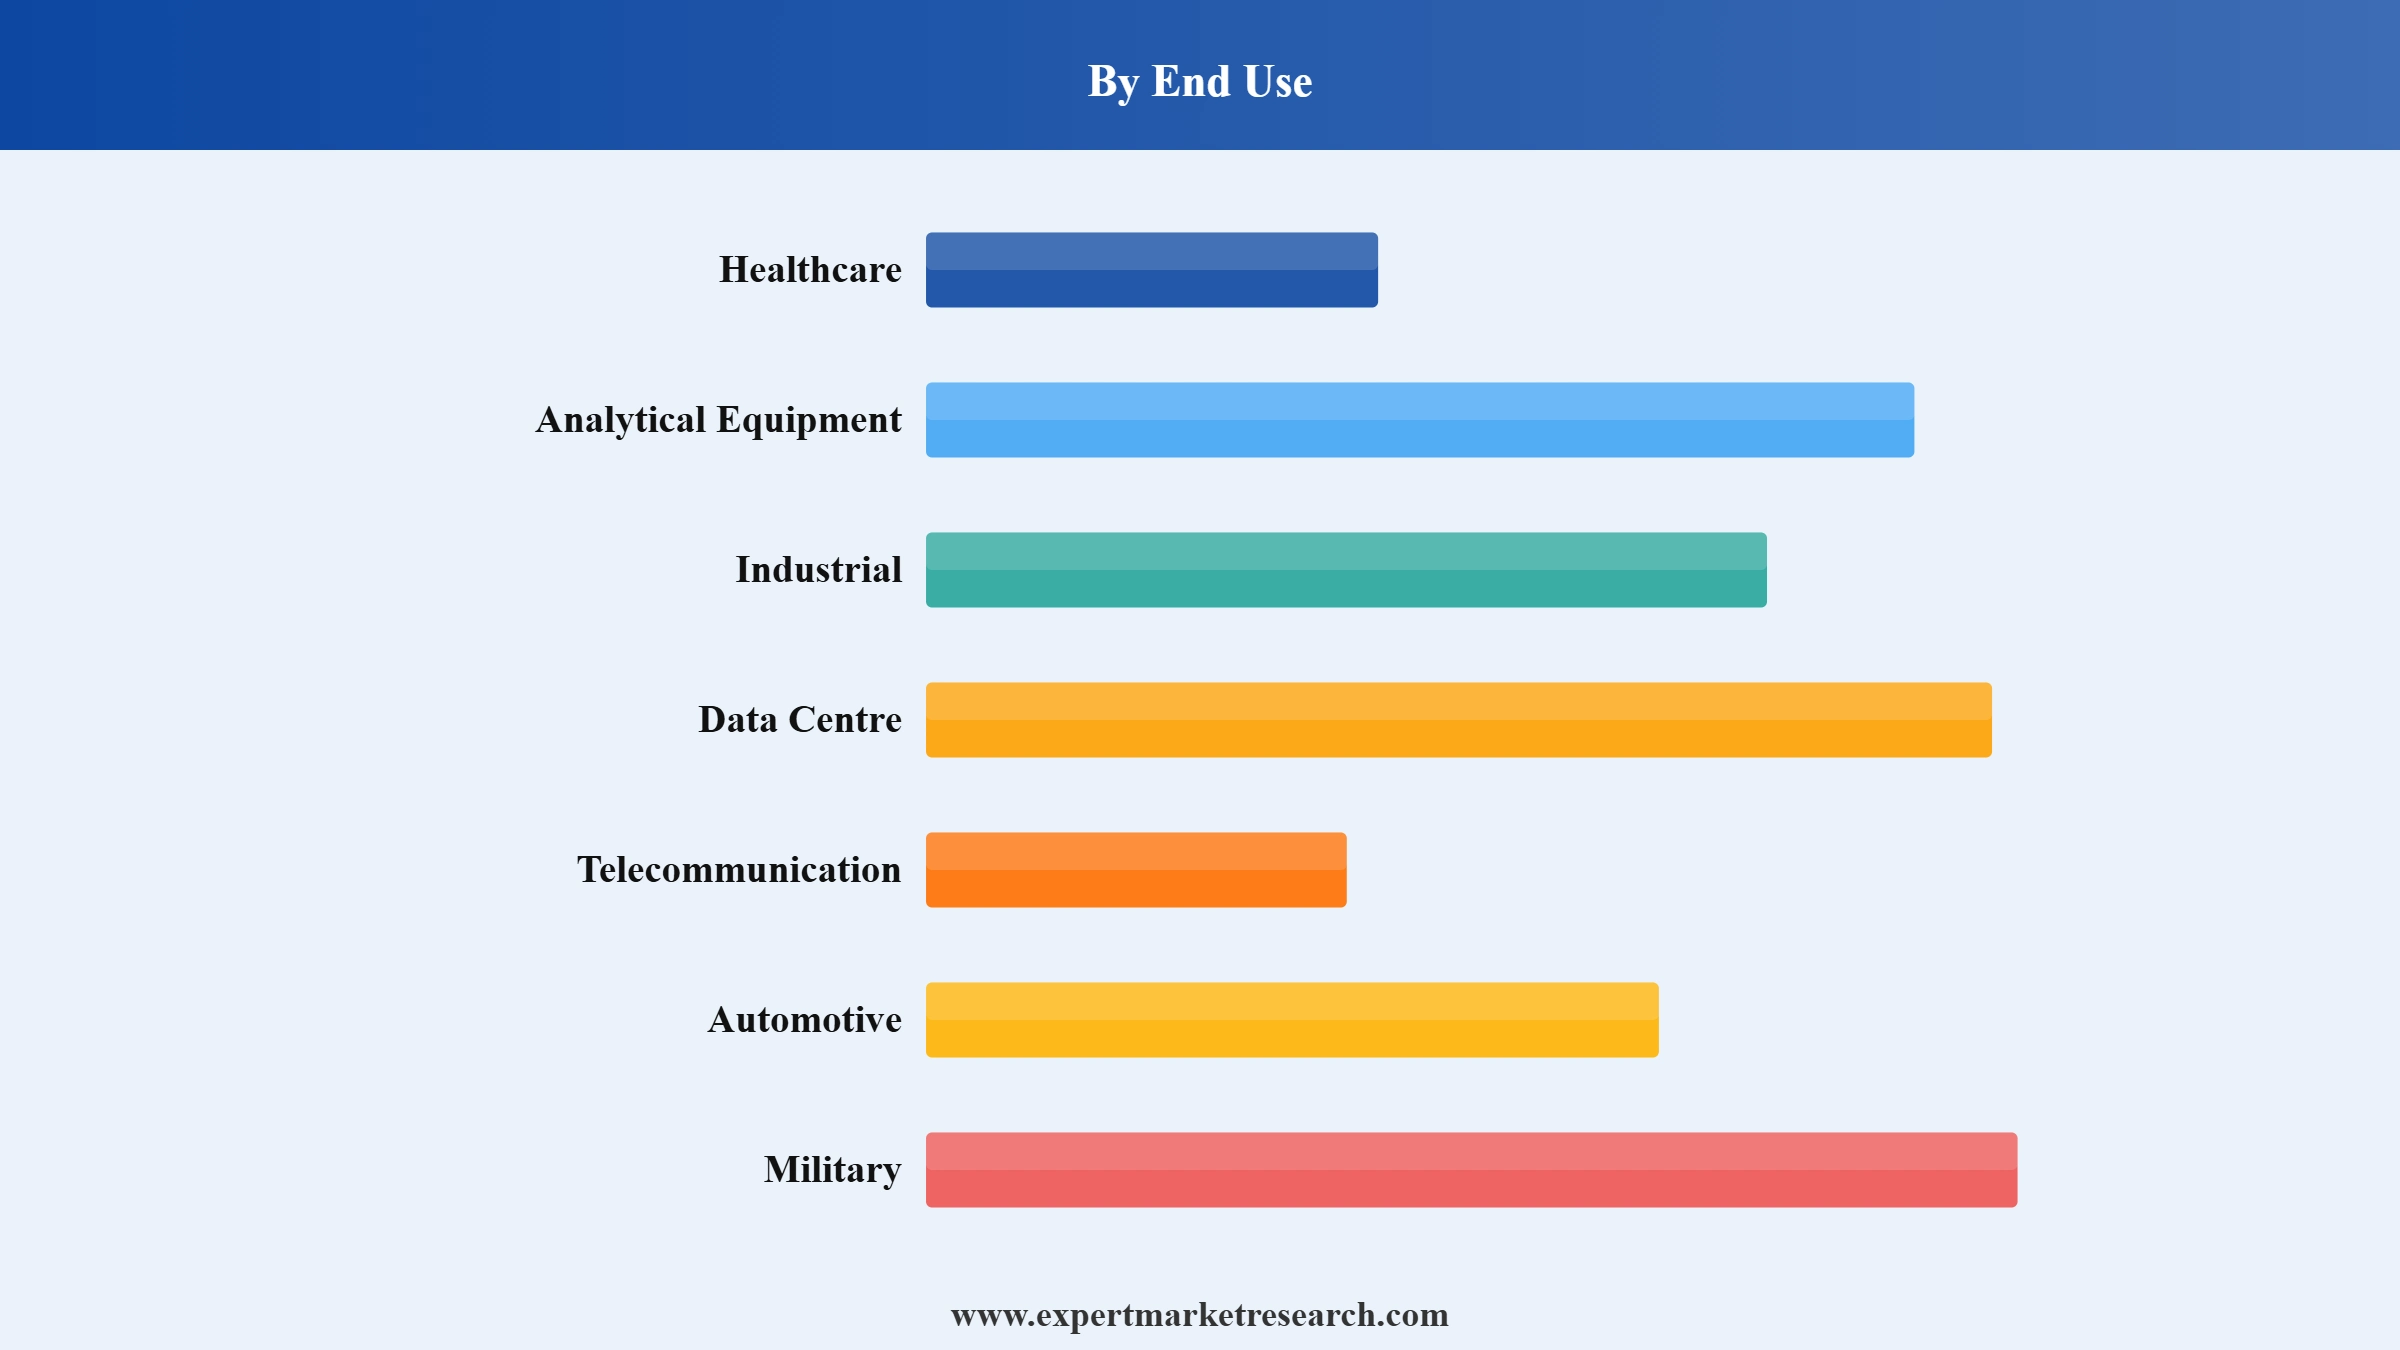
Market Breakup by End Use
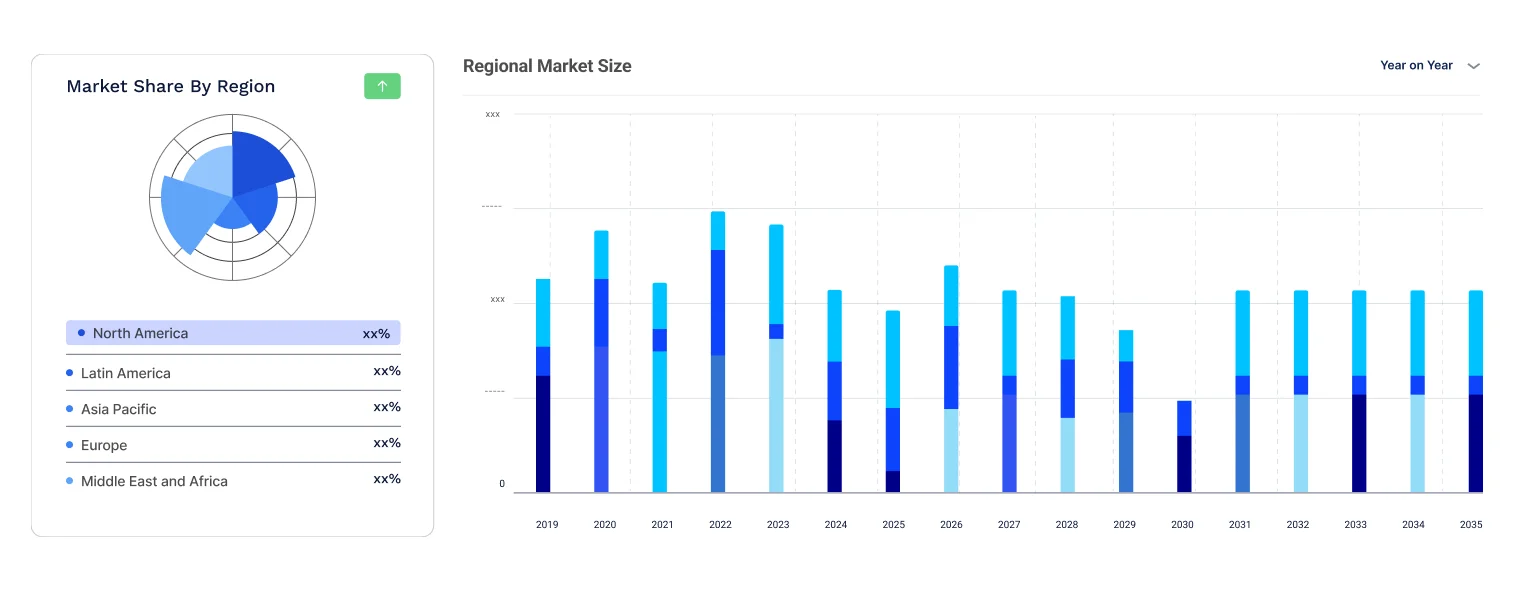
Market Breakup by Region
Read more about this report - REQUEST FREE SAMPLE COPY IN PDF
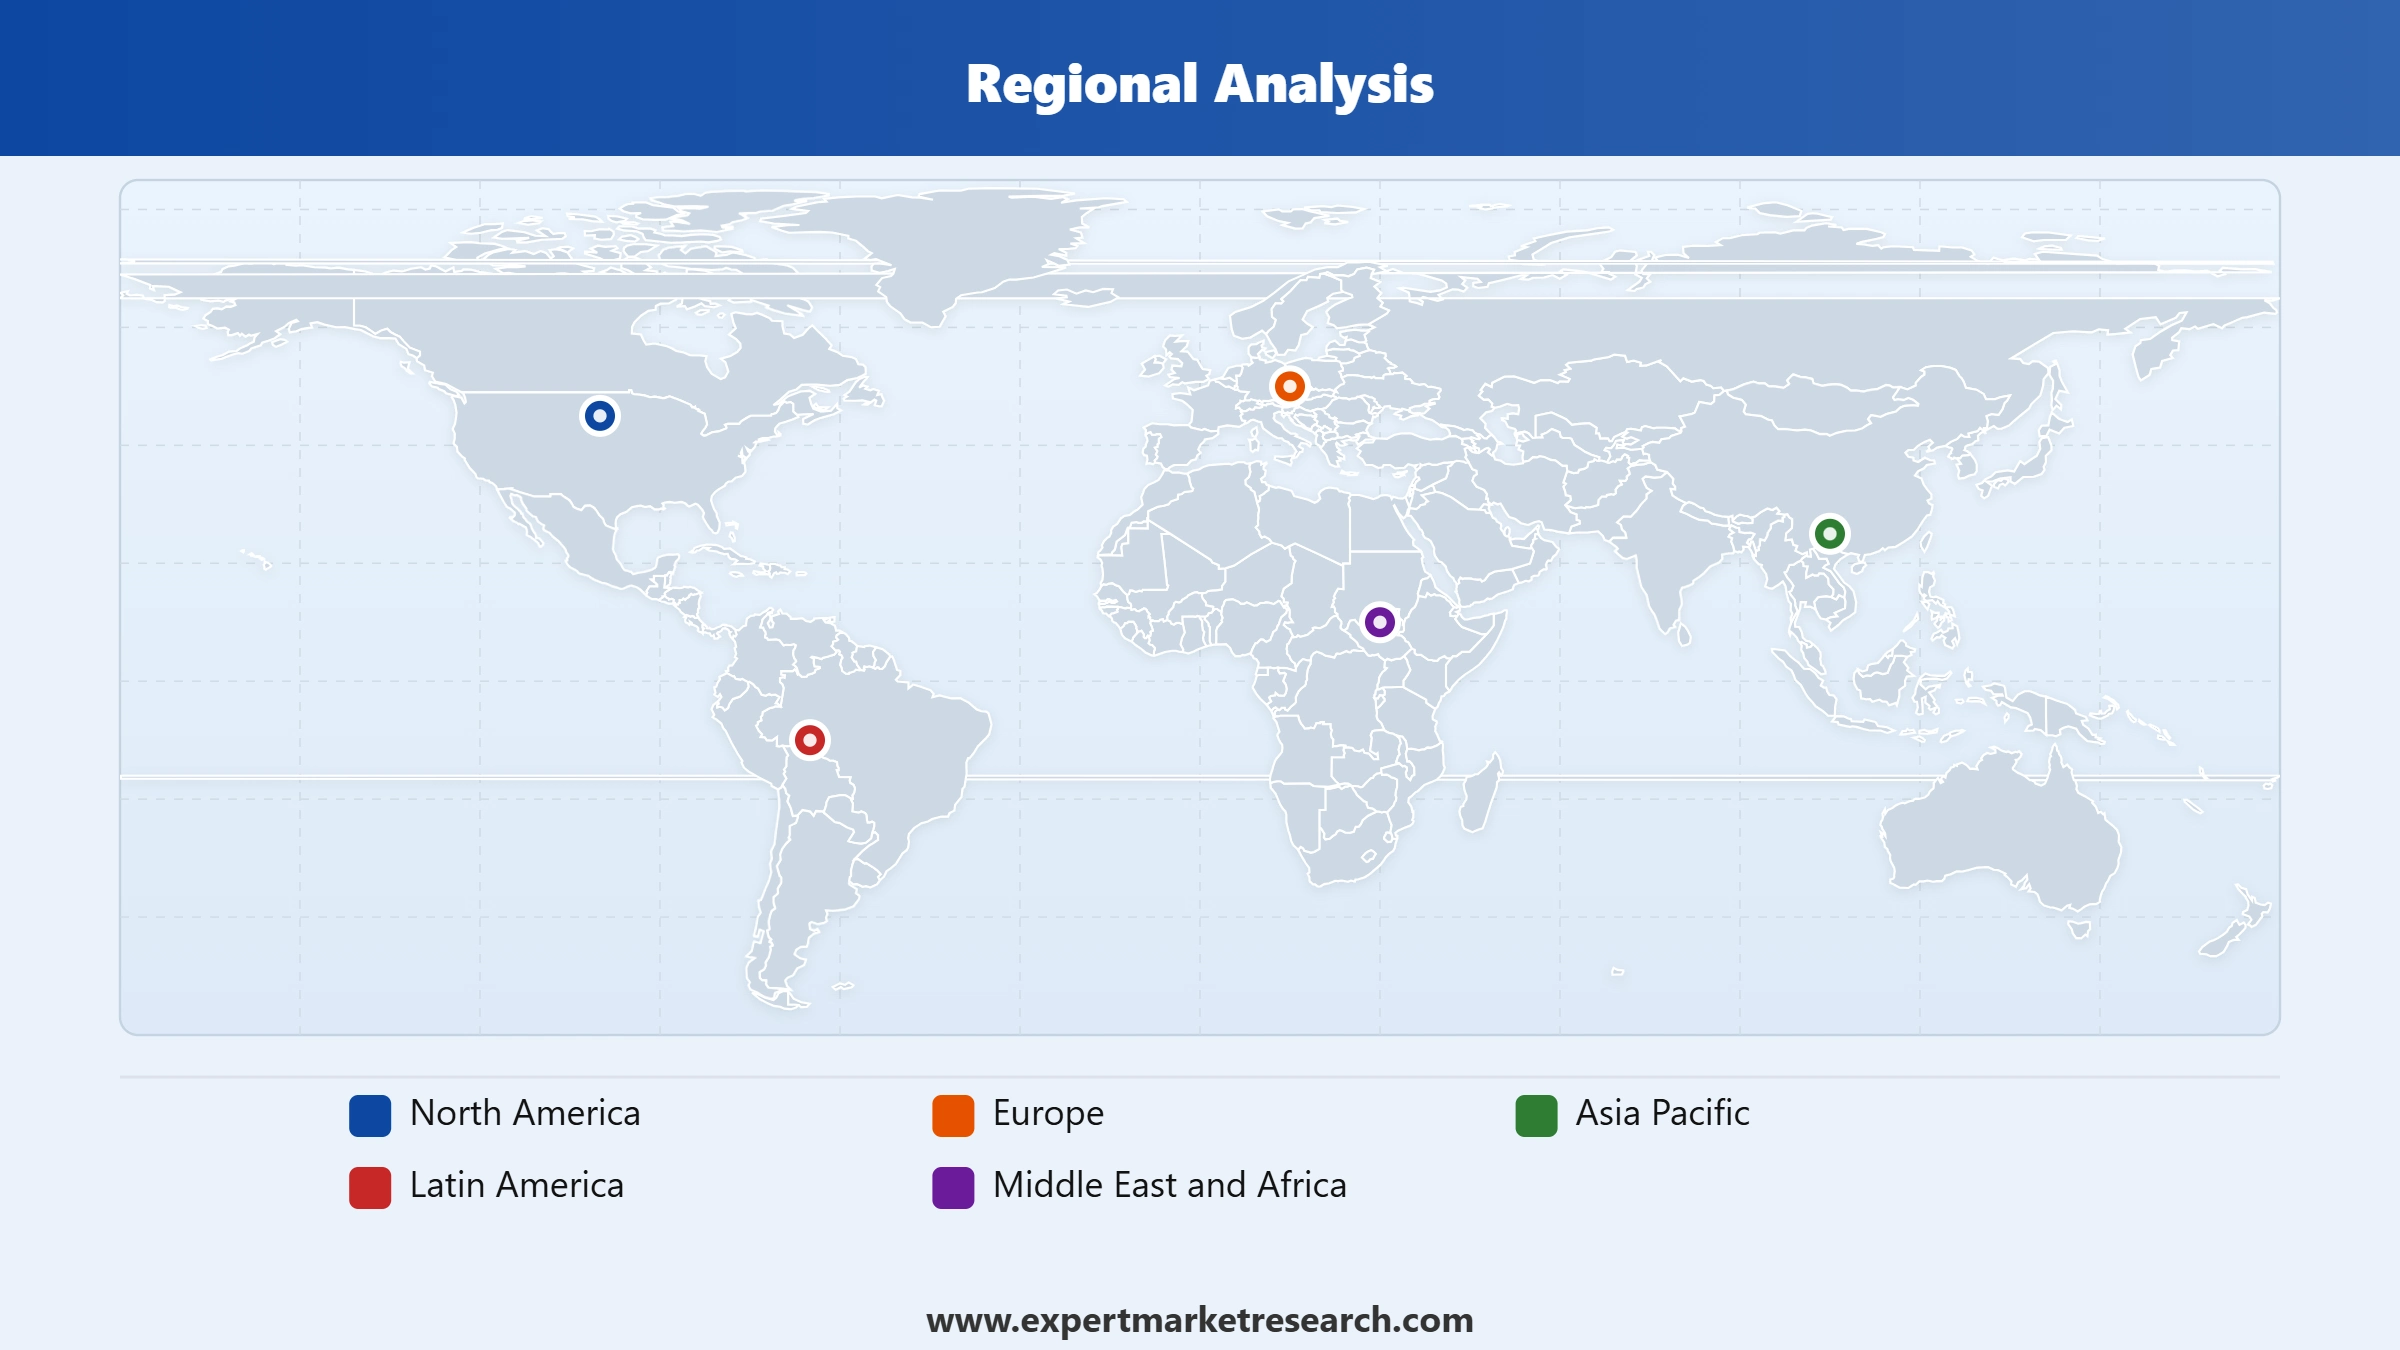
North America
North America holds the largest market share, led by the United States, which the report notes accounts for around 33% of global data centres. The Northern Virginia cluster, spanning Loudoun, Prince William, and Fairfax counties, anchors hyperscale demand from Amazon Web Services, Microsoft Azure, Google Cloud, and Meta Platforms, driving rapid adoption of liquid cooling for AI and high-density computing.
Europe
Europe is a mature, efficiency-driven market shaped by the EU Energy Efficiency Directive and sustainability reporting. Demand is concentrated in the Frankfurt, London, Amsterdam, Paris, and Dublin data centre hubs, with strong emphasis on low-PUE and water-conscious designs.
Asia Pacific
Asia Pacific is the fastest-growing region, at a 10.8% CAGR, driven by hyperscale expansion in China, India, Singapore, and Japan. India is the fastest-growing country market at a 12.4% CAGR, supported by rapid digitalization and data centre investment.
Read more about this report - REQUEST FREE SAMPLE COPY IN PDF
Latin America
Latin America is an emerging market led by Brazil, which grows at a 10.7% CAGR, alongside Mexico. Expanding cloud infrastructure and digital economies underpin demand.
Middle East and Africa
Middle East and Africa demand is rising with large data centre investments in the Gulf Cooperation Council economies, including Saudi Arabia and the United Arab Emirates, where hot climates make efficient cooling especially valuable.
The report presents a detailed analysis of the following key players in the global liquid cooling systems industry, looking into their capacity, market shares, and latest developments like capacity expansions, plant turnarounds, and mergers and acquisitions:
The EMR report gives an in-depth insight into the industry by providing a SWOT analysis as well as an analysis of Porter’s five forces.
The primary challenge for the liquid cooling systems market is the higher upfront investment and integration complexity compared with established air cooling. Retrofitting liquid systems into existing IT infrastructure requires compatible plumbing, manifolds, and coolant distribution units, while operators must manage the risk of leaks and spills and build new operational skills. Meeting diverse, customized cooling requirements across industries adds engineering and service demands.
Competition from entrenched air-cooling solutions and limited cross-vendor standardization act as restraints. The absence of universal interfaces for cold plates, connectors, and immersion tanks complicates procurement, and water availability and Water Usage Effectiveness concerns raise sustainability scrutiny in some regions. Legacy facility layouts and capital cycles slow adoption despite clear efficiency benefits.
The strongest opportunity lies in the construction and upgrading of data centres for artificial intelligence and high-performance computing, where heat densities make liquid cooling increasingly necessary. Rising emphasis on energy efficiency, lower Power Usage Effectiveness, and carbon reduction, together with the growth of edge computing, electric vehicle battery and power electronics cooling, and continued innovation in immersion and direct-to-chip systems, supports sustained value growth.


Upto 15% Off
USD
$2499 $2249
$3999 $3599
$4999 $4249
$5999 $5099


*While we strive to always give you current and accurate information, the numbers depicted on the website are indicative and may differ from the actual numbers in the main report. At Expert Market Research, we aim to bring you the latest insights and trends in the market. Using our analyses and forecasts, stakeholders can understand the market dynamics, navigate challenges, and capitalize on opportunities to make data-driven strategic decisions.*
The global liquid cooling systems market is projected to grow at a CAGR of 10.00% between 2026 and 2035.
The market is being driven by the rising market ownership of smartphones, which drives the demand for thermal management.
The market growth can be associated with the rising use of thermal management in engineering applications, such as nuclear reactors and micro equipment, among others.
The major regions in the industry are North America, Latin America, the Middle East and Africa, Europe, and the Asia Pacific.
The major product types of liquid cooling systems are liquid heat exchanger systems and compressor-based systems (recirculating chillers).
The significant end uses of liquid cooling systems include healthcare, analytical equipment, industrial, data centre, telecommunication, automotive, and military.
The major players in the industry are Laird Thermal Systems, Inc., Boyd Corporation, Rittal GmbH & Co. KG., Asetek, Inc., Schneider Electric, Green Revolution Cooling, Inc., and Midas Green Technologies LLC, among others.
The global liquid cooling systems market reached a value of USD 7.40 Billion in 2025.
The market is estimated to witness a healthy growth in the forecast period of 2026-2035 to reach USD 19.19 Billion by 2035.
Explore our key highlights of the report and gain a concise overview of key findings, trends, and actionable insights that will empower your strategic decisions.
| REPORT FEATURES | DETAILS |
| Base Year | 2025 |
| Historical Period | 2019-2025 |
| Forecast Period | 2026-2035 |
| Scope of the Report |
Historical and Forecast Trends, Industry Drivers and Constraints, Historical and Forecast Market Analysis by Segment:
|
| Breakup by Product Type |
|
| Breakup by End Use |
|
| Breakup by Region |
|
| Market Dynamics |
|
| Competitive Landscape |
|
| Companies Covered |
|
| Report Price and Purchase Option | Explore our purchase options that are best suited to your resources and industry needs. |
| Delivery Format | Delivered as an attached PDF and Excel through email, with an option of receiving an editable PPT, according to the purchase option. |
Datasheet
One User
USD 2,499
USD 2,249
tax inclusive*
Single User License
One User
USD 3,999
USD 3,599
tax inclusive*
Five User License
Five User
USD 4,999
USD 4,249
tax inclusive*
Corporate License
Unlimited Users
USD 5,999
USD 5,099
tax inclusive*
*Please note that the prices mentioned below are starting prices for each bundle type. Kindly contact our team for further details.*
Flash Bundle
Small Business Bundle
Growth Bundle
Enterprise Bundle
*Please note that the prices mentioned below are starting prices for each bundle type. Kindly contact our team for further details.*
Flash Bundle
Number of Reports: 3
20%
tax inclusive*
Small Business Bundle
Number of Reports: 5
25%
tax inclusive*
Growth Bundle
Number of Reports: 8
30%
tax inclusive*
Enterprise Bundle
Number of Reports: 10
35%
tax inclusive*
How To Order

Select License Type
Choose the right license for your needs and access rights.

Click on ‘Buy Now’
Add the report to your cart with one click and proceed to register.

Select Mode of Payment
Choose a payment option for a secure checkout. You will be redirected accordingly.
Strategic Solutions for Informed Decision-Making
Gain insights to stay ahead and seize opportunities.

Get insights & trends for a competitive edge.

Track prices with detailed trend reports.

Analyse trade data for supply chain insights.

Leverage cost reports for smart savings

Enhance supply chain with partnerships.

Connect For More Information
Our expert team of analysts will offer full support and resolve any queries regarding the report, before and after the purchase.
Our expert team of analysts will offer full support and resolve any queries regarding the report, before and after the purchase.
We employ meticulous research methods, blending advanced analytics and expert insights to deliver accurate, actionable industry intelligence, staying ahead of competitors.
Our skilled analysts offer unparalleled competitive advantage with detailed insights on current and emerging markets, ensuring your strategic edge.
We offer an in-depth yet simplified presentation of industry insights and analysis to meet your specific requirements effectively.




