

Consumer Insights
Uncover trends and behaviors shaping consumer choices today
Procurement Insights
Optimize your sourcing strategy with key market data
Industry Stats
Stay ahead with the latest trends and market analysis.
The global marine trade market attained a volume of 63548.49 billion ton-miles in 2025. The market is expected to grow at a CAGR of 2.20% during the forecast period of 2026-2035. By 2035, the market is expected to reach 78997.65 billion ton-miles.
As globalization intensifies, maritime trade continues to grow steadily. According to the UN Trade & Development, the global maritime trade surged by 2.4% in 2023, recovering from a 2022 contraction. The expansion of emerging markets, especially in Asia and Africa, is driving demand for raw materials, manufactured goods, and food products. Containerization and improved port infrastructure support the efficient movement of cargo across continents. Increased consumer demand and industrial production are prompting shipping lines to expand fleets and routes, solidifying marine trade as a vital pillar of the global economy.
Digital platforms are transforming the marine trade market dynamics by improving supply chain visibility, cargo tracking, and fleet management. Blockchain helps streamline documentation, while AI enhances route optimization and fuel consumption predictions. In February 2025, Windward launched an AI-powered system to monitor high-risk vessels and detect suspicious maritime activities, enhancing global shipping security. Cloud-based platforms allow stakeholders to coordinate better and respond to disruptions in real time. Greater digital transparency reduces fraud, expedites customs processes, and builds trust among international trading partners, making digitalization a competitive factor in marine trade logistics.
Compound Annual Growth Rate
2.2%
Value in billion ton-miles
2026-2035
Kings Infra celebrated the India–UK Free Trade Agreement (FTA), enabling duty-free marine exports to the United Kingdom. This boost helped to reduce costs, increases competitiveness, and opens new market opportunities for Indian marine products while strengthening trade ties, and making imports more affordable and attractive.
MSC launched its first ship management company in China, aiming to recruit 2,000 Chinese seafarers. This move strengthens MSC’s presence in the Chinese maritime sector, boosts local employment, and enhances operational efficiency. It reflects MSC’s commitment to expanding its workforce and tapping into China’s skilled maritime talent pool for global shipping growth.
India launched the Sagarmala Finance Corporation Limited (SMFCL), its first maritime sector Non-Banking Financial Company (NBFC), registered with the Reserve Bank of India. With this, SMFCL aims to bridge financing gaps and offer tailored financial solutions to ports, MSMEs, startups, and maritime institutions. This initiative aligns with the Maritime Amrit Kaal Vision 2047, fostering India's growth as a global maritime power.
Lloyd’s Register Foundation and the World Economic Forum launched a three-year partnership to transition global ports. The initiative aims to secure commitments from major ports, promote nature-positive investments in emerging markets, and unlock over USD 54 billion in opportunities by 2030 through strategies like clean energy adoption and ecosystem protection.
LNG, hydrogen, biofuels, and ammonia are gaining ground in the marine trade industry as viable alternatives to traditional bunker fuels. These low-emission fuels help shipping companies meet global carbon targets while navigating stricter fuel quality standards. Ports are developing LNG bunkering infrastructure, and engine manufacturers are producing dual-fuel and hybrid systems. In July 2025, TotalEnergies and CMA CGM formed a 50/50 joint venture to provide LNG bunkering services at the Port of Rotterdam project, projected to begin in 2028. This shift not only supports compliance with environmental laws but also creates new marine trade routes and fuel supply chains around alternative energy hubs.
Ports worldwide are undergoing massive upgrades to accommodate larger vessels and higher trade volumes. Smart port technologies including IoT sensors, AI-driven logistics, and automated cranes enhance cargo handling efficiency and reduce turnaround time. In November 2023, Eco Marine Power and Surfwave launched SurfGate, a smart IoT maritime router supporting Ethernet, BLE, EnOcean, and sensor connectivity. Countries are investing in deepwater ports and digital control systems to become regional trade hubs. This modernization improves connectivity between sea, rail, and road networks, enabling smoother supply chain operations and making ports more attractive to international shipping lines.
The explosion of e-commerce across the globe is significantly increasing marine trade demand for faster and more frequent maritime shipments. According to Oberlo, the global number of online buyers hit 2.71 billion in 2024. Retailers are relying on just-in-time delivery models, making supply chain timing more critical than ever. As a result, shipping lines are optimizing container load factors and schedules, while ports adapt to quicker unloading processes. This trend fuels demand for small container vessels and short-sea shipping routes, especially between regional ports near consumer markets.
Tighter environmental regulations, such as IMO 2020 and the push for decarbonization, are transforming marine trade operations. Shipowners are adopting cleaner fuels like LNG, investing in scrubbers, and exploring zero-emission vessels. Regulatory pressure is accelerating innovation in fuel efficiency and sustainable shipping practices. These changes increase operating costs but also open opportunities for green technologies and services, shaping future trade patterns around low-emission ports and compliant fleets. These shifts are also prompting stronger collaboration between ports, shipbuilders, and tech providers to accelerate the transition to greener maritime ecosystems.
Major ports and shipping companies are collaborating to establish green shipping corridors is adding to the marine trade industry share. This is driven by zero-emission vessels and supported by clean fuel infrastructure. In April 2024, X-Press Feeders signed an MOU with six European ports to develop green shipping corridors using zero-emission and eco-friendly vessels. These corridors are expected to become essential to meeting global climate goals and will likely receive investment incentives, reshaping how and where marine trade flows over the next decade.
Read more about this report - REQUEST FREE SAMPLE COPY IN PDF
The EMR’s report titled “Marine Trade Market Report and Forecast 2026-2035” offers a detailed analysis of the market based on the following segments:
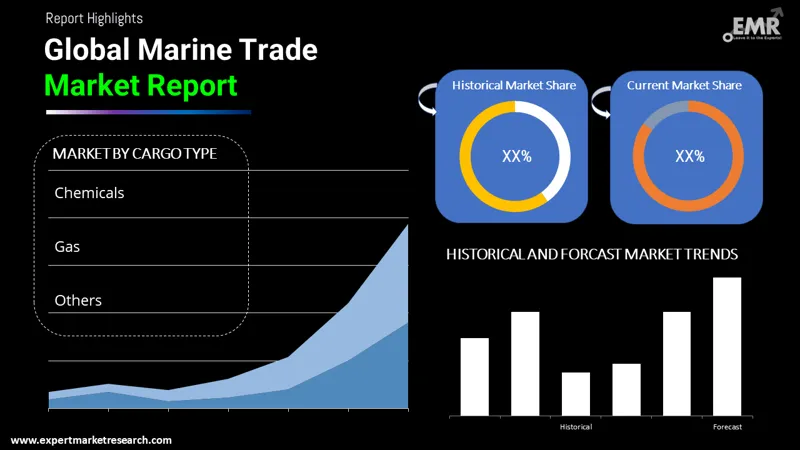
Market Breakup by Cargo Type
Key Insight: The oil segment forms the largest segment of marine cargo by volume. This is due to the rising prominence of crude oil and refined petroleum products. As per government data, the United Kingdom imports of crude oil and oil products surged to total 1.4 million tons in liquid bulk trade with the United States in 2024. The Middle East remains the top exporter, while Asia and Europe lead in imports. Major tanker routes include the Strait of Hormuz and the Suez Canal. Leading companies including Saudi Aramco and Shell heavily rely on VLCCs and ULCCs. Oil shipping is volatile, driven by geopolitics, sanctions, and OPEC+ decisions affecting global supply flows.
Market Breakup by Region
Key Insight: Asia Pacific dominates the global marine trade market expansion, handling over 40% of global seaborne cargo volume. The region is home to world’s busiest ports, including Shanghai, Singapore, and Ningbo-Zhoushan. China dominates exports in manufactured goods, electronics, and steel, while also being the top importer of crude oil, coal, and iron ore. As per data from Energy Institute, China imported 11.1 million barrels of crude oil per day in 2024. Rapid urbanization, infrastructure development, and the rise of Southeast Asian economies further fuel growth.
Read more about this report - REQUEST FREE SAMPLE COPY IN PDF
Containers & Main Bulks to Boost Marine Trade
Containers represent the most valuable segment of the marine trade industry. Container shipping enables the seamless global movement of high-value manufactured goods, electronics, pharmaceuticals, and perishables, making it essential to global supply chains. In August 2025, China launched an 18-day Arctic Express containership route to Europe, reducing transit time with stops in the United Kingdom, Germany, and Poland. The efficiency of containerization has reduced costs, standardized logistics, and transformed ports into highly automated hubs. Moreover, container shipping is at the forefront of decarbonization, with operators like Maersk launching methanol-powered vessels and investing in green corridors.
Main bulks, including iron ore, coal, and grain, are essential for global industries and food supply. These commodities form the backbone of industrial production, energy generation, and agricultural trade. Iron ore from Australia and Brazil fuels Asia’s steel industry, while coal remains a key energy source for nations, such as India and China. Grain shipments from the United States, Ukraine, and Argentina support global food security. Bulk carriers like Capesize and Panamax vessels dominate these trades, closely tied to commodity price cycles and seasonal harvest patterns.


Thriving Marine Trade Industry in Europe & North America
Europe marine trade market is known for its dense network of interconnected ports and its central role in global container, energy, and Ro-Ro trades. Key hubs include Rotterdam, Antwerp, and Hamburg, which handle vast amounts of dry bulk, crude oil, and containers. Europe is also a major importer of LNG. As per International Gas Union’s 2025 World LNG Report, the European LNG imports hit 100.07 million tons in 2024. The EU Green Deal and Fit for 55 policies are driving massive investment in shore power, alternative fuels, and green shipping corridors. Inland waterway connectivity further strengthens trade flow efficiency.
North America remains a vital player in global marine trade, with major ports like Los Angeles, Houston, New York/New Jersey, and Vancouver facilitating billions in goods. The region is a top exporter of agricultural products, LNG, and petrochemicals, and a key importer of consumer goods from Asia. In December 2024, The United States government committed USD 21 billion for modernizing the country’s port infrastructure in a bid to enhance cargo handling capabilities, improve efficiency, and support economic growth. Investments in automation and decarbonization, such as electric cranes and cold ironing are also increasing to meet future trade demands.
Unlock strategic insights with our comprehensive Marine Trade Market Report 2026 – 2035. Understand emerging opportunities, regulatory shifts, and technological innovations shaping the future of global shipping. Whether you're targeting high-growth regions or tracking marine trade market trends 2026, this report provides the depth and clarity you need. Download your free sample now and stay ahead in the competitive marine logistics landscape.
Upto 15% Off
USD
$2499 $2249
$3999 $3599
$4999 $4249
$5999 $5099


*While we strive to always give you current and accurate information, the numbers depicted on the website are indicative and may differ from the actual numbers in the main report. At Expert Market Research, we aim to bring you the latest insights and trends in the market. Using our analyses and forecasts, stakeholders can understand the market dynamics, navigate challenges, and capitalize on opportunities to make data-driven strategic decisions.*
In 2025, the market reached an approximate volume of 63548.49 billion ton-miles.
The market is projected to grow at a CAGR of 2.20% between 2026 and 2035.
The market is estimated to witness a healthy growth in the forecast period of 2026-2035, reaching 78997.65 billion ton-miles by 2035.
Key strategies driving the market include fleet modernization with fuel-efficient and alternative fuel vessels, digitalization of port operations for faster turnaround, expansion of green shipping corridors, and strategic partnerships across global shipping alliances. Investments in automation, cold ironing, and AI-powered logistics are improving efficiency and compliance. Additionally, trade diversification and infrastructure upgrades in emerging economies are expanding access and resilience across key maritime routes.
The key trends of the market are rising disposable income, increasing demand for eco-friendly ships, and growing demand for cost-efficient ways of transportation.
The various cargo types in the market for marine trade are chemicals, gas, oil, other dry cargo, containers, minor dry bulk, and main bulks.
Marine trade is a type of trade that involves transportation of bulk as well as other types of goods through water routes with the help of marine vessels.
The major regions in the market for marine trade, according to the report, are North America, Europe, Asia Pacific, Latin America, and the Middle East and Africa.
Asia Pacific dominates the market, accounting for major seaborne cargo volume and housing the world’s busiest ports, including Shanghai, Singapore, and Ningbo-Zhoushan.
The key challenges in the market include high fuel costs, regulatory pressures for decarbonization, port congestion, and global supply chain disruptions. Geopolitical tensions, labor disputes, and infrastructure limitations further hinder efficiency. Additionally, transitioning to green technologies requires significant capital investment, posing risks for smaller operators and emerging market participants.
Explore our key highlights of the report and gain a concise overview of key findings, trends, and actionable insights that will empower your strategic decisions.
| REPORT FEATURES | DETAILS |
| Base Year | 2025 |
| Historical Period | 2019-2025 |
| Forecast Period | 2026-2035 |
| Scope of the Report |
Historical and Forecast Trends, Industry Drivers and Constraints, Historical and Forecast Market Analysis by Segment:
|
| Breakup by Cargo Type |
|
| Breakup by Region |
|
| Market Dynamics |
|
Datasheet
One User
USD 2,499
USD 2,249
tax inclusive*
Single User License
One User
USD 3,999
USD 3,599
tax inclusive*
Five User License
Five User
USD 4,999
USD 4,249
tax inclusive*
Corporate License
Unlimited Users
USD 5,999
USD 5,099
tax inclusive*
*Please note that the prices mentioned below are starting prices for each bundle type. Kindly contact our team for further details.*
Flash Bundle
Small Business Bundle
Growth Bundle
Enterprise Bundle
*Please note that the prices mentioned below are starting prices for each bundle type. Kindly contact our team for further details.*
Flash Bundle
Number of Reports: 3
20%
tax inclusive*
Small Business Bundle
Number of Reports: 5
25%
tax inclusive*
Growth Bundle
Number of Reports: 8
30%
tax inclusive*
Enterprise Bundle
Number of Reports: 10
35%
tax inclusive*
How To Order

Select License Type
Choose the right license for your needs and access rights.

Click on ‘Buy Now’
Add the report to your cart with one click and proceed to register.

Select Mode of Payment
Choose a payment option for a secure checkout. You will be redirected accordingly.
Strategic Solutions for Informed Decision-Making
Gain insights to stay ahead and seize opportunities.

Get insights & trends for a competitive edge.

Track prices with detailed trend reports.

Analyse trade data for supply chain insights.

Leverage cost reports for smart savings

Enhance supply chain with partnerships.

Connect For More Information
Our expert team of analysts will offer full support and resolve any queries regarding the report, before and after the purchase.
Our expert team of analysts will offer full support and resolve any queries regarding the report, before and after the purchase.
We employ meticulous research methods, blending advanced analytics and expert insights to deliver accurate, actionable industry intelligence, staying ahead of competitors.
Our skilled analysts offer unparalleled competitive advantage with detailed insights on current and emerging markets, ensuring your strategic edge.
We offer an in-depth yet simplified presentation of industry insights and analysis to meet your specific requirements effectively.


