

Consumer Insights
Uncover trends and behaviors shaping consumer choices today
Procurement Insights
Optimize your sourcing strategy with key market data
Industry Stats
Stay ahead with the latest trends and market analysis.
The global nano copper oxide market size reached a value of approximately USD 165.70 Million in 2025. The market is further projected to grow at a CAGR of 14.00% between 2026 and 2035, reaching a value of USD 614.29 Million by 2035.
Compound Annual Growth Rate
14%
Value in USD Million
2026-2035
Nano copper oxide is a nanomaterial with exceptional physiochemical properties that aids in improving the performance of various end products. Nano copper oxide is synthesised by using copper chloride, sodium hydroxide, and copper nitrate as stabilising agents and is cost efficient and superconductive and photovoltaic, among others, in nature.
The EMR’s report titled “Nano Copper Oxide Market Report and Forecast 2026-2035" offers a detailed analysis of the market based on the following segments:
Market Breakup by Type
Market Breakup by End Use
Market Breakup by Region
Read more about this report - REQUEST FREE SAMPLE COPY IN PDF
By end use, paints and coatings are projected to significantly drive the demand growth for nano copper oxide in the upcoming years. This growth can be attributed to the protective and sealing nature of the nano copper oxide derived paints and coatings. Due to their antimicrobial properties, nano copper oxide particles are used in the form of polymer coatings that are then mixed with paints. They also improve the functionality and efficacy of the paint due to which the demand for nano copper oxide-based paints and coatings is increasing from the automotive industry.


The nano copper oxide market is anticipated to witness significant growth in the Asia Pacific region over the forecast period. The increasing demand for various electronic devices by countries such as China, Japan, and India is propelling the usage of nano copper oxide in the Asia Pacific region. The utilisation of nano copper oxide in the production of paints and coatings is also growing as it aids in developing antifouling paints and inhibits the growth of microbes, including algae and fungus, among others.
The comprehensive EMR report provides an in-depth assessment of the market based on the Porter's five forces model along with giving a SWOT analysis. The report gives a detailed analysis of the following key players in the global nano copper oxide market, covering their competitive landscape and latest developments like mergers, acquisitions, investments, and expansion plans.
Inframat Corporation was founded in 1996 and is headquartered in Connecticut, United States. The company is known for producing nanostructured materials for improving the performance and extending the lifespan of coated materials.
Hongwu International Group Ltd is a supplier and professional manufacturer of nanopowders, nanomaterials, and nanowires, among others. The company was established in 2012 and is based in Guangdong, China.
Nanoshel LLC is a nanotechnology company that supplies and manufactures carbon nanotubes and was founded in 2005. The company is headquartered in Delaware, United States and specialises in the commercialisation of nanoparticles and high-quality, innovative materials.
*Please note that this is only a partial list; the complete list of key players is available in the full report. Additionally, the list of key players can be customized to better suit your needs.*
Other major nano copper oxide market players include Nanostructured & Amorphous Materials, Inc., PlasmaChem GmbH, SkySpring Nanomaterials, Inc., and Alfa Chemistry, among others.
Upto 15% Off
USD
$2499 $2249
$3999 $3599
$4999 $4249
$5999 $5099


*While we strive to always give you current and accurate information, the numbers depicted on the website are indicative and may differ from the actual numbers in the main report. At Expert Market Research, we aim to bring you the latest insights and trends in the market. Using our analyses and forecasts, stakeholders can understand the market dynamics, navigate challenges, and capitalize on opportunities to make data-driven strategic decisions.*
The market reached a value of approximately USD 165.70 Million in 2025.
The market is projected to grow at a CAGR of 14.00% between 2026 and 2035.
The market is estimated to witness a healthy growth in the forecast period of 2026-2035 to reach USD 614.29 Million by 2035.
The major market drivers include rising adoption of nanotechnology by various industries and increasing awareness about the potential of nano copper oxide in the development of energy storage systems.
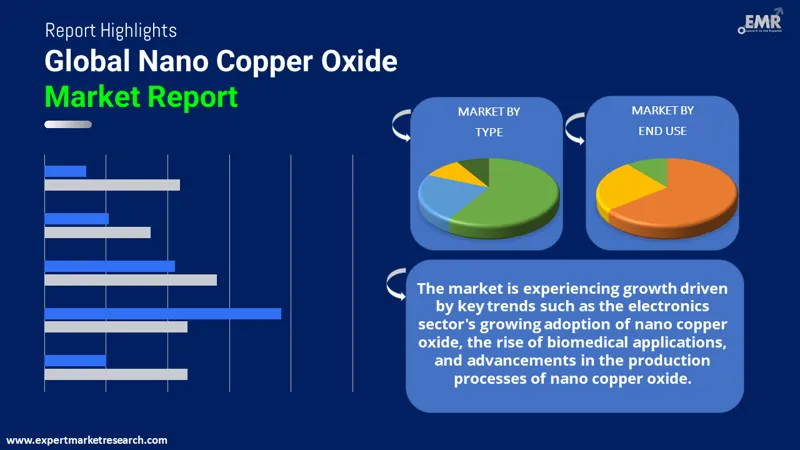
The key trends fuelling the growth of the market include the increasing adoption of nano copper oxide by the electronics sector, rising biomedical applications, and technological advancements in nano copper oxide production processes.
The major regions in the market are North America, Europe, the Asia Pacific, Latin America, and the Middle East and Africa.
The end uses of nano copper oxide include electrical and electronics, energy storage, paints and coatings, and catalysts, among others.
The key players in the global nano copper oxide market are Inframat Corporation, Hongwu International Group Ltd, Nanoshel LLC, Nanostructured & Amorphous Materials, Inc., PlasmaChem GmbH, SkySpring Nanomaterials, Inc., and Alfa Chemistry, among others.
Explore our key highlights of the report and gain a concise overview of key findings, trends, and actionable insights that will empower your strategic decisions.
| REPORT FEATURES | DETAILS |
| Base Year | 2025 |
| Historical Period | 2019-2025 |
| Forecast Period | 2026-2035 |
| Scope of the Report |
Historical and Forecast Trends, Industry Drivers and Constraints, Historical and Forecast Market Analysis by Segment:
|
| Breakup by Type |
|
| Breakup by End Use |
|
| Breakup by Region |
|
| Market Dynamics |
|
| Competitive Landscape |
|
| Companies Covered |
|
Datasheet
One User
USD 2,499
USD 2,249
tax inclusive*
Single User License
One User
USD 3,999
USD 3,599
tax inclusive*
Five User License
Five User
USD 4,999
USD 4,249
tax inclusive*
Corporate License
Unlimited Users
USD 5,999
USD 5,099
tax inclusive*
*Please note that the prices mentioned below are starting prices for each bundle type. Kindly contact our team for further details.*
Flash Bundle
Small Business Bundle
Growth Bundle
Enterprise Bundle
*Please note that the prices mentioned below are starting prices for each bundle type. Kindly contact our team for further details.*
Flash Bundle
Number of Reports: 3
20%
tax inclusive*
Small Business Bundle
Number of Reports: 5
25%
tax inclusive*
Growth Bundle
Number of Reports: 8
30%
tax inclusive*
Enterprise Bundle
Number of Reports: 10
35%
tax inclusive*
How To Order

Select License Type
Choose the right license for your needs and access rights.

Click on ‘Buy Now’
Add the report to your cart with one click and proceed to register.

Select Mode of Payment
Choose a payment option for a secure checkout. You will be redirected accordingly.
Strategic Solutions for Informed Decision-Making
Gain insights to stay ahead and seize opportunities.

Get insights & trends for a competitive edge.

Track prices with detailed trend reports.

Analyse trade data for supply chain insights.

Leverage cost reports for smart savings

Enhance supply chain with partnerships.

Connect For More Information
Our expert team of analysts will offer full support and resolve any queries regarding the report, before and after the purchase.
Our expert team of analysts will offer full support and resolve any queries regarding the report, before and after the purchase.
We employ meticulous research methods, blending advanced analytics and expert insights to deliver accurate, actionable industry intelligence, staying ahead of competitors.
Our skilled analysts offer unparalleled competitive advantage with detailed insights on current and emerging markets, ensuring your strategic edge.
We offer an in-depth yet simplified presentation of industry insights and analysis to meet your specific requirements effectively.


