

Consumer Insights
Uncover trends and behaviors shaping consumer choices today
Procurement Insights
Optimize your sourcing strategy with key market data
Industry Stats
Stay ahead with the latest trends and market analysis.
The global nisin market attained a value of USD 370.24 Million in 2025 and is projected to expand at a CAGR of 5.40% through 2035. The market is further expected to achieve USD 626.45 Million by 2035. The growing popularity of processed foods that are made from plants is leading to the increased usage of nisin because there is an urgent need for a stable and natural antimicrobial product to ensure food longevity without jeopardizing clean label requirements.
According to Food Navigator, leading ingredient suppliers including Kerry Group are scaling sustainable fermentation upgrades to expand natural antimicrobial and yeast-derivative output across European facilities. The push supports accelerating reformulation of processed meats and dairy with bacteriocins such as nisin, as retailers tighten clean-label specifications and manufacturers replace synthetic preservatives to meet evolving EU food-additive review cycles.
As reported by EFSA, on 20 January 2026 the European Food Safety Authority published revised guidance on scientific data requirements for food additive authorisation under Regulation (EC) No 1331/2008, applicable from 20 July 2026. The update clarifies specifications and stability data expectations for natural preservatives including nisin (E234), tightening evidence standards that will shape future approvals for bacteriocins across bakery, meat, and dairy formulations.
The nisin market trend toward increased investment into cold chain logistics is promoting higher usage of nisin in perishable food products such as seafood and minimally processed food packages. At the same time, the development of pharmaceutical and nutraceutical industries opens a new opportunity for the commercial application of nisin in antimicrobial preparations, both orally taken and applied externally.
Precision fermentation innovations and regulatory-approved clean label positioning strategies are driving the nisin market growth. In September 2025, dsm-firmenich introduced Dairy Safe cultures enabling additive-free cheese production, improved spoilage protection, enhanced flavor development, and greater process efficiency across diverse milk applications. This comes at a time when there is increased demand for organic preservatives among dairy and ready-to-eat product segments. Manufacturers are facing increasing pressure to incorporate preservatives that do not have any artificial components and maintain the required level of shelf stability.
Changes in food safety legislation and production systems geared towards exports are fueling demand in the nisin market. Regulatory authorities including the European Food Safety Authority and Food Safety and Standards Authority of India are tightening their supervision. As a result, he adoption of validated preservative products with proven natural compositions is now the norm. Furthermore, dairy and processed meat manufacturing companies are focusing on formulation modifications by incorporating nisin in order to cater to microbial safety standards. Premiumization is also evident among companies seeking to manufacture clean label products in high-income urban environments. For example, in April 2026, IFF highlighted science-led bioactive ingredients and AI-driven sensory solutions, reflecting growing parallels with nisin peptide development for functional, antimicrobial, and wellness-focused formulations.
Compound Annual Growth Rate
5.4%
Value in USD Million
2026-2035
Perfect Day made progress with its fermentation plant based in Gujarat, aiming at the large-scale production of recombinant proteins in response to global demand for sustainable and functional food ingredients. Innovations such as these showcase potential for the producers of nisin to use precision fermentation technologies that will allow them to produce antimicrobial peptides in a cost-effective manner.
IFF developed a smart dosing robot that allows for greater accuracy, efficiency, and consistency in formulating ingredients through automation technology. Innovations such as these give nisin market players the chance to develop smart dosing systems that will ensure greater consistency of formulations.
The use of nisin in egg white wraps was granted extended approval by Health Canada, allowing for greater utilization of natural preservatives within the ready-to-eat food segment. Such trends in the nisin market suggest opportunities for companies to pursue more regulatory approvals as well as diversification in terms of nisin uses within convenient foods.
Innovators successfully created transgenic carrots able to produce nisin, thereby developing a plant-based approach to antimicrobial production in food systems. This provides opportunities for companies to consider innovative means of cultivating crops for the production of nisin.
Innovations in fermentation technology are contributing significantly to the evolution of the nisin market. Firms are investing in genetic modifications and bioreactors to ensure improved product yield. Companies like Chr. Hansen Holding A/S are experiencing growth in fermentation yield via microbial strain development projects. Biotech government-supported innovations are facilitating advancements in industrial fermentation processes, enabling domestic firms to compete in global markets without compromising the supply of antimicrobial agents in foods. For example, in September 2025, scientists developed a new creamy dairy strain enhancing texture, stability, and flavor, supporting growing demand for functional fermented dairy products in China.
Regulatory policies are tightening concerning the use of chemical preservatives, redefining the nisin market dynamics and trends. The United States FDA is continuously granting approval for bio-preservatives across multiple applications, including ready-to-consume meals and dairy items. Such regulatory trends are compelling multinational food producers to adopt natural preservation strategies. Numerous European Union-based dairy firms are changing their formulas for cheese production due to increased microbial content safety standards set by regulatory authorities. For example, in November 2025, Kirin confirmed LC-Plasma postbiotic reduces fever and fatigue in high-risk individuals, supporting functional ingredient development for immune health and wellness applications.
The trend of nisin consumption in export-oriented dairy productions is increasing, accelerating the overall demand in the nisin market. Some of the examples include the use of nisin in cheese and other processed milk products. Countries such as New Zealand and India are increasing their levels of exporting dairy products and thus have incorporated the use of nisin to satisfy shelf-life expectations. In January 2026, researchers identified Lactococcus lactis strain producing 4-hydroxy-2-butanone, significantly enhancing creamy flavor and increasing compound yield through optimized co-fermentation processes. In response to such trends, companies are developing nisin-based products that meet safety and quality standard.
The trend in the consumption of ready-to-eat food products is positively impacting the nisin market growth. Manufacturers in urban areas are increasingly using nisin as a means to keep food products microbiologically stable and unaltered in terms of taste. The trend is supported by the urbanization trend where many Asian food brands were able to introduce ready meals without preservatives using the use of nisin-based products. Demonstrating this shift in the market, in March 2026, scientists developed engineered food system improving bioactive compound delivery and stability, supporting next-generation antimicrobial peptide applications like nisin in functional foods.
Strategic alliances between suppliers and manufacturers in the ingredients business are gaining popularity within the nisin market scope. Businesses have started making commitments of several years to ensure quality and stability of prices. For instance, companies like Galactic SA are focusing on strengthening its ties with regional food manufacturers in Latin America for further growth of bio-preservation. Furthermore, APAC countries' governments are promoting local manufacturing of fermentation-based ingredients by discouraging dependence on imports.
Read more about this report - REQUEST FREE SAMPLE COPY IN PDF
The EMR’s report titled “Global Nisin Market Report and Forecast 2026-2035” offers a detailed analysis of the market based on the following segments:
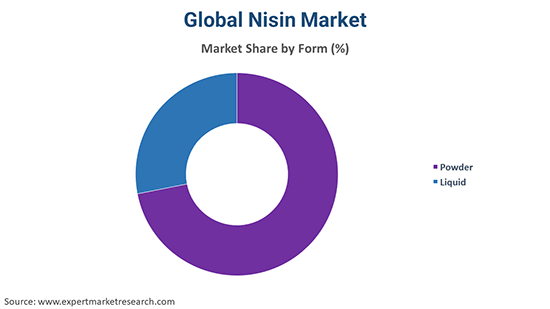
Market Breakup by Form
Key Insight: The segmentation of the nisin market, based on form, can be attributed to the focus of operations within food manufacturing plants. Nisin powder is preferred because of its stability, easy storability, and adaptability to dry processing techniques. On the other hand, the growth of liquid nisin in the market is associated with its efficiency and effectiveness during rapid incorporation into processes, especially within fluid systems in foods. This creates an equilibrium within the industry in which producers are adopting the appropriate form depending on their requirements and capabilities.
Market Breakup by End Use
Key Insight: The end-user approach highlights the importance of application-specific requirements in the acceptance of nisin. The dairy industry occupies the leading position in the nisin market owing to its susceptibility to microbial attacks and an intense emphasis on exporting its products. On the other hand, the ready-meal sector and other convenient food types are growing at a fast pace since producers aim to explore natural preservatives that suit changing consumer trends.
Market Breakup by Region
Key Insight: Segmentation based on regions is attributed to differences in maturity and regulatory environments that affect the use of nisin. The Asia Pacific nisin market is at the forefront owing to its large production capability and increasing emphasis on exports, whereas North America is fast expanding its market share due to the shift towards clean labels as a result of regulations. Europe continues to show consistent demand for nisin on account of its strict food safety standards.
Powder form dominates the market due to superior stability and handling
The powdered form of nisin continues to occupy a dominant nisin market position owing to its high storage stability and ability to be incorporated via dry-blending procedures in the manufacture of processed foods. The major reason why prominent dairy companies and processed meat exporting firms favor powder form of nisin includes accurate dosing properties and minimal risk of degradation when transported to different destinations. These products can also be incorporated in automated production procedures for the maintenance of consistency of the bactericidal activities. For example, Kirin offers iMUSE supplements targeting immunity, sleep, and metabolic health through functional ingredient innovation since October 2022.
The liquid form is poised to experience the highest growth in the nisin market, backed by its easy incorporation into continuous processing procedures. Beverage companies and processed ready meals manufacturers are resorting to liquid forms of nisin due to their convenience, eliminating pre-mixing stages in production operations. This product format is particularly important for applications requiring rapid dispersion, such as soups, sauces, and dairy beverages.
By end use, dairy products lead market growth due to high microbial sensitivity requirements
Dairy products continue to be the leading application category, owing to the stringent microbial safety norms maintained within the nisin market scope along with the export-oriented nature of the manufacturing process. Nisin is being effectively used in cheeses, pasteurized milk, and fermented dairy products to control spoilage bacteria without compromising taste and texture properties. Major players that export dairy products have started focusing on natural preservatives for meeting international health regulations and clean labeling practices. For instance, Chinova Bioworks offers Chiber, a mushroom-derived preservative delivering clean-label, broad-spectrum antimicrobial protection, replacing synthetic additives across dairy and plant-based dairy products.
Ready meals, soups, and noodles are among the fastest-growing segments, driven by the rising trend of urban consumers preferring minimally processed food products. The use of nisin in ready meals, soups, and noodles has increased significantly to ensure microbial stability in these products, without resorting to chemical preservatives. Producers of ready meals, soups, and noodles are utilizing the preservative power of nisin to comply with clean label requirements, while extending their shelf life.


Asia Pacific occupies a substantial share of the market due to expanding food processing capacity
The Asia Pacific region occupies a leading share in the global nisin market due to fast growth in the food processing sector and exports. Countries in the region are focusing on developing their fermentation plants and food safety regulations. Their high production capacity in milk and processed foods drives the need for natural preservatives like nisin. In addition, food quality regulations and exports programs undertaken by governments are driving producers to use bio-preservative methods. For example, in September 2025, India introduced AdFalciVax using Lactococcus lactis expression system, showcasing scalable recombinant peptide production, aligning with nisin-based antimicrobial development and bioengineering advancements.
North America is set to be the fastest-growing nisin market due to favorable regulation and consumer awareness. Food producers in the United States and Canada are making efforts to remove artificial preservatives from their products, thereby driving the use of nisin. Advanced food processing technology and cold storage in North America make nisin an efficient preservative ingredient in food products.
The global industry is increasingly becoming competitive, with nisin market players emphasizing strain development, application-based formulations, and strategic supply chain alliances. They are also making efforts towards maximizing fermentation and subsequent purification processes, which could help in maintaining higher consistency and better pricing.
Moreover, there has been a trend of customizing the nisin product based on specific requirements for dairy products, prepared meals, and vegetarian foods, thereby enabling manufacturers to differentiate themselves from other suppliers who offer commodity-like nisin. With their strategic tie-ups with food processing companies, nisin companies witness prospects for lucrative long-term contracts, which will help sustain their demand pipeline.
International Flavors & Fragrances Inc., founded in 1958 and located in New York, United States, is expanding its bio-preservation range using advanced fermentation and enzyme techniques. The company is combining nisin with other ingredients in systems to create solutions for reformulating the products for global food producers.
Zhejiang Silver-Elephant Bioengineering Co., Ltd. was founded in 1998 and is located in Zhejiang, China. The company specializes in large-scale production of nisin. It aims at providing products for exporting countries. The firm offers cost-effective fermentation processes with high purity grades for meat and dairy processors.
Established in 2008 and operating from Shandong, China, Shandong Freda Biotechnology Co., Ltd. is bolstering its market position through capacity expansions and increased diversification in its products. With a specific focus on pharmaceuticals and food uses, the firm is investing heavily in purification techniques as well as certification processes to keep up with international standards and increase competitiveness in valuable export sectors.
Handary S.A. was established in 2009, with its base located in Brussels, Belgium. This firm specializes in providing custom bio-preservation solutions through the use of nisin in combination with other natural components. Collaborating with food producers, the firm helps in the development of custom solutions especially for dairy products and ready-to-eat meals.
*Please note that this is only a partial list; the complete list of key players is available in the full report. Additionally, the list of key players can be customized to better suit your needs.*
Other key players in the market include Koninklijke DSM N.V., Galactic SA/NV, CHIHONBIO Co., Ltd., and Siveele B.V., among others.
Unlock the latest insights with our nisin market trends 2026 report. Discover regional growth patterns, consumer preferences, and key industry players. Stay ahead of competition with trusted data and expert analysis. Download your free sample report today and drive informed decisions in the market.
Upto 15% Off
USD
$3999 $3599
$2499 $2249
$4999 $4249
$5999 $5099


*While we strive to always give you current and accurate information, the numbers depicted on the website are indicative and may differ from the actual numbers in the main report. At Expert Market Research, we aim to bring you the latest insights and trends in the market. Using our analyses and forecasts, stakeholders can understand the market dynamics, navigate challenges, and capitalize on opportunities to make data-driven strategic decisions.*
In 2025, the market reached an approximate value of USD 370.24 Million.
The market is projected to grow at a CAGR of 5.40% between 2026 and 2035.
Investing in strain innovation, forming strategic supply agreements, expanding application-specific portfolios, optimizing fermentation processes, and targeting high-growth convenience food segments are enabling stakeholders to strengthen competitive positioning and scalability.
Growing consumption of ready-to-eat food products and rising consumer awareness regarding health hazards due to chemical preservatives found in food products are key trends propelling the growth of the market.
The major regions in the market are North America, Latin America, the Middle East and Africa, Europe, and the Asia Pacific.
Powder and liquid are the available forms of nisin in the global nisin market.
The end use segments of nisin in the market are beverages, bakery, confectionery, meat, poultry and seafood, dairy products, ready meals, soups and noodles, and snacks, among others.
The key players in the market include International Flavors & Fragrances Inc., Zhejiang Silver-Elephant Bioengineering Co., Ltd., Shandong Freda Biotechnology Co., Ltd., Handary S.A., Koninklijke DSM N.V., Galactic SA/NV, CHIHONBIO Co., Ltd., and Siveele B.V., among others.
Maintaining consistent fermentation yields, managing regulatory variations across regions, ensuring cost competitiveness against synthetic preservatives, and achieving stability in diverse food matrices remain key operational and commercial challenges for companies.
Explore our key highlights of the report and gain a concise overview of key findings, trends, and actionable insights that will empower your strategic decisions.
| REPORT FEATURES | DETAILS |
| Base Year | 2025 |
| Historical Period | 2019-2025 |
| Forecast Period | 2026-2035 |
| Scope of the Report |
Historical and Forecast Trends, Industry Drivers and Constraints, Historical and Forecast Market Analysis by Segment:
|
| Breakup by Form |
|
| Breakup by End Use |
|
| Breakup by Region |
|
| Market Dynamics |
|
| Competitive Landscape |
|
| Companies Covered |
|
| Report Price and Purchase Option | Explore our purchase options that are best suited to your resources and industry needs. |
| Delivery Format | Delivered as an attached PDF and Excel through email, with an option of receiving an editable PPT, according to the purchase option. |
Single User License
One User
USD 3,999
USD 3,599
tax inclusive*
Datasheet
One User
USD 2,499
USD 2,249
tax inclusive*
Five User License
Five User
USD 4,999
USD 4,249
tax inclusive*
Corporate License
Unlimited Users
USD 5,999
USD 5,099
tax inclusive*
*Please note that the prices mentioned below are starting prices for each bundle type. Kindly contact our team for further details.*
Flash Bundle
Small Business Bundle
Growth Bundle
Enterprise Bundle
*Please note that the prices mentioned below are starting prices for each bundle type. Kindly contact our team for further details.*
Flash Bundle
Number of Reports: 3
20%
tax inclusive*
Small Business Bundle
Number of Reports: 5
25%
tax inclusive*
Growth Bundle
Number of Reports: 8
30%
tax inclusive*
Enterprise Bundle
Number of Reports: 10
35%
tax inclusive*
How To Order

Select License Type
Choose the right license for your needs and access rights.

Click on ‘Buy Now’
Add the report to your cart with one click and proceed to register.

Select Mode of Payment
Choose a payment option for a secure checkout. You will be redirected accordingly.
Strategic Solutions for Informed Decision-Making
Gain insights to stay ahead and seize opportunities.

Get insights & trends for a competitive edge.

Track prices with detailed trend reports.

Analyse trade data for supply chain insights.

Leverage cost reports for smart savings

Enhance supply chain with partnerships.

Connect For More Information
Our expert team of analysts will offer full support and resolve any queries regarding the report, before and after the purchase.
Our expert team of analysts will offer full support and resolve any queries regarding the report, before and after the purchase.
We employ meticulous research methods, blending advanced analytics and expert insights to deliver accurate, actionable industry intelligence, staying ahead of competitors.
Our skilled analysts offer unparalleled competitive advantage with detailed insights on current and emerging markets, ensuring your strategic edge.
We offer an in-depth yet simplified presentation of industry insights and analysis to meet your specific requirements effectively.


