

Consumer Insights
Uncover trends and behaviors shaping consumer choices today
Procurement Insights
Optimize your sourcing strategy with key market data
Industry Stats
Stay ahead with the latest trends and market analysis.
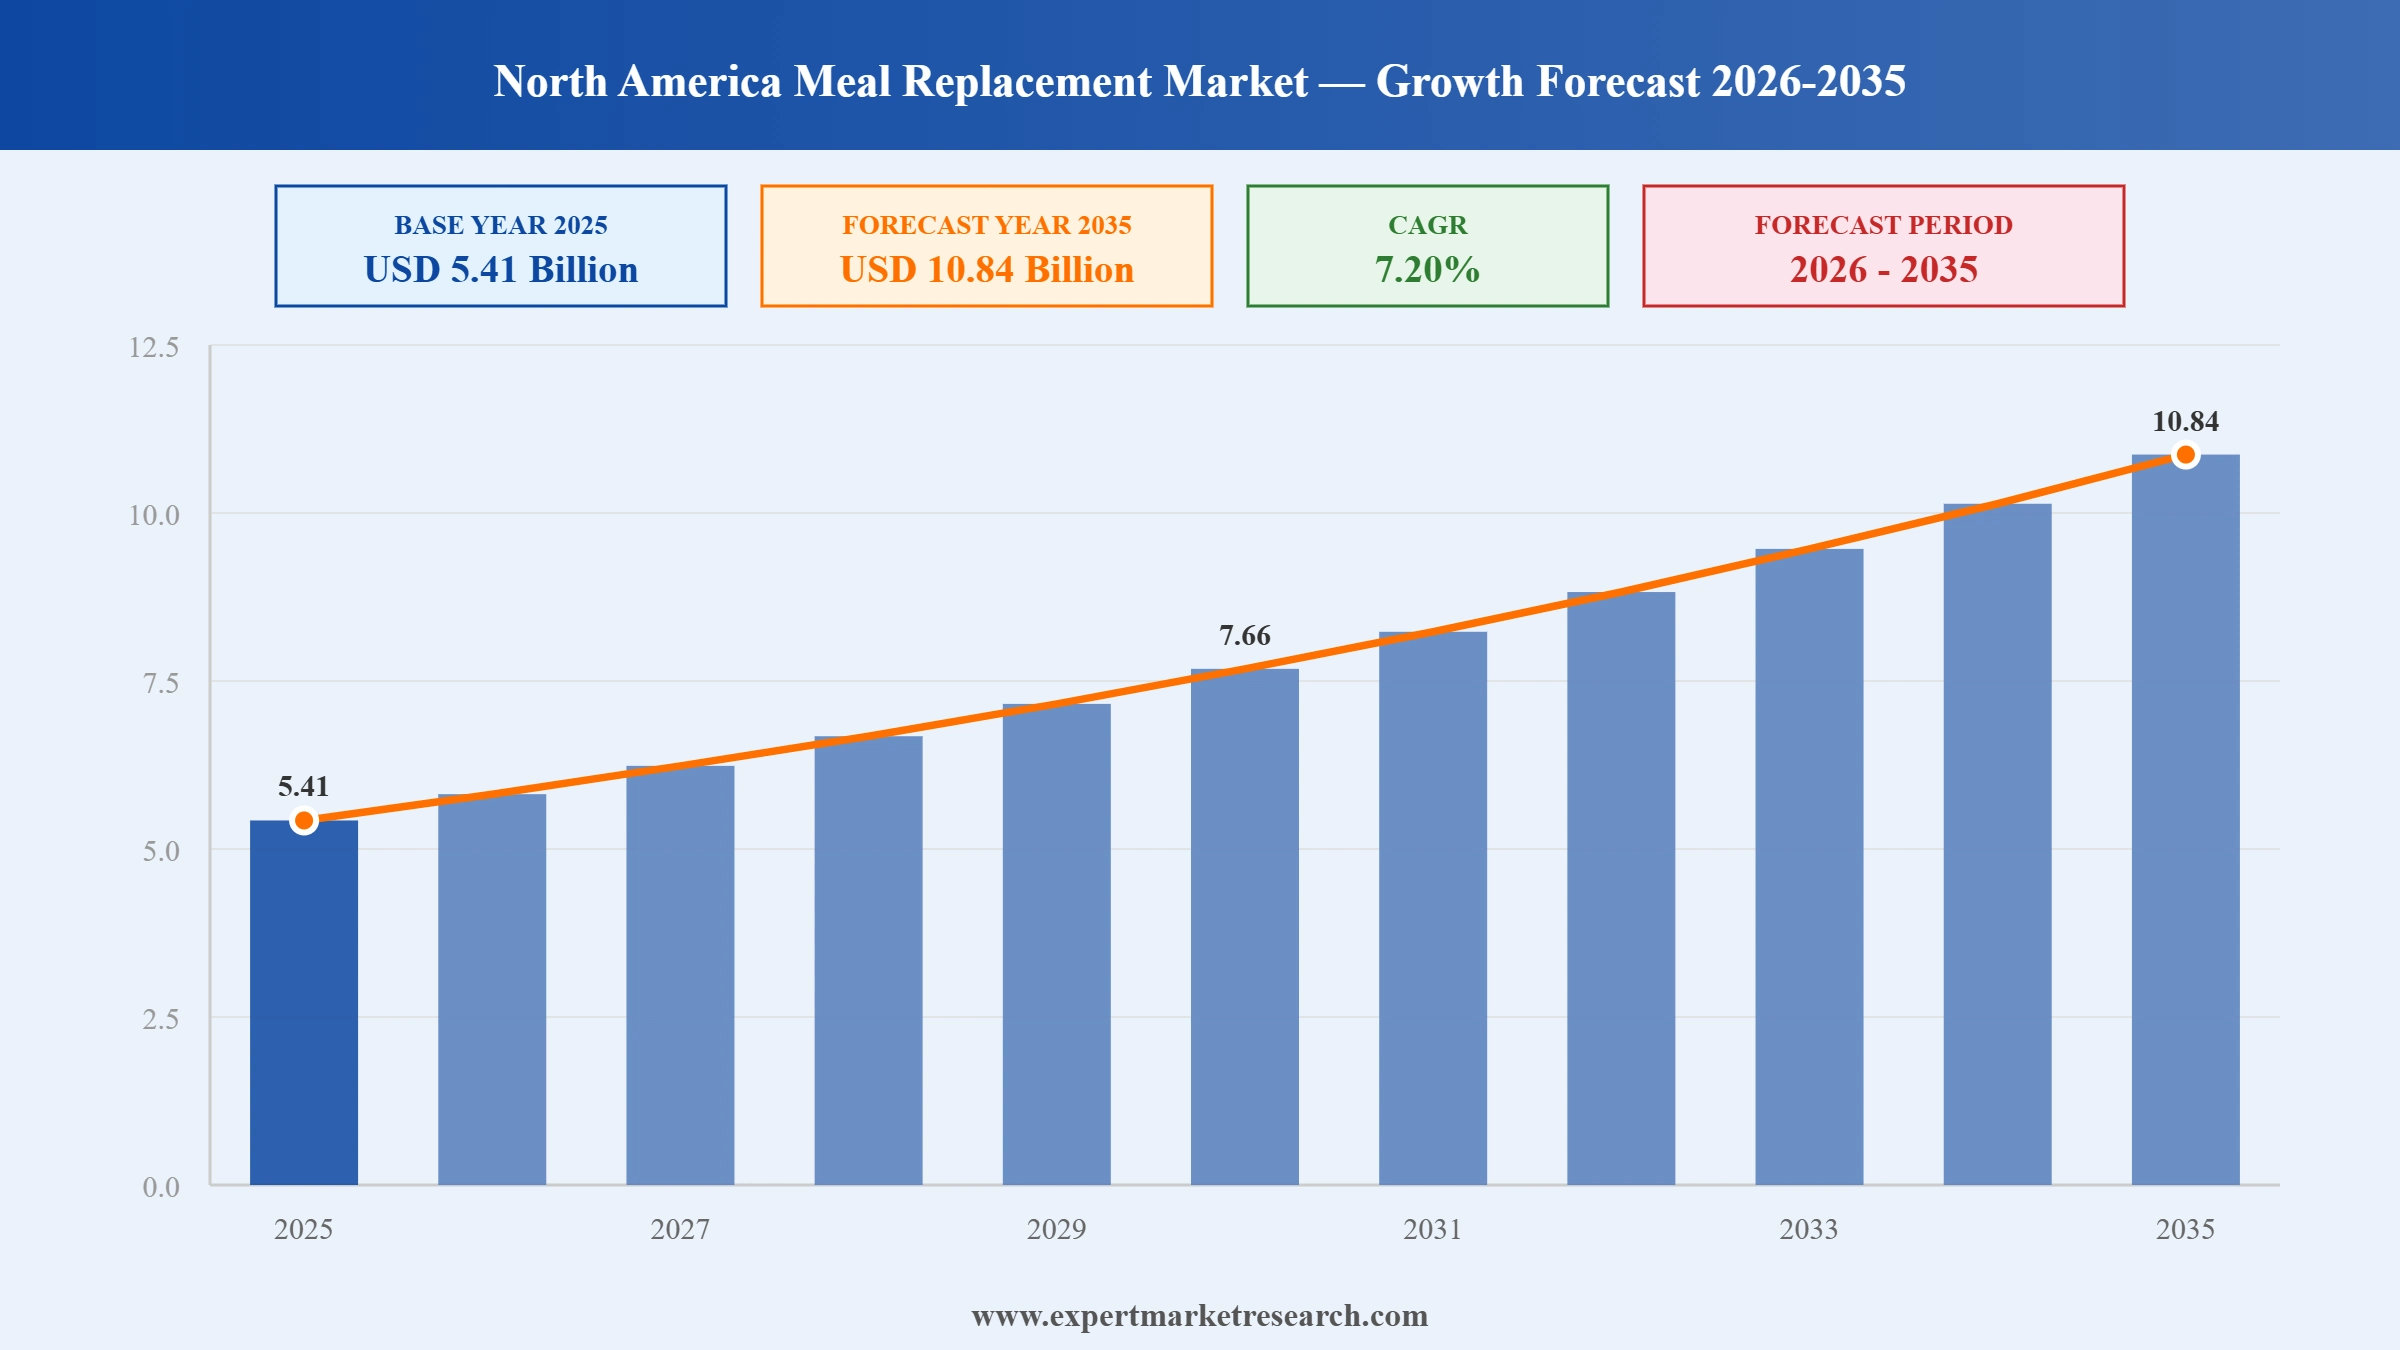
The North America meal replacement market was valued at USD 5.41 Billion in 2025. It is poised to grow at a CAGR of 7.20% during the forecast period of 2026-2035, and reach USD 10.84 Billion by 2035. The market growth is driven by the high demand for convenient nutrition, rising health awareness, and continuous product innovation across shakes and bars. The market is expected to expand through e-commerce growth, personalized nutrition, and fitness-focused consumption.
Read more about this report - REQUEST FREE SAMPLE COPY IN PDF
Meal replacement products are gaining strong traction among health-conscious consumers seeking convenient nutrition solutions amid busy lifestyles. These products are increasingly incorporated into fitness routines, weight management plans, and dietary regimens. The meal replacement market in North America is poised to grow at a CAGR of 7.20% during the forecast period of 2026-2035, due to rising demand for on-the-go nutrition, increasing health awareness, and growing adoption of protein-rich diets. The strong presence of functional food brands and expanding retail channels further support market growth.
Market Breakup by Product
The market is segmented by product into soup, shakes, and others, catering to diverse consumer preferences. These formats are widely used for meal convenience, nutritional supplements, and on-the-go consumption, supported by growing demand for balanced dietary options.
Market Breakup by Purpose
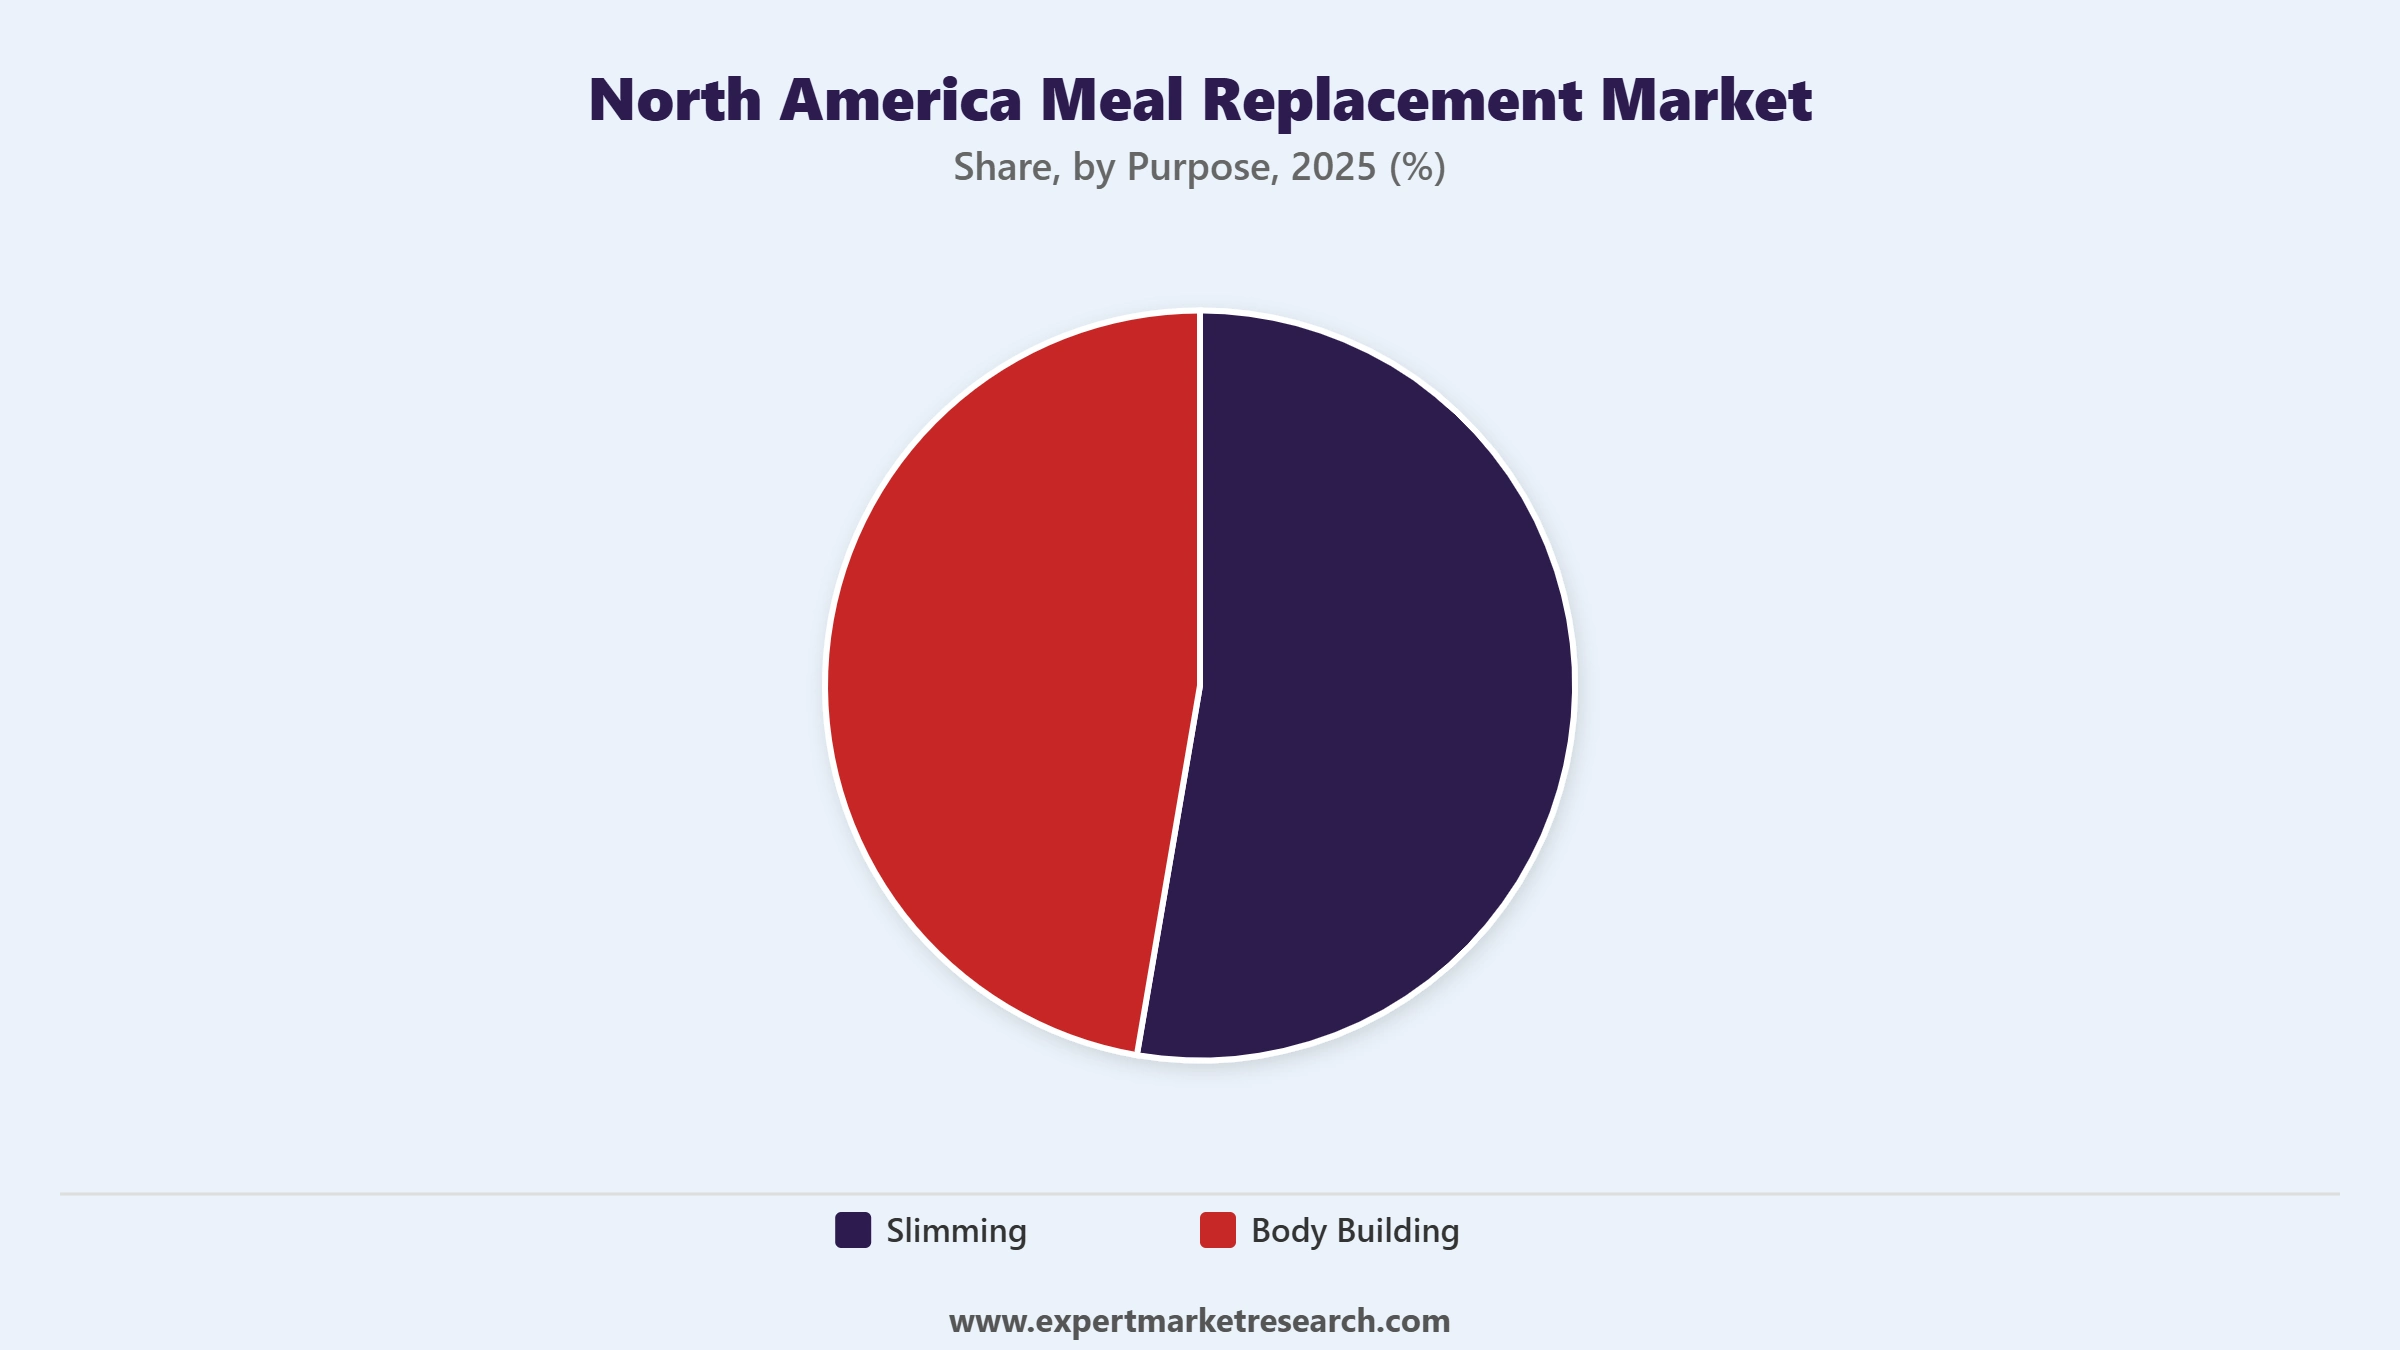
By purpose, the market is categorized into slimming and body building applications, reflecting different consumer goals. Slimming products are used for calorie control and weight management, while body building variants support protein intake and muscle maintenance among fitness-oriented individuals.
Market Breakup by Flavour
Based on flavor, the market includes vanilla, berry, chocolate, cookies and cream, and other variants. These flavors enhance palatability and consumer acceptance, with manufacturers focusing on taste innovation to improve repeat purchase behavior and expand appeal across age groups.
Market Breakup by Distribution Channel
Distribution channels comprise hypermarkets and supermarkets, convenience stores, specialty stores, online channels, and others. These channels collectively support product accessibility, with online and retail formats enabling consumers to compare options and purchase according to convenience and availability preferences.
Market Breakup by Region
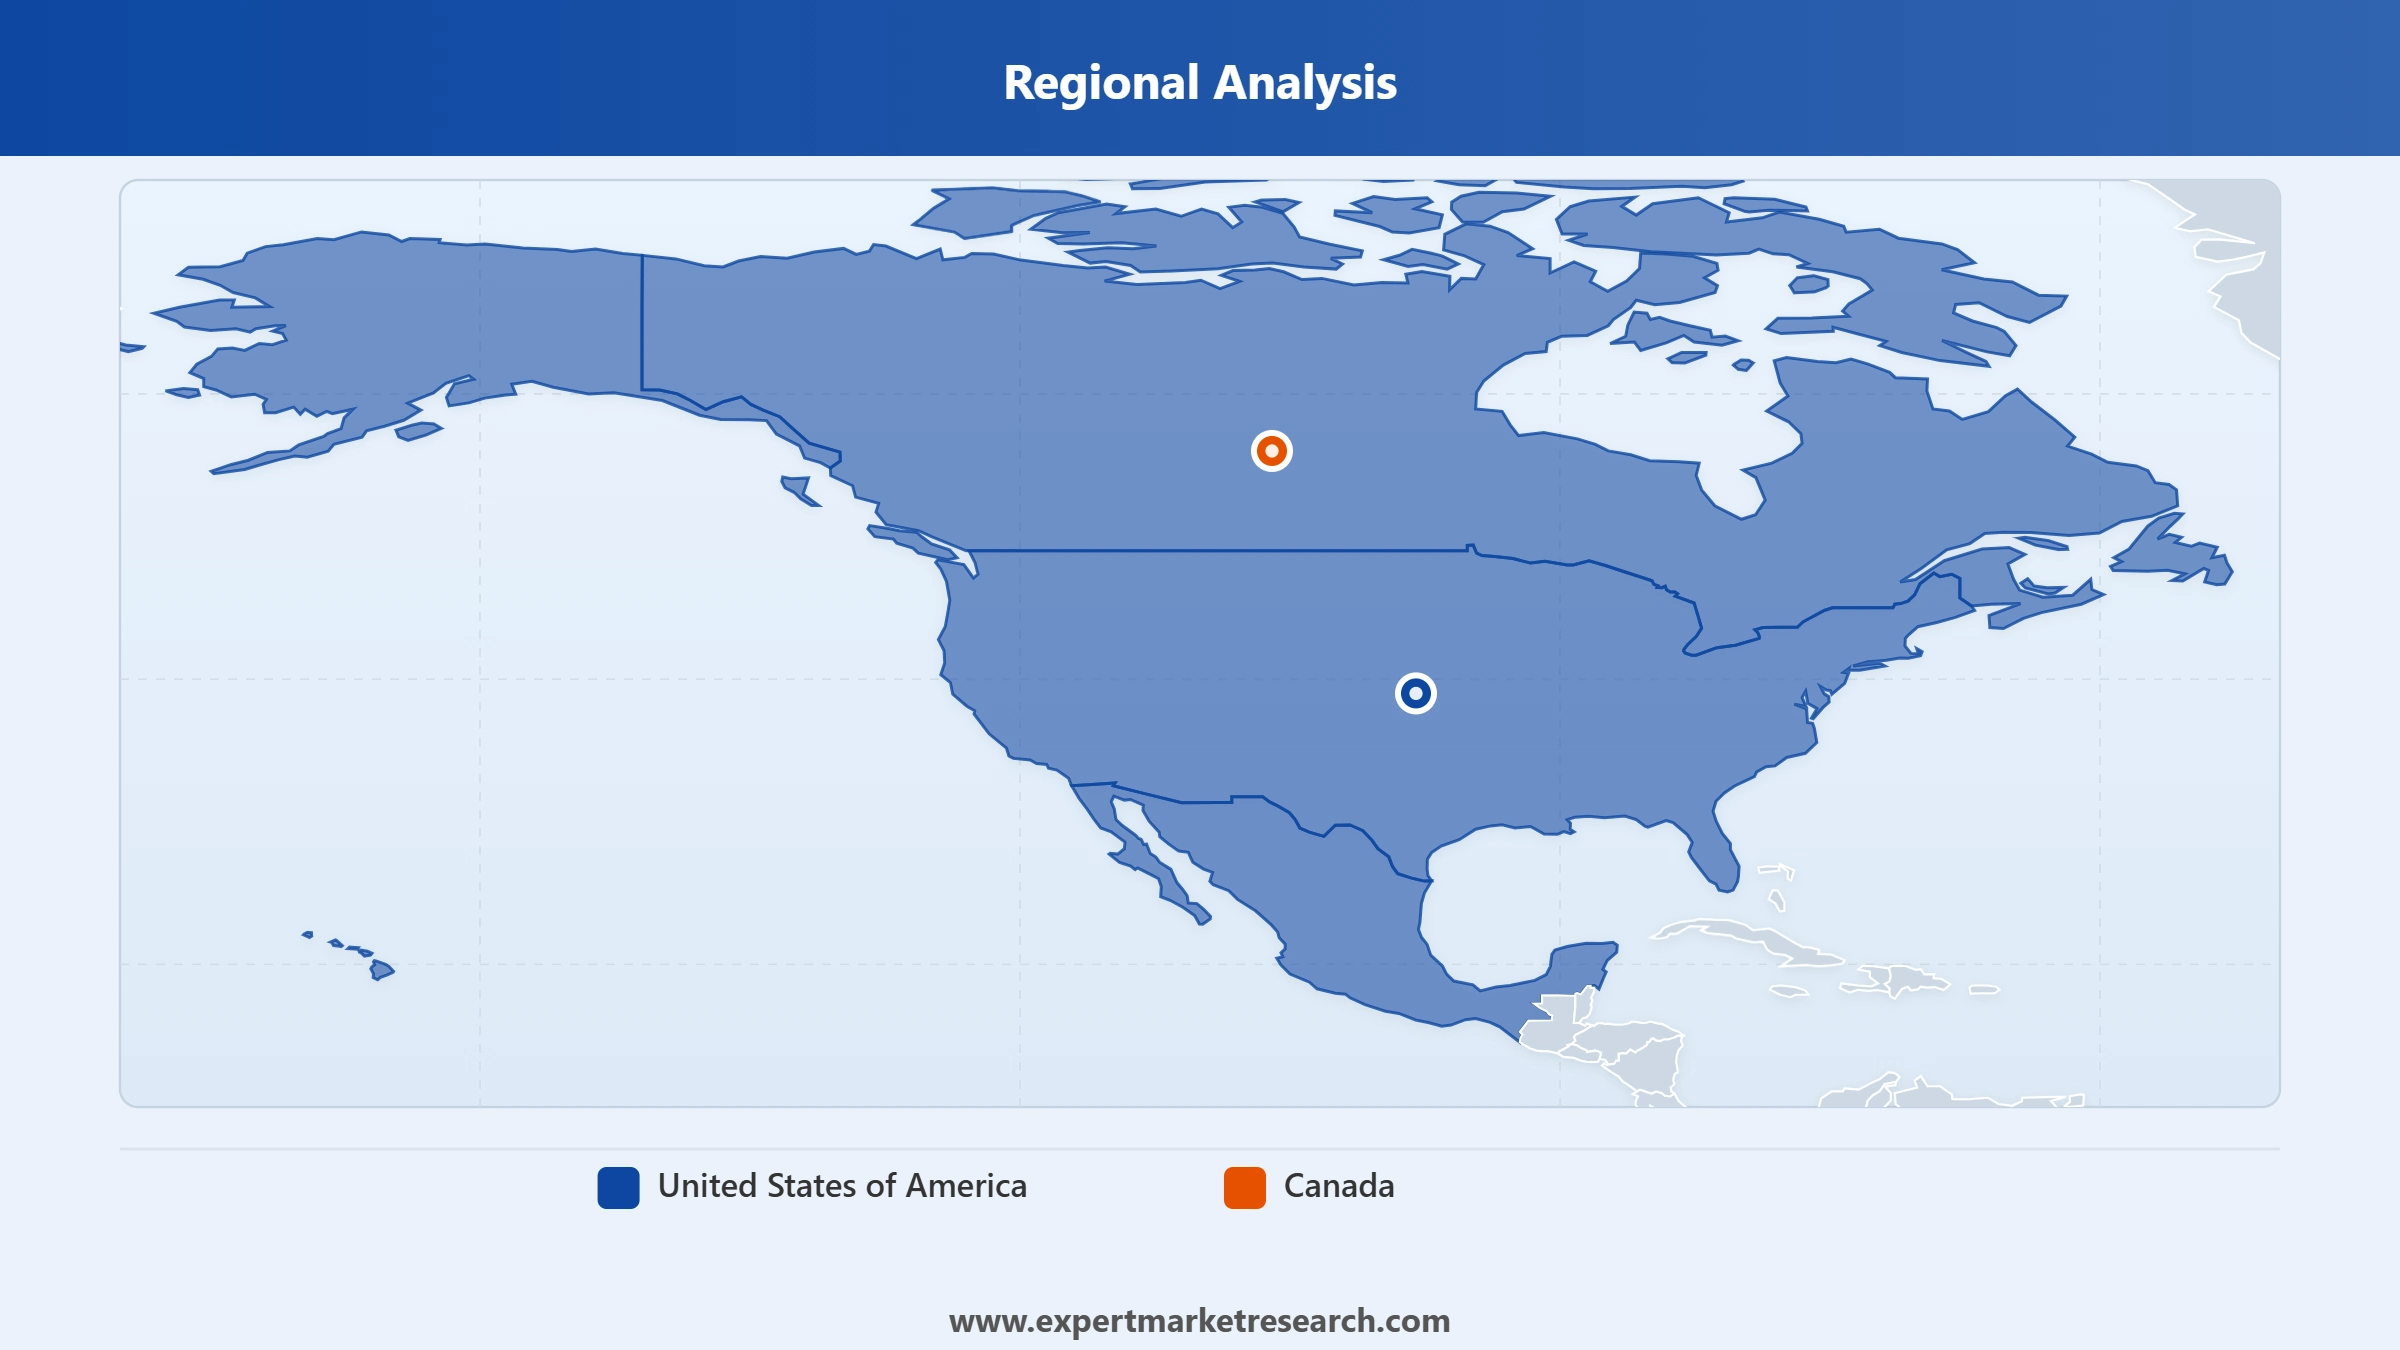
Regionally, the market is segmented into the United States and Canada, reflecting varying consumer lifestyles and dietary patterns. Both regions contribute to demand growth driven by increasing focus on nutrition, fitness awareness, and convenient meal solutions.


Read more about this report - REQUEST FREE SAMPLE COPY IN PDF
| Analysis Type | Factors | Example |
| Market Drivers | Rising health and convenience demand driving adoption of nutritionally balanced meal replacement products among busy health-conscious consumers. | In September 2024, Sperri expanded into United States via Amazon reflecting strong demand for plant-based meal replacement beverages. |
| Market Restraints | High reliance on processed formulations and artificial additives limiting adoption due to health concerns and consumer skepticism. | Diets high in ultra-processed foods increase obesity and metabolic disorder risks pushing consumers toward natural alternatives and limiting adoption. |
| Market Opportunities | Rising demand for plant-based clean-label and gut-friendly nutrition supporting innovation and expansion in the market. | In August 2024, Drink Wholesome launched vegan meal replacement powders made with almonds, oats, coconut, black walnuts. |
The following section outlines the key factors influencing market growth, including major drivers, restraints, and emerging opportunities.
Rising Health and Convenience Demand to Elevate the Market Value
The market is experiencing steady growth due to rising consumer preference for convenient, nutritionally balanced food options that support busy lifestyles and health management goals. Rising obesity rates and growing awareness of diet-related disorders are encouraging the adoption of meal replacement products as structured alternatives to traditional meals. For example, in September 2024, Nova Scotia-based health drink company Sperri announced its expansion into the United States market through Amazon, reflecting strong regional demand for plant-based meal replacement beverages. Such a move is supported by growing consumer interest in allergen-free and organic nutrition solutions, which is further accelerating product adoption across North America.
Concerns Over High Processing Levels and Artificial Ingredients to Limit Market Expansion
High reliance on processed formulations and artificial additives in meal replacement products is emerging as a key challenge in the market. The growing consumer skepticism regarding long-term health effects and nutritional adequacy is reducing adoption among health-conscious individuals. Diets high in ultra-processed foods are associated with increased risks of obesity and metabolic disorders, which is prompting consumers to shift toward natural whole-food alternatives and limiting sustained market penetration.
Growing Demand for Plant-Based and Clean-Label Nutrition Supporting Market Expansion
The increasing consumer shift toward plant-based, clean-label, and gut-friendly nutrition is expected to support the growth of the market in North America. This trend is driven by rising health awareness, digestive wellness concerns, and demand for convenient nutrition solutions. For example, in August 2024, Drink Wholesome launched vegan meal replacement powders made with almonds, oats, coconut, and black walnuts. This development highlights innovation in natural formulations, supporting broader market expansion.
Some of the notable trends in the market are personalized nutrition, GLP-1 support products, and functional meal replacement innovation.
GLP-1-Compatible Nutrition Solutions to Enhance the Meal Replacement Demand in North America
The market is witnessing increasing demand for products aligned with medical weight-loss therapies and metabolic syndrome related health management. This trend is driven by the rising use of GLP-1 based weight-loss medications that require nutritional supplementation to prevent deficiencies. For instance, February 2024, Herbalife Ltd. launched GLP-1 Nutrition Companion product combos in the United States and Puerto Rico to support individuals using weight-loss medications by delivering protein, fiber, and essential nutrients. This development reflects the growing integration of therapeutic nutrition with meal replacement solutions, enhancing product innovation and consumer adherence. The trend is likely to enhance market growth by strengthening demand for specialized, health-focused meal replacement offerings.
Slimming Segment to Lead the Market by Purpose
The market is segmented by purpose into slimming and bodybuilding. Slimming products focus on weight management and calorie control, while bodybuilding variants emphasize muscle recovery and protein enrichment. Among these, the slimming segment is expected to lead the market due to rising consumer preference for convenient weight management solutions and increasing adoption of controlled-calorie diets driven by busy urban lifestyles. The growing health consciousness and demand for nutritionally balanced meal alternatives further strengthen this segment’s position, supporting sustained market expansion across diverse consumer groups seeking practical dietary solutions.
Read more about this report - REQUEST FREE SAMPLE COPY IN PDF
The regions included in the report are the United States and Canada, with the United States expected to lead the market owing to higher consumer adoption and product innovation. For instance, in September 2024, Sperri, a Canada-based plant-based meal replacement brand, announced expansion into the United States market through an Amazon launch supported by new investment, highlighting rising cross-border demand and strengthening regional growth in functional nutrition products, which underscores increasing market penetration in North America.
Read more about this report - REQUEST FREE SAMPLE COPY IN PDF
The key features of the market report comprise patent analysis, funding and investment analysis, and strategic initiatives by the leading players. The major companies in the market are as follows:
Herbalife Nutrition Ltd. is a global nutrition company engaged in the meal replacement market through its Formula 1 Nutritional Shake Mix and related shakes, snacks, and supplements. The company provides weight management and balanced nutrition solutions designed to support healthy lifestyle goals. Its product portfolio strengthens its presence in the expanding meal replacement segment.
SlimFast & WorldPantry.com LLC participates in the meal replacement market through SlimFast shakes, meal replacement bars, and structured weight management programs. The company focuses on calorie-controlled nutrition solutions that support weight loss and healthy lifestyle maintenance. Its product range strengthens demand for convenient, on-the-go meal replacement options within the global nutrition industry.
Soylent Nutrition, Inc. operates in the meal replacement market with its ready-to-drink meal products formulated to provide complete nutrition. The company offers plant-based, science-backed beverages containing essential vitamins, minerals, amino acids, and healthy fats. Its products are designed to replace full meals, supporting convenience, balanced nutrition, and modern dietary lifestyles.
Abbott Nutrition, through its Ensure brand, is active in the meal replacement market with scientifically formulated nutritional shakes and supplements. Its products provide balanced nutrition for adults, including high-protein and diabetes care variants. The company focuses on clinical nutrition solutions that support strength, energy, and overall health management, expanding its presence in global nutrition segment.
Other key players in the market are Nestlé S.A. (Orgain, LLC), Vega US, LLC, PepsiCo, Inc. (CytoSport, Inc.), BellRing Brands, Inc., GNC Holdings, LLC, Kellanova.
*Please note that this is only a partial list; the complete list of key players is available in the full report. Additionally, the list of key players can be customized to better suit your needs.*
This report is developed through a robust mixed-methods research design combining:
Upto 15% Off
USD
$4299 $3869
$2699 $2429
$5799 $4949
$6999 $5949


*While we strive to always give you current and accurate information, the numbers depicted on the website are indicative and may differ from the actual numbers in the main report. At Expert Market Research, we aim to bring you the latest insights and trends in the market. Using our analyses and forecasts, stakeholders can understand the market dynamics, navigate challenges, and capitalize on opportunities to make data-driven strategic decisions.*
Explore our key highlights of the report and gain a concise overview of key findings, trends, and actionable insights that will empower your strategic decisions.
| REPORT FEATURES | DETAILS |
| Base Year | 2025 |
| Historical Period | 2019-2025 |
| Forecast Period | 2026-2035 |
| Scope of the Report |
Historical and Forecast Trends, Industry Drivers and Constraints, Historical and Forecast Market Analysis by Segment:
|
| Breakup by Product |
|
| Breakup by Purpose |
|
| Breakup by Flavour |
|
| Breakup by Distribution Channel |
|
| Breakup by Region |
|
| Market Dynamics |
|
| Competitive Landscape |
|
| Companies Covered |
|
Single User License
One User
USD 4,299
USD 3,869
tax inclusive*
Datasheet
One User
USD 2,699
USD 2,429
tax inclusive*
Five User License
Five User
USD 5,799
USD 4,949
tax inclusive*
Corporate License
Unlimited Users
USD 6,999
USD 5,949
tax inclusive*
*Please note that the prices mentioned below are starting prices for each bundle type. Kindly contact our team for further details.*
Flash Bundle
Small Business Bundle
Growth Bundle
Enterprise Bundle
*Please note that the prices mentioned below are starting prices for each bundle type. Kindly contact our team for further details.*
Flash Bundle
Number of Reports: 3
20%
tax inclusive*
Small Business Bundle
Number of Reports: 5
25%
tax inclusive*
Growth Bundle
Number of Reports: 8
30%
tax inclusive*
Enterprise Bundle
Number of Reports: 10
35%
tax inclusive*
How To Order

Select License Type
Choose the right license for your needs and access rights.

Click on ‘Buy Now’
Add the report to your cart with one click and proceed to register.

Select Mode of Payment
Choose a payment option for a secure checkout. You will be redirected accordingly.
Strategic Solutions for Informed Decision-Making
Gain insights to stay ahead and seize opportunities.

Get insights & trends for a competitive edge.

Track prices with detailed trend reports.

Analyse trade data for supply chain insights.

Leverage cost reports for smart savings

Enhance supply chain with partnerships.

Connect For More Information
Our expert team of analysts will offer full support and resolve any queries regarding the report, before and after the purchase.
Our expert team of analysts will offer full support and resolve any queries regarding the report, before and after the purchase.
We employ meticulous research methods, blending advanced analytics and expert insights to deliver accurate, actionable industry intelligence, staying ahead of competitors.
Our skilled analysts offer unparalleled competitive advantage with detailed insights on current and emerging markets, ensuring your strategic edge.
We offer an in-depth yet simplified presentation of industry insights and analysis to meet your specific requirements effectively.


