

Consumer Insights
Uncover trends and behaviors shaping consumer choices today
Procurement Insights
Optimize your sourcing strategy with key market data
Industry Stats
Stay ahead with the latest trends and market analysis.

The North America printed signage market size reached USD 11.62 Billion in 2025. The market is expected to grow at a CAGR of 1.65% between 2026 and 2035, reaching almost USD 13.69 Billion by 2035.
Base Year
Historical Period
Forecast Period
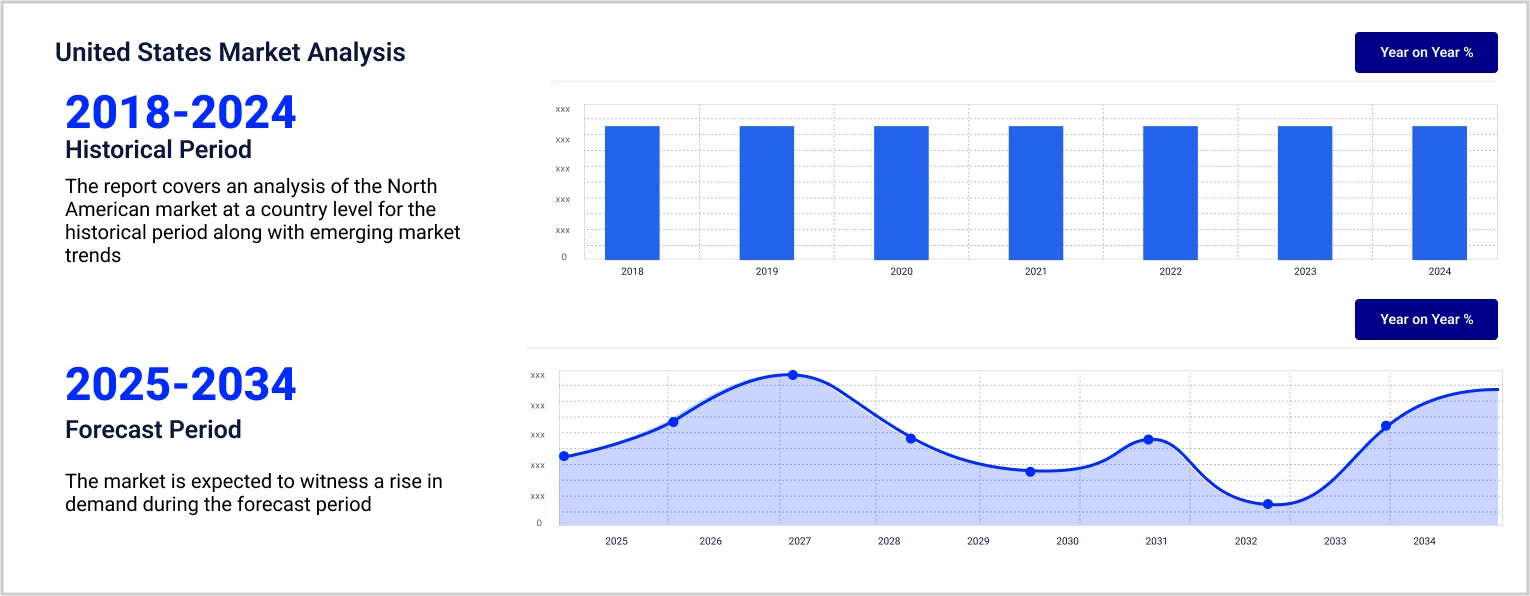
According to the National Health Expenditure Account (NHEA), healthcare spending in the U.S. rose 4.1% in 2022, reaching $4.5 trillion.
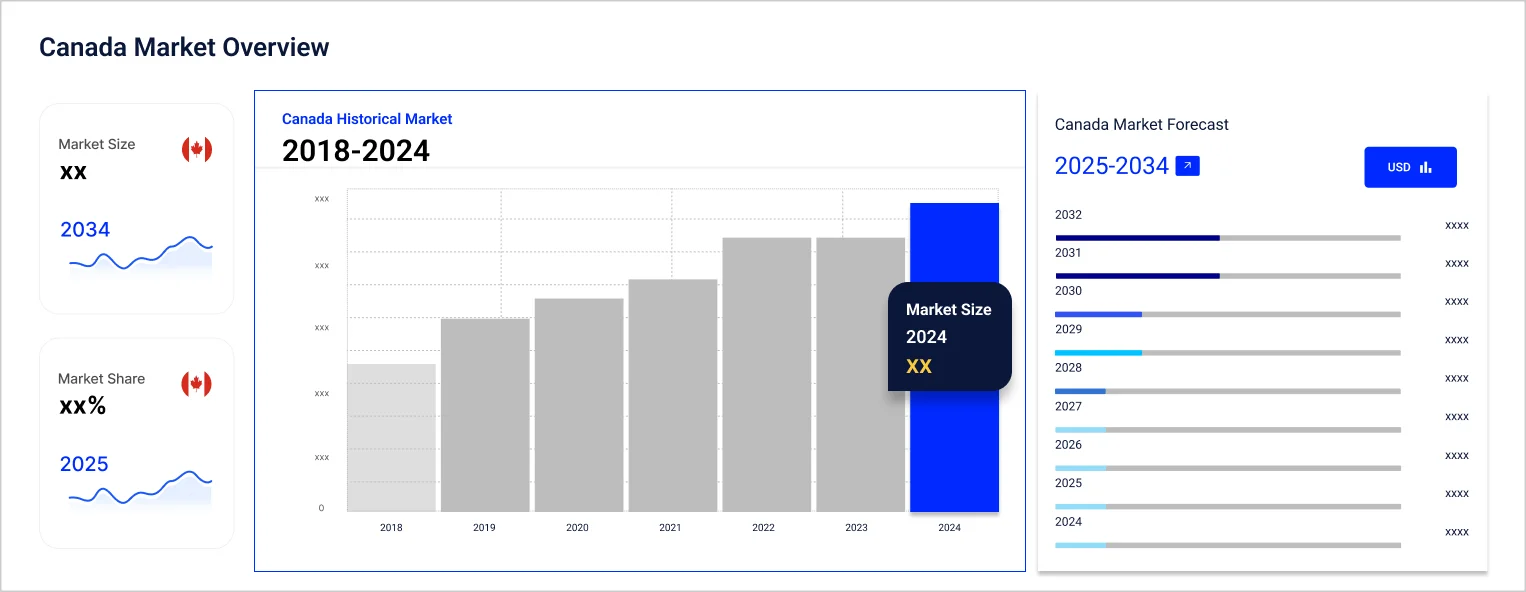
Statistics Canada reported a 0.3% rise in Canada's registered road motor vehicles in 2022, totalling 26.3 million, bolstering the transportation sector.
According to the Transportation Satellite Accounts (TSAs) from the Bureau of Transportation Statistics (BTS), the transportation sector added $1.3 trillion (5.6%) to the U.S. economy in 2021.
Compound Annual Growth Rate
1.65%
Value in USD Billion
2026-2035
*this image is indicative*
Based on the end use, healthcare boosts the North America printed signage market growth for educational purposes such as advocating for healthy behaviours, describing medical procedures, or presenting new services
In healthcare facilities, printed signage is crucial in guiding, delivering health messages, reminding of appointments, educating on procedures/services, ensuring compliance, projecting professionalism, promoting services, and building brand recognition, ultimately improving patient trust and experience.
Printed signage in entertainment and advertising ensures high exposure, economic benefits, focused marketing, brand strengthening, adaptability, urging action, and versatile positioning, enhancing audience involvement and brand acknowledgement.
As stated by the National Health Expenditure Account (NHEA), healthcare expenditure in the United States increased by 4.1 per cent in 2022, totalling USD 4.5 trillion, equivalent to USD 13,493 per individual. This constituted 17.3 per cent of the country's Gross Domestic Product.
The United States leads in the North America printed signage market share, driven by transportation and logistics, as transportation companies use signage on vehicles, terminals, and cargo to promote logos, slogans, and brands, thus enhancing recognition.
The Bureau of Transportation Statistics (BTS) Transportation Satellite Accounts (TSAs) indicated that transportation contributed $1.3 trillion (5.6%) to the U.S. economy in 2021.
According to Statistics Canada, the total count of registered road motor vehicles in Canada reached 26.3 million in 2022, marking a slight 0.3% increase from the previous year.
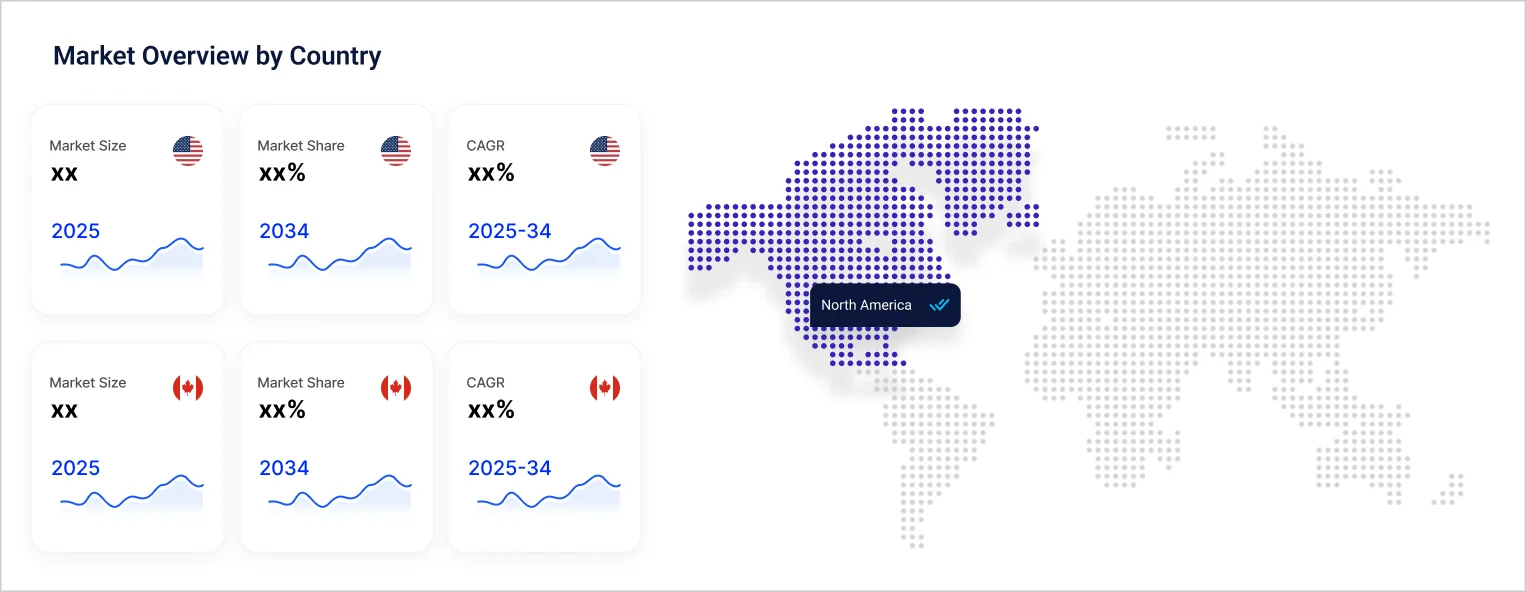
North America Printed Signage Market Report and Forecast 2026-2035 offers a detailed analysis of the market based on the following segments:
Market Breakup by Type
Market Breakup by Application
Market Breakup by End Use
Market Breakup by Country
The industry participants offer solutions for labelling and packaging materials, manufacturing pressure-sensitive materials, tags, labels, tickets, and other converted items.
The North America printed signage market key players are


Upto 15% Off
USD
$3999 $3599
$2499 $2249
$4999 $4249
$5999 $5099


*While we strive to always give you current and accurate information, the numbers depicted on the website are indicative and may differ from the actual numbers in the main report. At Expert Market Research, we aim to bring you the latest insights and trends in the market. Using our analyses and forecasts, stakeholders can understand the market dynamics, navigate challenges, and capitalize on opportunities to make data-driven strategic decisions.*
Get in touch with us for a customized solution tailored to your unique requirements and save upto 35%!
The market was valued at USD 11.62 Billion in 2025.
The market is projected to grow at a CAGR of 1.65% between 2026 and 2035.
The revenue generated from the market is expected to reach USD 13.69 Billion in 2035.
The printed signage market is categorised according to its applications, which include indoor and outdoor.
The key players in the market are Avery Dennison Corporation, Chandler Signs, LLC, Sign Solutions USA, James Printing & Signs, Design Communications Ltd., Signs Express, XpressMyself.com LLC (SmartSign), OUTFRONT Media Inc., Southwest Signs and Graphics, and Thryv, Inc. among others.
Based on the type, the market is divided into banners, backlit displays, pop displays, billboards, and others.
Based on the end use, the printed signage market is divided into entertainment and advertisement, transportation and logistics, healthcare, BFSI, retail and others.
The market is broken down into the United States of America and Canada.
Explore our key highlights of the report and gain a concise overview of key findings, trends, and actionable insights that will empower your strategic decisions.
| REPORT FEATURES | DETAILS |
| Base Year | 2025 |
| Historical Period | 2019-2025 |
| Forecast Period | 2026-2035 |
| Scope of the Report |
Historical and Forecast Trends, Industry Drivers and Constraints, Historical and Forecast Market Analysis by Segment:
|
| Breakup by Type |
|
| Breakup by Application |
|
| Breakup by End Use |
|
| Breakup by Region |
|
| Market Dynamics |
|
| Competitive Landscape |
|
| Companies Covered |
|
Single User License
One User
USD 3,999
USD 3,599
tax inclusive*
Datasheet
One User
USD 2,499
USD 2,249
tax inclusive*
Five User License
Five User
USD 4,999
USD 4,249
tax inclusive*
Corporate License
Unlimited Users
USD 5,999
USD 5,099
tax inclusive*
*Please note that the prices mentioned below are starting prices for each bundle type. Kindly contact our team for further details.*
Flash Bundle
Small Business Bundle
Growth Bundle
Enterprise Bundle
*Please note that the prices mentioned below are starting prices for each bundle type. Kindly contact our team for further details.*
Flash Bundle
Number of Reports: 3
20%
tax inclusive*
Small Business Bundle
Number of Reports: 5
25%
tax inclusive*
Growth Bundle
Number of Reports: 8
30%
tax inclusive*
Enterprise Bundle
Number of Reports: 10
35%
tax inclusive*
How To Order

Select License Type
Choose the right license for your needs and access rights.

Click on ‘Buy Now’
Add the report to your cart with one click and proceed to register.

Select Mode of Payment
Choose a payment option for a secure checkout. You will be redirected accordingly.
Gain insights to stay ahead and seize opportunities.

Get insights & trends for a competitive edge.

Track prices with detailed trend reports.

Analyse trade data for supply chain insights.

Leverage cost reports for smart savings

Enhance supply chain with partnerships.

Connect For More Information
Our expert team of analysts will offer full support and resolve any queries regarding the report, before and after the purchase.
Our expert team of analysts will offer full support and resolve any queries regarding the report, before and after the purchase.
We employ meticulous research methods, blending advanced analytics and expert insights to deliver accurate, actionable industry intelligence, staying ahead of competitors.
Our skilled analysts offer unparalleled competitive advantage with detailed insights on current and emerging markets, ensuring your strategic edge.
We offer an in-depth yet simplified presentation of industry insights and analysis to meet your specific requirements effectively.


Share