

Consumer Insights
Uncover trends and behaviors shaping consumer choices today
Procurement Insights
Optimize your sourcing strategy with key market data
Industry Stats
Stay ahead with the latest trends and market analysis.

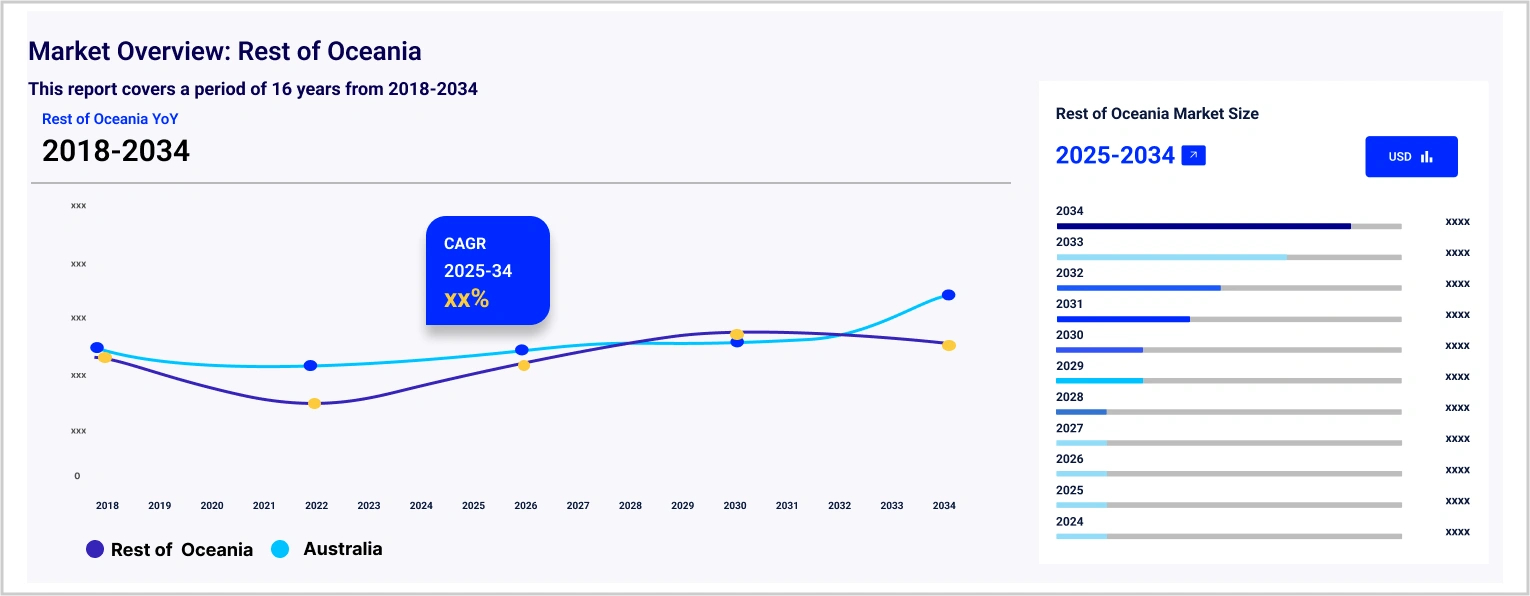
The Oceania electric motor market size reached approximately USD 1365.67 Million in 2025. The market is projected to grow at a CAGR of 4.90% between 2026 and 2035, reaching a value of around USD 2203.44 Million by 2035.
Base Year
Historical Period
Forecast Period
When maintained properly, the capacity of electric motors reaches 30,000 hours and is designed to run at 50% to 100% of rated load.
HVAC systems account for around 50% of a commercial building’s energy use in Australia. As a result, demand for energy motors will rise to ensure energy savings.
The Australian government aims to reduce the country’s GHG emissions by 43% by 2030 and reach net zero by 2050. Consequently, this will propel the demand for electric vehicles (EVs) and renewable energy.
Compound Annual Growth Rate
4.9%
Value in USD Million
2026-2035
*this image is indicative*
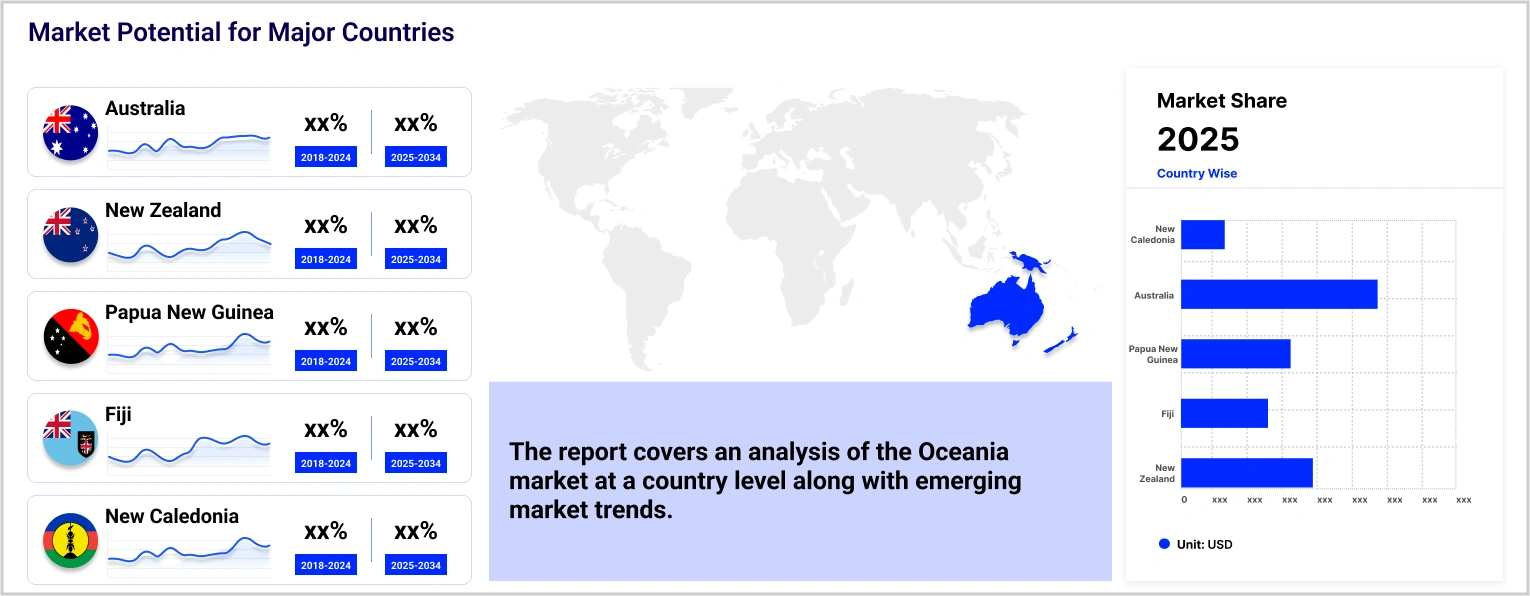
Countries in Oceania that include Australia, New Zealand, Papua New Guinea, Fiji, and others are witnessing strong growth in their industrial and manufacturing sector. The Australian government has laid out investment funds to support advanced manufacturing enabling manufacturers to expand their operations, and industrial processes, and use research and development to attain growth in technology. The growing industrial sector further contributes to a greater need for electric motors to power fans, blowers, machine tools, turbines, pumps, power tools, compressors, etc.
Key factors driving the electric motor market in Oceania include rising technological advancements concerning electric motors, rising adoption of electric vehicles, and adoption of consumer appliances that function on electric motors.
Rising demand for renewable energy systems, demand for equipment like fans and blowers, and a shift towards electric vehicles aid the Oceania electric motor market development.
| Date | Company | Event |
| November 2022 | ABB Ltd. | ABB joined forces with Rotating Machinery Supplies Ltd (RMS), a leading player in motors and drives across diverse industries in New Zealand. |
| October 2021 | Regal Rexnord Corporation | Regal Beloit Corporation, a renowned global leader in electric motors, controls, power generation products, and power transmission components, concluded its merger with Rexnord Process and Motion Control (PMC), officially forming Regal Rexnord Corporation. |
| Trends | Impact |
| Demand for AC motors owing to their efficiency | Alternative current, or AC motors are widely employed in commercial and industrial settings as they significantly reduce power line disturbances, lower power demand on start, offer controlled acceleration, controlled starting current, adjustable operation speed, and adjustable torque. |
| An expanding electric vehicle demand | Oceania is witnessing a rapid adoption of electric vehicles fueled by rising environmental awareness, soaring petrol prices, and government-backed subsidies. This is further catering to an increased demand for electric motors. |
| Australia has the availability of raw materials for electric motor manufacturing | Australia’s renewable energy potential, mineral resources, prevailing engineering infrastructure, and highly skilled workforce make it an optimal market to manufacture electric vehicles, supporting the Oceania electric motor market. |
Electric Vehicle (EV) Policy Development to Support EV Adoption in Oceania
During 2021 and 2022, countries in Oceania enacted policies to support EV uptake and fuel efficiency standards.
This shift towards renewable and clean energy is supporting Oceania electric motor market growth. The expansion of the electric vehicle market is a significant driver for the market. Electric vehicles heavily rely on electric motors for their propulsion. The region's abundant potential for renewable energy generation, including hydro, wind, and solar power, offers an opportunity for deploying electric motors to harness clean energy sources effectively. Electric motors are instrumental in seamlessly integrating renewable energy into power systems.
Oceania Electric Motor Market Report and Forecast 2026-2035 offers a detailed analysis of the market based on the following segments:
Market Breakup by Type
Market Breakup by Power Output
Market Breakup by Application
Market Breakup by Region
AC motors are further divided into synchronous AC motors and induction AC motors while DC motors are sub-divided into brushed DC motors and brushless DC motors.
Meanwhile residential and commercial applications are bifurcated into HVAC, home appliances, and others. E-mobility is sub-divided into 2 and 3 wheelers, light vehicle, commercial and heavy vehicle, and others.
By power output, fractional HP motors are expected to hold a significant Oceania electric motor market share to meet the power needs of small household appliances
According to the Oceania electric motor report, fractional HP motors are smaller and more compact, making them ideal for space-constrained applications and small appliances. These motors are also more affordable compared to larger motors.
Integral HP motors typically have higher power ratings, making them suitable for heavy-duty applications and larger machinery, including large pumps, compressors, and manufacturing equipment. These motors often have better efficiency at higher power levels, leading to lower energy consumption and reduced operating costs.
Industrial segment is a prominent application of electric motors in the electric motor market in Oceania
According to the Oceania electric motor market analysis, there is a rising demand for industrial electric motors energised by alternating current (AC) for power grids and generators. Electric motors are widely used in industrial applications like high-voltage AC heating, cooling, and ventilating equipment.
In the residential and commercial sector, electric motors are an integral part of HVAC systems and perform functions including operating fans, pumps, compressors, and moving hot and cold air. Since HVAC systems account for around 50% of a commercial building’s energy use in Australia, the country is likely to invest in electric motors that offer significant advantages such as energy efficiency, reliability, performance, and sustainability.
Electric vehicles such as light vehicles, 2 and 3-wheelers, and heavy vehicles incorporated with electric motors are gaining popularity due to the lower operating, maintenance, and fuel costs. Moreover, electric vehicles offer a quieter and smoother ride, improving the driving experience for drivers and passengers. According to the Federal Chamber of Automotive Industries (FCAI), a record 1.21 million new cars were sold in Australia in 2023. Battery EVs accounted for 7.2% of the total, a rise from 3.2% in 2022, while hybrid vehicles accounted for 8.1% from 7.9% the previous year.
In Oceania, the electric motor market is characterised by intense competition, with a significant presence of both global and local players vying for market share.
| Company Name | Year Founded | Headquarters | Products/Services |
| TECO Electric & Machinery Co., Ltd. | 1956 | Taipei, Taiwan | NEMA motors, IE4 efficiency explosion-proof motors, cutting-edge IE5 motors (GB1 motors), etc. |
| WEG S.A. | 1961 | Jaraguá do Sul, Brazil | Electric motors: Single-Phase, Three-Phase Low Voltage, Three-Phase High Voltage, Synchronous Motors, and Wound Rotor Induction Motors. Others: Gearboxes, automation technologies, and power generation equipment. |
| Regal Rexnord Corporation | 1955 | Wisconsin, United States | Electric motors: AC motors - NEMA, AC motors - IEC, DC motors, gear motors, HVAC/R motors, and motor accessories. |
| ABB Ltd. | 1988 | Zurich, Switzerland | Electric motors high-voltage induction motors, IEC low-voltage motors, motors and generators designed for use in explosive atmospheres, etc. |
Other key players in the Oceania electric motor market include Emerson Electric Co., Nidec Corporation, General Electric Company, and Toshiba International Corporation, among others.
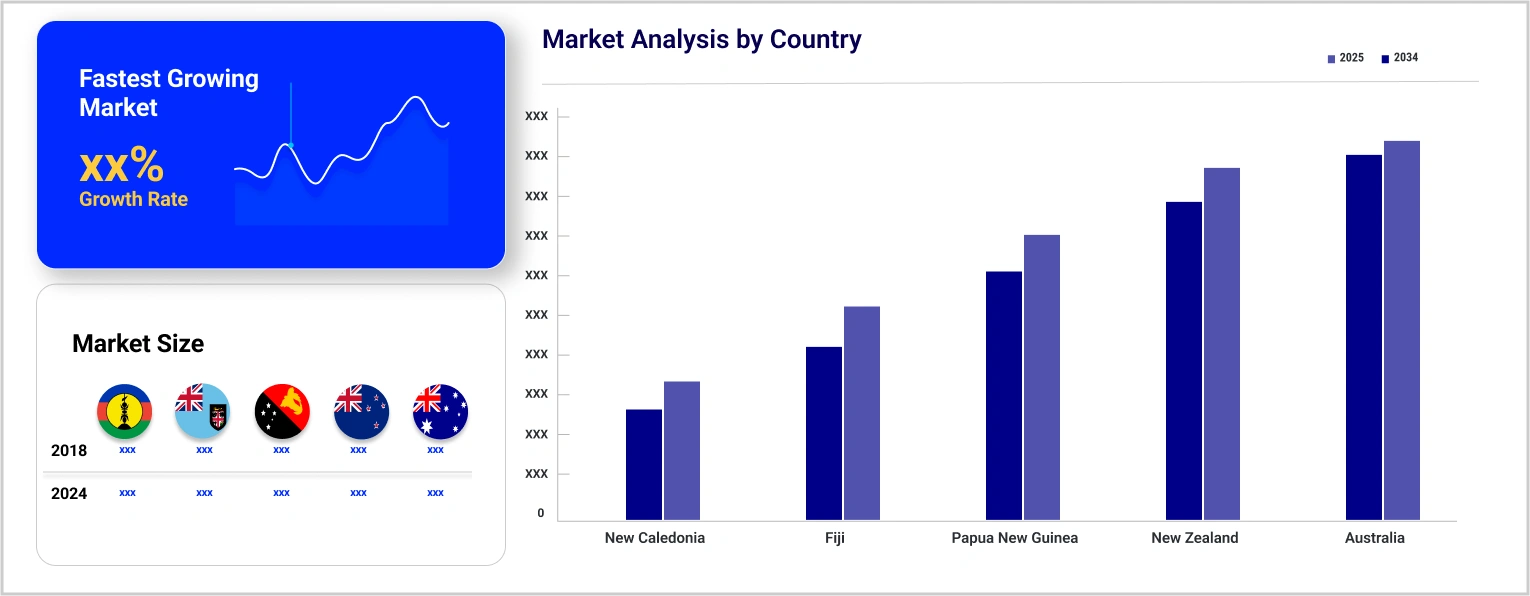
Australia holds a significant market Oceania electric motor market share owing to rising demand for household and industrial appliances
A growing manufacturing sector in Australia is catering to an increased demand for electric motors for compressors, fans and blowers, and heavy-duty equipment. Prominent fan manufacturers in the country include Aerotech Fans Pty Ltd, AirEng Pty Ltd, and Aerovent Australia Pty Ltd.
In New Zealand, the prevalence of standards such as Minimum Energy Performance Standards (MEPS) for three-phase cage induction electric motors (motors, or electric motors) is ensuring the quality of electric motors sold in the country.
Papua New Guinea is witnessing an increased deployment of electric vehicles due to the target set out by the Nationally Determined Contribution (NDC) of the country to increase the share of renewable energy as the source of electricity. The adoption of electric vehicles will create a drop in oil consumption and reduce emissions by up to 22% by 2035. With the growing adoption of electric vehicles, the demand for electric motors is anticipated to rise.
The Fiji Low Emission Development Strategy aims to achieve net zero carbon emissions by 2050. It is aimed at enabling Fiji to transform its energy sector with a wide array of on-grid and off-grid renewable energy generation. The adoption of clean energy for domestic, commercial, and industrial use as well as the conversion of Fiji's land transportation networks to electric cars, is anticipated to aid the Oceania electric motor market growth.


Upto 15% Off
USD
$2499 $2249
$3999 $3599
$4999 $4249
$5999 $5099


*While we strive to always give you current and accurate information, the numbers depicted on the website are indicative and may differ from the actual numbers in the main report. At Expert Market Research, we aim to bring you the latest insights and trends in the market. Using our analyses and forecasts, stakeholders can understand the market dynamics, navigate challenges, and capitalize on opportunities to make data-driven strategic decisions.*
Get in touch with us for a customized solution tailored to your unique requirements and save upto 35%!
In 2025, the Oceania electric motor market reached an approximate value of USD 1365.67 Million.
The market is expected to grow at a CAGR of 4.90% between 2026 and 2035.
The market is estimated to witness healthy growth in the forecast period of 2026-2035 to reach a value of around USD 2203.44 Million by 2035.
Electric motors operate by the interaction between electric current in a wire winding and the motor's magnetic field to generate a torque that is applied on the motor's shaft.
An electric motor is a device designed to convert electrical energy into mechanical energy.
The major drivers of the market include governmental policies to boost EV use, rising investment in home appliances, and the use of HVAC systems.
Key trends aiding market expansion include the technological advancement of electric motors, the adoption of electric vehicles, and the transition toward renewable energy.
The major applications of the product include residential and commercial, mobility, and industrial, among others.
The major countries include Australia, New Zealand, Papua New Guinea, and Fiji, among others.
The prominent players in the market are TECO Electric & Machinery Co., Ltd., WEG S.A., Regal Rexnord Corporation, ABB Ltd., Emerson Electric Co., Nidec Corporation, General Electric Company, and Toshiba International Corporation, among others.
Explore our key highlights of the report and gain a concise overview of key findings, trends, and actionable insights that will empower your strategic decisions.
| REPORT FEATURES | DETAILS |
| Base Year | 2025 |
| Historical Period | 2019-2025 |
| Forecast Period | 2026-2035 |
| Scope of the Report |
Historical and Forecast Trends, Industry Drivers and Constraints, Historical and Forecast Market Analysis by Segment:
|
| Breakup by Type |
|
| Breakup by Power Output |
|
| Breakup by Application |
|
| Breakup by Region |
|
| Market Dynamics |
|
| Competitive Landscape |
|
| Companies Covered |
|
Datasheet
One User
USD 2,499
USD 2,249
tax inclusive*
Single User License
One User
USD 3,999
USD 3,599
tax inclusive*
Five User License
Five User
USD 4,999
USD 4,249
tax inclusive*
Corporate License
Unlimited Users
USD 5,999
USD 5,099
tax inclusive*
*Please note that the prices mentioned below are starting prices for each bundle type. Kindly contact our team for further details.*
Flash Bundle
Small Business Bundle
Growth Bundle
Enterprise Bundle
*Please note that the prices mentioned below are starting prices for each bundle type. Kindly contact our team for further details.*
Flash Bundle
Number of Reports: 3
20%
tax inclusive*
Small Business Bundle
Number of Reports: 5
25%
tax inclusive*
Growth Bundle
Number of Reports: 8
30%
tax inclusive*
Enterprise Bundle
Number of Reports: 10
35%
tax inclusive*
How To Order

Select License Type
Choose the right license for your needs and access rights.

Click on ‘Buy Now’
Add the report to your cart with one click and proceed to register.

Select Mode of Payment
Choose a payment option for a secure checkout. You will be redirected accordingly.
Gain insights to stay ahead and seize opportunities.

Get insights & trends for a competitive edge.

Track prices with detailed trend reports.

Analyse trade data for supply chain insights.

Leverage cost reports for smart savings

Enhance supply chain with partnerships.

Connect For More Information
Our expert team of analysts will offer full support and resolve any queries regarding the report, before and after the purchase.
Our expert team of analysts will offer full support and resolve any queries regarding the report, before and after the purchase.
We employ meticulous research methods, blending advanced analytics and expert insights to deliver accurate, actionable industry intelligence, staying ahead of competitors.
Our skilled analysts offer unparalleled competitive advantage with detailed insights on current and emerging markets, ensuring your strategic edge.
We offer an in-depth yet simplified presentation of industry insights and analysis to meet your specific requirements effectively.


Share