

Consumer Insights
Uncover trends and behaviors shaping consumer choices today
Procurement Insights
Optimize your sourcing strategy with key market data
Industry Stats
Stay ahead with the latest trends and market analysis.
The global oil and gas EPC market size USD 56.83 Billion in 2025. The market is expected to grow at a CAGR of 4.30% during the forecast period of 2026-2035 to reach a value of USD 86.58 Billion by 2035. Growing LNG infrastructure expansion across the Asia Pacific region continues to create EPC demand, supported by rising imports in India, South Korea, and China, reflecting a structural push toward natural gas as a transitional fuel source.
Digitization has become an undeniable factor in EPC execution. According to the oil and gas EPC market analysis, digital technologies could reduce upstream project costs by 15–20% by 2050, providing companies a crucial edge in winning bids. In addition, India’s Ministry of Petroleum & Natural Gas confirmed nearly USD 18 billion worth of refinery and pipeline projects under execution, many tied to EPC service providers in June 2024. This confluence of government-backed funding, digital tools, and heavy capital projects positions EPC contractors as central to oil and gas resilience during volatile demand cycles.
Moreover, the market is undergoing a transformative phase, largely driven by the surging investments in energy transition projects. A notable push comes from the Middle East, where Saudi Aramco offered nearly USD 40 billion annually on upstream developments back in August 2014, creating a significant pipeline of EPC contracts. Simultaneously, governments are accelerating regulatory frameworks; the United States Department of Energy has already allocated USD 6 billion under its Carbon Management Program in March 2024 to support low-carbon EPC projects, signaling how policy is directly boosting the oil and gas EPC market opportunities.
Compound Annual Growth Rate
4.3%
Value in USD Billion
2026-2035
Read more about this report - REQUEST FREE SAMPLE COPY IN PDF
In South Sumatra, Medco Energi, an Indonesian company, began its most recent gas field development project on its lucrative Corridor production sharing contract. Medco Energi’s Corridor gas field development in South Sumatra drives EPC demand through new upstream infrastructure and production facilities, expanding opportunities for engineering and procurement service providers.
Brunei Shell Petroleum Sdn Bhd (BSP) awarded John Wood Group PLC and Tendrill International Sdn. Bhd, its joint venture (JV) partner, a five-year contract for brownfield engineering, procurement, and construction (EPC) services. This oil and gas EPC market development boosts long-term service scope, highlighting sustained demand for refurbishment and operational support in mature assets.
SLB announced that Equinor (Technical Service Provider) awarded its OneSubseaTM joint venture an engineering, procurement, and construction (EPC) contract for a CO2 subsea injection system for the Northern Lights phase two project offshore Norway. SLB and Equinor’s EPC contract for a CO₂ subsea injection system advances low-carbon infrastructure, positioning EPC firms as key enablers in carbon management and offshore sustainability initiatives.
The state-owned Oil & Natural Gas Corporation (ONGC) of India gave a large shipyard a sizable offshore contract for the additional offshore infrastructure needed for a significant west coast project. ONGC’s offshore west coast project expands EPC opportunities in large-scale offshore infrastructure, emphasizing India’s push to strengthen upstream capacity and regional energy security.
Liquefied Natural Gas has become a critical growth lever in EPC. For example, India’s Ministry of Petroleum announced investments exceeding USD 60 billion in LNG terminals and gas pipelines by 2030 to secure cleaner energy in December 2020. Similarly, QatarEnergy’s North Field Expansion, one of the largest LNG project, has already awarded billions in EPC contracts to global firms like McDermott and Technip Energies. These initiatives demonstrate how LNG serves as a transitional bridge fuel while locking EPC companies into long-term project cycles, bolstering the oil and gas EPC market growth.
Offshore oil and gas projects, especially deepwater fields, are regaining momentum. In November 2023, Brazil’s Petrobras revealed investments worth USD 73 billion between 2024 and 2028, with the majority directed toward upstream offshore development. Simultaneously, Africa is emerging as a hotspot with Senegal and Mozambique approving multibillion-dollar LNG projects requiring EPC execution. The complexity of offshore fields necessitates specialized EPC services, making companies with deep technical and project management expertise highly sought-after in global bidding processes.
Digital twin adoption in EPC is redefining execution timelines and safety compliance. Governments are encouraging this oil and gas EPC market trend, with the European Union’s Horizon program channeling funding into digital EPC tools for energy infrastructure. By blending predictive analytics and AI-driven planning, digital twins are positioning EPC players to win high-value contracts from both NOCs and IOCs aiming at leaner operations.
Energy transition is further reshaping the oil and gas EPC market dynamics. In the United States, the Infrastructure Investment and Jobs Act already earmarked USD 12 billion for carbon capture, hydrogen hubs, and clean fuel projects requiring EPC services in May 2023. Major oilfield contractors are diversifying portfolios, such as Fluor expanding into hydrogen EPC. Middle East governments are also investing in blue hydrogen, with Saudi Arabia’s NEOM project projected at over USD 8.4 billion, entirely dependent on EPC execution. This transition trend ensures EPC firms retain relevance while aligning with decarbonization imperatives.
EPC firms are increasingly shifting towards modularization to reduce costs and improve delivery timelines. For instance, ExxonMobil’s Guyana offshore development saw modular units pre-assembled in fabrication yards, reducing offshore installation risks. Asian contractors, particularly in South Korea, are leading with large-scale modular EPC yards, making this a highly scalable global trend. For B2B decision-makers, modularization ensures predictable returns and mitigated risk exposure.
Read more about this report - REQUEST FREE SAMPLE COPY IN PDF
The EMR’s report titled “Global Oil and Gas EPC Market Report and Forecast 2026-2035” offers a detailed analysis of the market based on the following segments:
Market Breakup by Sector
Key Insight: Upstream is leading the market with offshore exploration projects as its core pillar, while midstream is outpacing in oil and gas EPC industry growth due to LNG and gas infrastructure investments. The downstream sector is steadily sustained by refinery expansions and petrochemical integration, ensuring EPC contractors remain active across the full value chain of oil and gas.
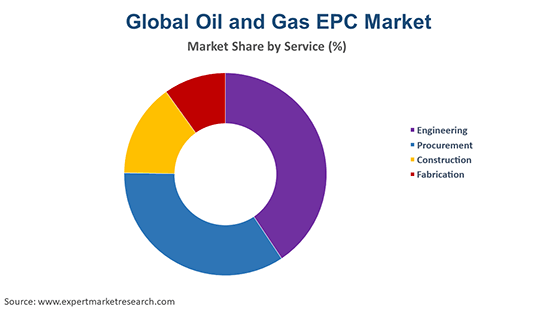
Market Breakup by Service
Key Insight: Engineering remains indispensable as the dominant service, ensuring projects are technically and economically feasible, while procurement, construction, and fabrication each provide critical value in project execution. Construction, however, stands out for its accelerated growth, aligned with new modularization techniques.
Market Breakup by Location
Key Insight: Onshore EPC leads the oil and gas EPC market with steady refinery expansions, pipeline development, and petrochemical projects, ensuring consistent execution. Offshore EPC, fueled by deepwater and subsea exploration, is expanding rapidly. While onshore provides reliable infrastructure growth, offshore introduces high-value opportunities.
Market Breakup by Region
Key Insight: Asia Pacific leads the oil and gas EPC market with strong LNG and refining investments, while the Middle East and Africa record the fastest growth through mega oil, gas, and clean fuel projects. North America, Europe, and Latin America sustain steady opportunities, supported by refinery upgrades, pipeline expansions, and offshore developments, ensuring balanced regional contributions to the global market.
By sector, upstream EPC contracts dominate due to massive offshore exploration investments
Upstream continues to account for the dominant share of EPC contracts, driven by exploration and production activities across deepwater fields. Brazil, Guyana, and Mozambique are prime examples where massive EPC investments in subsea systems, drilling platforms, and production units are being deployed. Companies like Saipem and Subsea 7 are witnessing strong pipelines of upstream contracts, while government programs supporting energy security are directly fueling this demand.
Midstream is registering the fastest growth in the oil and gas EPC market, propelled by global gas trade expansion. India alone has committed USD 118 billion into refinery upgrades and gas pipeline expansions in October 2019, much of which fall under EPC execution. Similarly, United Sttaes LNG export terminal projects, like Venture Global’s Plaquemines, awarded EPC contracts worth billions to KBR and Bechtel. This trend is strengthened by rising natural gas imports in Asia-Pacific, making midstream EPC central to energy supply chain resilience.
By service, engineering dominates the market due to design complexity in offshore and LNG projects
Engineering wins major EPC contracts, particularly for offshore and LNG terminals that demand highly complex design blueprints. Companies such as Worley and Technip Energies are winning contracts largely on the strength of their engineering capabilities. Offshore fields like Brazil’s Santos Basin, as well as mega LNG projects in Qatar and Australia, place heavy emphasis on precision engineering to meet both cost efficiency and safety standards.
Construction services are expanding their share in the oil and gas EPC market revenue, at the fastest pace, particularly as modular construction gains traction globally. South Korean and Chinese contractors are increasingly taking on global EPC projects because of their advanced fabrication and modular yard facilities. Large projects such as ExxonMobil’s Guyana development and QatarEnergy’s North Field East are heavily dependent on accelerated construction models.
By location, onshore EPC leads the market due to refinery and pipeline projects
Onshore projects largely contribute to the oil and gas EPC market value, primarily because of their large-scale refinery expansions, petrochemical facilities, and cross-border pipeline networks. These projects demand intensive engineering and procurement activities, coupled with governments’ focus on modernizing downstream assets to meet cleaner fuel regulations. Onshore EPC also benefits from reduced technical risks compared to offshore, making contract execution timelines more predictable.
Offshore EPC is registering the fastest growth, fueled by deepwater drilling, subsea infrastructure development, and the revival of exploration activities in frontier basins. National oil companies and IOCs are betting heavily on offshore reserves to meet long-term production targets, leading to increasing demand for specialized EPC contractors. Harsh environment projects in regions like West Africa and Latin America, coupled with ultra-deepwater plays in Brazil and the Gulf of Mexico, are further pushing EPC providers to deliver cutting-edge offshore platforms and subsea systems.


Read more about this report - REQUEST FREE SAMPLE COPY IN PDF
Asia Pacific dominates the market driven by LNG demand and refining growth
Asia Pacific leads the global market, supported by massive energy demand, rapid industrialization, and growing LNG import infrastructure. Countries like India and China are channeling heavy investments into refining, pipelines, and LNG receiving terminals, creating a robust EPC contract landscape. Additionally, Southeast Asia is emerging as a hotspot for new exploration and petrochemical projects. Governments are pushing for self-reliance in energy security, ensuring that EPC contractors play a pivotal role in executing large-scale projects.
The Middle East and Africa represent the fastest-growing oil and gas EPC market, buoyed by large-scale upstream and downstream projects. Saudi Arabia, UAE, and Qatar are investing aggressively in oil, gas, and clean fuel infrastructure, while African nations like Mozambique and Nigeria are entering the LNG export space. The region’s focus on economic diversification, coupled with new energy transition investments, is creating a lucrative environment for EPC firms.
The market is shaped by rapid technological innovation, large-scale government projects, and the accelerating transition toward cleaner energy infrastructure. Leading oil and gas EPC companies are concentrating on areas like digital integration, modular construction, and carbon capture solutions to strengthen their ability to win contracts across both conventional oil and gas and transitional energy domains.
Key opportunities are unfolding in LNG terminal development, offshore deepwater projects, and hydrogen infrastructure, where EPC expertise is vital for execution. Oil and gas EPC market players adopting digital twin platforms to optimize timelines and improve safety are gaining a significant edge. Additionally, diversification into new regions and alignment with decarbonization initiatives are becoming essential for staying relevant. Firms that combine technical depth with sustainable project delivery are positioning themselves strongly for long-term growth, capturing demand from both traditional hydrocarbons and the fast-emerging low-carbon ecosystem that is reshaping global EPC priorities.
Saipem SpA was established in 1957 and is headquartered in Milan, Italy. The company is recognized for its offshore engineering strength, particularly in subsea and deepwater projects. Saipem has recently advanced modularization and automation in project delivery, enabling faster timelines in offshore EPC contracts.
TechnipFMC PLC was founded in 2017 after the merger of Technip and FMC Technologies and is headquartered in London, United Kingdom. It is a global leader in subsea engineering and integrated project delivery. The company is known for pioneering subsea 2.0 systems, enabling reduced installation costs and improved efficiency.
John Wood Group PLC was founded in 1982 and is headquartered in Scotland. The company operates across energy and industrial markets, with strong expertise in engineering and consultancy services. Wood has been investing in digital engineering tools and automation to streamline EPC workflows.
Bechtel Corporation was founded in 1898 and is headquartered in California, United States. Bechtel is one of the largest EPC firms globally, with unmatched expertise in large-scale infrastructure delivery. Its projects include LNG export terminals, petrochemical complexes, and mega refineries.
*Please note that this is only a partial list; the complete list of key players is available in the full report. Additionally, the list of key players can be customized to better suit your needs.*
Other key players in the market are Fluor Corporation and Petrofac Limited, among others.
Explore the latest trends shaping the global oil and gas EPC market 2026-2035 with our in-depth report. Gain strategic insights, future forecasts, and key market developments that can help you stay competitive. Download a free sample report or contact our team for customized consultation on oil and gas EPC market trends 2026.
Upto 15% Off
USD
$2499 $2249
$3999 $3599
$4999 $4249
$5999 $5099


*While we strive to always give you current and accurate information, the numbers depicted on the website are indicative and may differ from the actual numbers in the main report. At Expert Market Research, we aim to bring you the latest insights and trends in the market. Using our analyses and forecasts, stakeholders can understand the market dynamics, navigate challenges, and capitalize on opportunities to make data-driven strategic decisions.*
The market is projected to grow at a CAGR of 4.30% between 2026 and 2035.
EPC stakeholders are expanding low-carbon portfolios, adopting digital twin platforms, leveraging modular construction, targeting LNG and hydrogen infrastructure, and forming strategic alliances to secure resilience and competitiveness in global markets.
The increasing energy consumption, the rising production of oil and gas, the surging feasibility of deep water and ultra-deep-water projects are the key trends guiding the market growth.
The major regions in the market are North America, Latin America, the Middle East and Africa, Europe, and the Asia Pacific.
The significant sectors considered in the market report include upstream, midstream, and downstream.
The major segments based on services considered in the market report are engineering, procurement, construction, and fabrication.
The various segments on the basis of location considered in the market report are onshore and offshore.
The key players in the market include Saipem SpA, TechnipFMC PLC, John Wood Group PLC, Bechtel Corporation, Fluor Corporation, and Petrofac Limited, among others.
In 2025, the oil and gas EPC market reached an approximate value of USD 56.83 Billion.
Rising project costs, supply chain disruptions, and pressure to align with decarbonization targets remain major challenges for companies in a volatile oil and gas EPC market.
Explore our key highlights of the report and gain a concise overview of key findings, trends, and actionable insights that will empower your strategic decisions.
| REPORT FEATURES | DETAILS |
| Base Year | 2025 |
| Historical Period | 2019-2025 |
| Forecast Period | 2026-2035 |
| Scope of the Report |
Historical and Forecast Trends, Industry Drivers and Constraints, Historical and Forecast Market Analysis by Segment:
|
| Breakup by Sector |
|
| Breakup by Service |
|
| Breakup by Location |
|
| Breakup by Region |
|
| Market Dynamics |
|
| Competitive Landscape |
|
| Companies Covered |
|
| Report Price and Purchase Option | Explore our purchase options that are best suited to your resources and industry needs. |
| Delivery Format | Delivered as an attached PDF and Excel through email, with an option of receiving an editable PPT, according to the purchase option. |
Datasheet
One User
USD 2,499
USD 2,249
tax inclusive*
Single User License
One User
USD 3,999
USD 3,599
tax inclusive*
Five User License
Five User
USD 4,999
USD 4,249
tax inclusive*
Corporate License
Unlimited Users
USD 5,999
USD 5,099
tax inclusive*
*Please note that the prices mentioned below are starting prices for each bundle type. Kindly contact our team for further details.*
Flash Bundle
Small Business Bundle
Growth Bundle
Enterprise Bundle
*Please note that the prices mentioned below are starting prices for each bundle type. Kindly contact our team for further details.*
Flash Bundle
Number of Reports: 3
20%
tax inclusive*
Small Business Bundle
Number of Reports: 5
25%
tax inclusive*
Growth Bundle
Number of Reports: 8
30%
tax inclusive*
Enterprise Bundle
Number of Reports: 10
35%
tax inclusive*
How To Order

Select License Type
Choose the right license for your needs and access rights.

Click on ‘Buy Now’
Add the report to your cart with one click and proceed to register.

Select Mode of Payment
Choose a payment option for a secure checkout. You will be redirected accordingly.
Strategic Solutions for Informed Decision-Making
Gain insights to stay ahead and seize opportunities.

Get insights & trends for a competitive edge.

Track prices with detailed trend reports.

Analyse trade data for supply chain insights.

Leverage cost reports for smart savings

Enhance supply chain with partnerships.

Connect For More Information
Our expert team of analysts will offer full support and resolve any queries regarding the report, before and after the purchase.
Our expert team of analysts will offer full support and resolve any queries regarding the report, before and after the purchase.
We employ meticulous research methods, blending advanced analytics and expert insights to deliver accurate, actionable industry intelligence, staying ahead of competitors.
Our skilled analysts offer unparalleled competitive advantage with detailed insights on current and emerging markets, ensuring your strategic edge.
We offer an in-depth yet simplified presentation of industry insights and analysis to meet your specific requirements effectively.


