

Consumer Insights
Uncover trends and behaviors shaping consumer choices today
Procurement Insights
Optimize your sourcing strategy with key market data
Industry Stats
Stay ahead with the latest trends and market analysis.
The global optical position sensors market size reached a value of around USD 2.26 Billion in 2025. The market is expected to grow at a CAGR of 9.10% between 2026 and 2035, reaching a value of around USD 5.40 Billion by 2035.
Compound Annual Growth Rate
9.1%
Value in USD Billion
2026-2035
Optical position sensors refer to sensors that utilise changes in light characteristic such as polarisation, wavelength, phase, and intensity, to identify information regarding the position of an object. They are used for locating desired objects with the sensor tracking how light moves when it interacts with the target object. These sensors are frequently utilised in semiconductor chips and modules, vehicles, consumer electronics, medical equipment, and aircraft, among other products.
Read more about this report - REQUEST FREE SAMPLE COPY IN PDF
The EMR’s report titled “Optical Position Sensors Market Report and Forecast 2026-2035" offers a detailed analysis of the market based on the following segments:
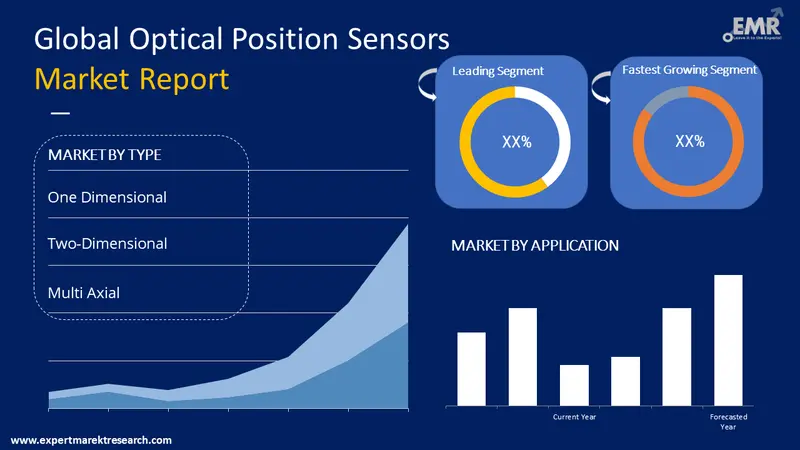
Market Breakup by Type
Market Breakup by Application
Market Breakup by Region
Automotive applications account for a growing portion of the optical position sensors market share, bolstered by increased automotive production and demand for automotives with improved technology. The requirements for automotive applications is expected to grow due to the increasing need for optical position sensing in steering wheel position, throttle control, automatic gear selection, and maintaining vehicle stability. These sensors assist with parking by detecting changes in a vehicle's position as well as enhancing the security of the driver by releasing the airbag in accordance with the driver's position.
Meanwhile, consumer electronics is a growing application sector due to the rising demand for smart gadgets like smartphones and tablets with advanced capabilities which is propelling the optical position sensors market value. The applications of optical position sensors in consumer electronics is anticipated to increase dramatically in the upcoming years as the utilisation of optical position sensors rises for enhancing the power management of smart gadgets. These sensors are also commonly used in consumer electrical applications due to their feature support, small size, dependability, and low power consumption.


The Asia Pacific currently holds a leading position in the market for optical position sensors due to the region's continually rising demand for smart electronic gadgets, which is being driven by the growing middle-class population with rising spending power. Moreover, the Asia Pacific region's heightening demand for and manufacturing of automobiles is anticipated to fuel the growth of the optical position sensor market. The expanding industrial sector in countries such as China and India, and established manufacturing base are further increasing the production and usage of optical position sensors in the region. In North America, ongoing technological developments in the semiconductor industry and the expansion of the automotive industry have aided the growth of the market for optical position sensors in the region.
The comprehensive EMR report provides an in-depth assessment of the market based on the Porter's five forces model, along with giving a SWOT analysis. The report gives a detailed analysis of the following key players in the global optical position sensors market, covering their competitive landscape and the latest developments like mergers, acquisitions, investments, and expansion plans.
Sensata Technologies, Inc., a major provider of sensing, electrical protection, control, and power management systems, is headquartered in Massachusetts, United States and was established in 2006. Millions of individuals benefit daily from Sensata's products in the automotive, military, appliance, heavy vehicle, telecommunications, aerospace, industrial, heating, air conditioning and ventilation, data, recreational vehicle, and marine industries.
Melexis NV, founded in 1989 and headquartered in Ypres, Belgium, is one of the leaders in the automotive sensors industry that creates, produces, and distributes cutting-edge microelectronic solutions. Next-generation devices and systems incorporate sensing, driving, and communication using the company's sophisticated mixed-signal semiconductor sensors and actuators. They encourage sustainability, raise efficiency, and enhance comfort.
Mouser Electronics, Inc., founded in 1964, is a leading authorised distributor of semiconductors and electronic components with local sales and service centres spread out over the world. The company, which has its headquarters in Texas, United States, specialises in bringing new products and technology to the market quickly for buyers and design engineers. Among the wide range of products the company offers are semiconductors, interconnects, passives, and electromechanical components.
*Please note that this is only a partial list; the complete list of key players is available in the full report. Additionally, the list of key players can be customized to better suit your needs.*
Other market players include Siemens AG, First Sensor AG, Opto Diode Corp, Zygo Corporation, Panasonic Corporation, Exxelia Group, and Bourns, Inc., among others.
Upto 15% Off
USD
$2499 $2249
$3999 $3599
$4999 $4249
$5999 $5099


*While we strive to always give you current and accurate information, the numbers depicted on the website are indicative and may differ from the actual numbers in the main report. At Expert Market Research, we aim to bring you the latest insights and trends in the market. Using our analyses and forecasts, stakeholders can understand the market dynamics, navigate challenges, and capitalize on opportunities to make data-driven strategic decisions.*
In 2025, the global market for optical position sensors attained a value of USD 2.26 Billion.
The market is projected to grow at a CAGR of 9.10% between 2026 and 2035.
The market is estimated to witness a healthy growth in the forecast period of 2026-2035 to reach USD 5.40 Billion by 2035.
The major drivers of the market include the rising demand for handheld devices such as smartphones and tablets, increasing usage of optical position sensors in the automotive industry, and ongoing technological innovations.
Increasing focus on safety and reliability, prominence of gesture recognition, advancements in virtual reality, and widespread usage of wearable medical devices are the key trends propelling the growth of the market.
The major regions in the market are North America, Europe, the Asia Pacific, Latin America, and the Middle East and Africa.
The significant types of optical position sensors include one dimensional, two- dimensional, and multi axial.
The various applications of optical position sensors include automotive, aerospace and defence, healthcare, and consumer electronics, among others.
The general structure of an optical fiber sensor system composes of four components namely source, fibre optic, transducer, and detector.
The major players in the optical position sensors market are Siemens AG, First Sensor AG, Sensata Technologies, Inc., Melexis NV, Mouser Electronics, Inc., Opto Diode Corp, Zygo Corporation, Panasonic Corporation, Exxelia Group, and Bourns, Inc., among others.
Explore our key highlights of the report and gain a concise overview of key findings, trends, and actionable insights that will empower your strategic decisions.
| REPORT FEATURES | DETAILS |
| Base Year | 2025 |
| Historical Period | 2019-2025 |
| Forecast Period | 2026-2035 |
| Scope of the Report |
Historical and Forecast Trends, Industry Drivers and Constraints, Historical and Forecast Market Analysis by Segment:
|
| Breakup by Type |
|
| Breakup by Application |
|
| Breakup by Region |
|
| Market Dynamics |
|
| Competitive Landscape |
|
| Companies Covered |
|
Datasheet
One User
USD 2,499
USD 2,249
tax inclusive*
Single User License
One User
USD 3,999
USD 3,599
tax inclusive*
Five User License
Five User
USD 4,999
USD 4,249
tax inclusive*
Corporate License
Unlimited Users
USD 5,999
USD 5,099
tax inclusive*
*Please note that the prices mentioned below are starting prices for each bundle type. Kindly contact our team for further details.*
Flash Bundle
Small Business Bundle
Growth Bundle
Enterprise Bundle
*Please note that the prices mentioned below are starting prices for each bundle type. Kindly contact our team for further details.*
Flash Bundle
Number of Reports: 3
20%
tax inclusive*
Small Business Bundle
Number of Reports: 5
25%
tax inclusive*
Growth Bundle
Number of Reports: 8
30%
tax inclusive*
Enterprise Bundle
Number of Reports: 10
35%
tax inclusive*
How To Order

Select License Type
Choose the right license for your needs and access rights.

Click on ‘Buy Now’
Add the report to your cart with one click and proceed to register.

Select Mode of Payment
Choose a payment option for a secure checkout. You will be redirected accordingly.
Strategic Solutions for Informed Decision-Making
Gain insights to stay ahead and seize opportunities.

Get insights & trends for a competitive edge.

Track prices with detailed trend reports.

Analyse trade data for supply chain insights.

Leverage cost reports for smart savings

Enhance supply chain with partnerships.

Connect For More Information
Our expert team of analysts will offer full support and resolve any queries regarding the report, before and after the purchase.
Our expert team of analysts will offer full support and resolve any queries regarding the report, before and after the purchase.
We employ meticulous research methods, blending advanced analytics and expert insights to deliver accurate, actionable industry intelligence, staying ahead of competitors.
Our skilled analysts offer unparalleled competitive advantage with detailed insights on current and emerging markets, ensuring your strategic edge.
We offer an in-depth yet simplified presentation of industry insights and analysis to meet your specific requirements effectively.


