

Consumer Insights
Uncover trends and behaviors shaping consumer choices today
Procurement Insights
Optimize your sourcing strategy with key market data
Industry Stats
Stay ahead with the latest trends and market analysis.
The global organic LED market attained a value of USD 68.91 Billion in 2025 and is projected to expand at a CAGR of 23.20% through 2035. The market is further expected to achieve USD 555.12 Billion by 2035. The global market is being driven by increased application of OLEDs in high-end automobile cockpits and augmented reality gadgets.
Increased usage of OLED in automotive industry and mixed reality is driving global investments in ultrathin, power efficient, and flexible display technologies. One main reason behind the massive growth in the organic LED market is designing premium intelligent dashboard systems for vehicles and mixed reality applications. Another reason behind the increased usage is the increased adoption of OLED micro-displays for industrial purposes in medical, aviation training, and smart manufacturing applications. As a result of this trend, global display makers are partnering with semiconductor manufacturers and organic material providers to enhance efficiency and stability of commercial display technologies.
The organic LED market is expected to continue experiencing dynamic shifts on account of significant investments into ultra-thin display designs, automotive visualization solutions, and innovative emissive materials. In January 2025, LG Display introduced a series of commercially viable 4-stack OLED panels intended to be used in high-end televisions and premium car display interfaces, allowing for increased luminous efficiency alongside decreased power consumption. Companies are increasingly focusing on innovation to enhance the brightness of the panels, while simultaneously decreasing the energy consumption of OLED displays compared to standard constructions.
The organic LED market is further influenced by a restructuring trend in the production of premium consumer electronics products and the establishment of advanced display manufacturing centers within Asia-Pacific countries. Smartphone producers are actively switching over to flexible OLED architectures to achieve innovative design solutions, such as foldable phones with enhanced refresh rates and minimal bezel dimensions. For example, in May 2026, Samsung unveiled a 3,000-nit OLED panel with 96% BT.2020 color coverage for vibrant smartphone displays. Additionally, manufacturers are actively investing in the development of blue OLED phosphorescent emitters for extended lifetime and minimized burn-in effects.
Compound Annual Growth Rate
23.2%
Value in USD Billion
2026-2035
Get a sample of the market report in PDF – REQUEST A FREE SAMPLE
LG Display showcased state-of-the-art OLED technology advancements including stretchable, highly bright, and AI-enabled display solutions as part of next-gen consumer electronics devices. Such technologies motivate competing firms to invest in flexible OLED screens, AI enabled displays, and energy-efficient premium visualization technologies, thereby boosting the organic LED market growth.
TCL CSOT launched premium OLED and LCD displays with features of improved refresh rate, brightness performance, and immersive large screen visual experience. Such technological advancements provide opportunities for improvements in display refresh technology along with premium entertainment-oriented OLED products.
The BenQ company developed its fastest OLED gaming monitor with extremely fast refresh rates and improved color accuracy. Such advancements can provide an opportunity for brands in the organic LED market to create monitors tailored for esports games with fast response and immersive gaming experiences.
Haier launched a range of smart OLED televisions that feature Harman Kardon speakers and Dolby Atmos technology. Such advancements demonstrate an opportunity for companies to manufacture OLED TVs that offer high-quality audio and visual experiences.
Vehicle makers are becoming one of the most powerful corporate clients for high-end OLED displays. The latest premium electric car models are incorporating curved OLED dashboard displays, pillar-to-pillar infotainment screens, and see-through side-display modules in upcoming vehicle platforms. For example, in April 2026, BOE Technology Group announced increased panel supplies for flexible OLED automotive components aimed at the smart cockpit platform in China and Europe. Companies are choosing OLED displays due to their higher contrast ratios, thinner designs, and reduced energy consumption than LCD-based systems, accelerating growth in the organic LED market.
Flexible OLED display technology is rapidly transforming the design approach of smartphones, tablets, and notebooks. Companies are developing flexible OLED screens that can be folded and rolled up to distinguish top-of-the-line products and increase the life cycle of consumer devices. OLED producers are optimizing ultra-thin glass material resistance and hinge design to alleviate mechanical stress while folding, redefining the organic LED market trends and dynamics. For instance, in January 2026, Lenovo Group Limited launched an OLED roll-up laptop concept designed for business users in need of portability and multitasking capabilities. The governments of South Korea and Taiwan are also encouraging investment in the semiconductor-display industry.
Micro-OLEDs are gaining more attention in the fields of augmented reality and virtual reality headgear applications due to their small size and high pixel density. Currently, technology firms are showing keen interest in the development of ultra-high-resolution micro-displays that can enable immersive visualization and reduce lag, creating new opportunities in the organic LED market. In January 2024, Sony Group Corporation extended the development of OLED micro-displays used in enterprise AR and VR headset technologies as well as content creation. Some of the key markets driving the use of OLED micro-displays include aerospace and the healthcare industry, due to an increasing focus on simulation-based training methods. In addition, governments of the United States and Japan are supporting innovation in the ecosystem of immersive technologies through government-sponsored grants for defense-related digital visualization innovations.
Innovation in terms of material is expected to be one of the highly contested aspects of the global industry, particularly with regard to blue phosphorescent emitters. Presently, blue OLED devices require significantly more energy compared to green and red emitters and have relatively lower lifetimes. Companies are now competing for developing stable blue phosphorescent technology that would help increase efficiency in televisions, mobile devices, and vehicles. In February 2026, LG Display and Universal Display renewed long-term OLED material and licensing agreements to accelerate next-generation display innovation. Such organic LED market developments are expected to lower panel energy consumption significantly while extending device lifetimes.
Transparent OLED technology is progressively being adopted in commercial architectural designs, retail visualization applications, and transportation infrastructure initiatives, propelling demand in the organic LED market. The adoption of transparent OLED displays in luxury retail stores and hospitality operations is rising due to their use in providing engaging customer brand experiences. For example, in January 2024, Veeo and LG unveiled transparent OLED conferencing displays featuring gesture controls and enhanced eye-contact communication for immersive virtual collaboration. Transparent OLED displays are also being considered by airports and metro transportation providers for the provision of digital signage and passenger communication. Smart city initiatives in the UAE, Singapore, and South Korea are promoting the installation of intelligent visualization systems within the urban infrastructure landscape.
Read more about this report - REQUEST FREE SAMPLE COPY IN PDF
The Expert Market Research report titled “Global Organic LED Market Report and Forecast 2026-2035” offers a detailed analysis of the market based on the following segments:
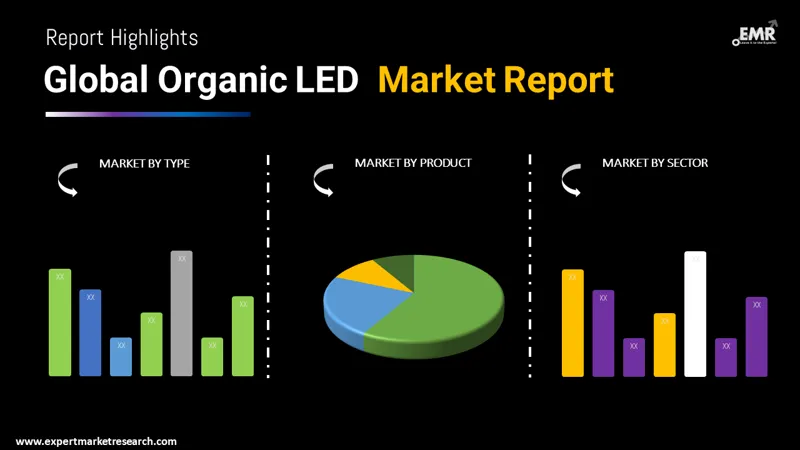
Market Breakup by Type
Key Insight: Flexible OLED continues to dominate the organic LED market because of the increasing need for flexible smartphones, curved displays in vehicles, and lightweight premium gadgets that need flexible display components. The growth of rigid OLED technology is growing consistently as companies search for cheaper solutions that provide better color contrasts and reduced power requirements. Rigid OLED screens are becoming popular among premium electronics makers and mobility players looking to offer unique user experiences, whereas rigid screens continue to be highly favored when manufacturing smartphones and visualization tools for industries. For example, in September 2025, Samsung Display showcased automotive OLED innovations featuring customizable digital cockpit displays, foldable panels, and advanced mobility-focused visualization technologies.
Market Breakup by Product
Key Insight: The display product segment continues to dominate the organic LED market due to the criticality of OLEDs for high-end consumer electronics, vehicle visualization tools, and gaming systems that require excellent color depth and slim panels. On the other hand, the lighting category is attracting more attention due to the increasing demand for efficient illumination products by commercial organizations and mobility firms with greater design flexibility. OLEDs play an integral role in product differentiation in the electronics industry, while OLED lighting is increasingly shaping luxury architecture, smart living spaces, and vehicle interior lighting systems. In April 2026, Audi introduced refreshed Q4 e-tron models featuring digital OLED lighting, enhanced charging speeds, and improved electric driving range.
Market Breakup by Technology
Key Insight: As per the organic LED market report, Passive Matrix OLED remains applicable to small electronics and wearables because of more straightforward structure designs and easier manufacturing processes. Active Matrix OLED dominates the premium electronics category because it ensures high refresh rate performance, efficiency, and visual quality on phones and TVs. Transparent OLED finds application in the construction of retail facilities and car controls where immersion effects in display design are required. Top emitting OLED technology facilitates thin display designs and optimized brightness on small devices. Foldable OLED is driving the development of multifunctional consumer products, whereas White OLED is crucial in TV and lighting production where balanced luminosity and enhanced color quality are necessary. In April 2025, Synaptics launched S3930 touch controllers engineered for foldable OLED devices, delivering responsive interactions, improved accuracy, and enhanced energy efficiency.
Market Breakup by Application
Key Insight: The television and monitor segments continue to show increased interest owing to the superior quality of color reproduction, refresh rate, and gaming provided by the OLED technology. The smartphone industry accounts for the dominant share in the organic LED market, owing to an increase in premium phone production and the use of foldable displays globally. There is a continuous uptake of OLED panels in laptops and tablets to enhance visualization, light weight, and efficiency in power consumption. Another area where OLED applications are growing fast is the automotive industry, where smart cockpits and other mobile interface solutions are necessary in premium vehicles.
Market Breakup by Sector
Key Insight: Commercial utilization continues to be dominant across the organic LED market scope as companies proceed with utilizing OLED-based visualization systems, transparent signage, and high-end digital engagement platforms within their retail, hospitality, and entertainment settings. For example, in July 2025, LG launched next-generation OLED evo and QLED televisions featuring AI-powered personalization, immersive visuals, and advanced smart entertainment capabilities. There is a steady rise in residential uptake with the help of OLED innovations such as high-end television sets, smart lighting, and high-end interior displays. Industrial uptake is also on the rise since OLED technology can be used to design small visualization screens, automation platforms, and clear operation monitoring screens.
Market Breakup by Region
Key Insight: The organic LED market growth in Europe is propelled by automotive development, sustainable lighting solutions, and consumer electronics. Asia Pacific remains dominant due to its display production ecosystem, semiconductors industry, and smartphone assembly plants. North America is making progress through innovations in XR headsets, automotive visualization systems, and collaborative display technology research. The Latin American region is also experiencing steady growth in the adoption of OLEDs for consumer electronics and commercial displays as their digital infrastructure improves. In the Middle East and Africa region, OLEDs are increasingly used in luxury retail displays, smart infrastructure development, and entertainment solutions.
By type, flexible OLED accounts for the largest share of the market due increasing foldable consumer electronics manufacturing globally
Flexible OLED represents the largest segment of the organic LED market as smartphone companies increasingly become aggressive about implementing new technologies such as curved, foldable, and ultra-thin display formats. These firms are using flexible panels in their top-end phones, automobile cockpit systems, and wearable gadgets so as to enhance lightness and picture quality. Display firms are developing tough and durable glass for ultra-thin panels in addition to better encapsulation techniques that prevent damage when folded repeatedly. For instance, in May 2026, ASUS unveiled a lightweight portable OLED monitor supporting flexible work setups with enhanced color accuracy and productivity-focused portability. Further, OLED providers are focusing on negotiating strategic deals with top electronic brands to ensure steady procurement orders.
The rigid organic LED market is witnessing tremendous growth on account of its cost-efficient characteristics and widespread adoption in mid-end mobile phones, tablet computers, and business display devices. Firms are opting to use rigid OLEDs for manufacturing purposes due to their simplicity in production process as well as their superior color contrast and energy efficiency levels. Display makers in China are working tirelessly to boost rigid OLED manufacturing capacity to offer competition to premium LCD panels in the affordable electronics space.
By product, the display segment secures the leading market position owing to rising premium smartphone and television display integration
The display category leads the overall organic LED market growth owing to the increasing importance of OLED displays in premium smartphones, televisions, automobile dashboard panels, game monitors, and wearable gadgets. The electronic goods industry is focusing on OLED displays due to the superior contrast ratio, thin profile, and increased refresh rate of OLED displays as opposed to existing LCD technology. Smartphone makers are using advanced OLED display technologies to help differentiate their products and make them appear premium. For example, in May 2026, Samsung Display was selected by Apple to make LTPO+ OLED panels for the iPhone 18 Pro and the iPhone 18 Pro Max.
The OLED lighting industry is growing at a rapid pace as architects and designers in the luxury commercial construction segment require ultrathin lighting panels for better efficiency. In comparison to existing LED lighting, OLED lighting technology helps in achieving a smooth surface light output that blends well within the architecture, thereby stimulating the organic LED market penetration. Leading hospitality providers and commercial buildings are opting for OLED lighting solutions in order to realize their modern interiors as well as glare-free light output. In February 2026, Samsung Display unveiled biometric Sensor OLED, stretchable displays, and ultra-bright Flex Chroma Pixel technologies for next-generation smart devices.
Access Detailed Forecasts & Data-Driven Insights – Download Free PDF
By technology, the category of Active Matrix OLED clocks in a substantial share of the market driven by premium smartphone and television demand
Active Matrix OLED continues to be prevalent within the organic LED market dynamics since the technology offers high refresh rates, better pixel control, and display responsiveness that are necessary in top-tier smartphones, televisions, computer monitors, and automobile displays. Electronics companies are increasingly adopting AMOLED displays in their flagship products due to the need for smooth visuals, higher contrast ratios, and power efficiency. In addition, AMOLED technology allows for bigger display sizes and higher resolutions that are necessary for high-end entertainment and auto vehicle dashboard screens. In March 2024, SmartKem and RiTdisplay initiated development of commercially ready OTFT-based AMOLED displays featuring higher brightness and lower power consumption.
Foldable OLED technology is witnessing rapid adoption since leading electronics firms are competing to launch unique foldable phones, tablets, and laptops, thereby stimulating the organic LED market penetration. Firms are embracing foldable OLED technology to produce multipurpose electronic devices that are both portable and feature large screens. Innovations in ultra-thin glass substrates, flexible hinges, and encapsulation technologies are helping OLED panel makers make their products more durable and reliable. Moreover, foldable OLED panels are also being favored by organizations looking for productive devices with flexible designs.
By application, smartphones dominate the market due to increasing premium OLED display adoption across flagship devices
Smartphones continue to represent the leading application category, owing to the importance of OLED screens in defining flagship products and their advanced functionalities. Smartphones are increasingly incorporating OLED panels for enhanced color accuracy, sleeker construction, low power consumption, and fast refresh rates. Foldable smartphone models are driving further the organic LED market growth, as players are looking to differentiate their products through display innovation and novel product forms. Companies are incorporating LTPO OLED solutions in order to optimize the power management and adaptive refresh rate of smartphones.
The automotive sector is quickly expanding its share in the organic LED market, with OEMs increasingly using OLED displays in intelligent cockpit solutions, infotainment consoles, digital rear-view mirrors, and lighting ambiance environments. The adoption of OLED is becoming more common, since the technology enables curved shapes, lightweight construction, and visibility in a variety of lighting conditions. Luxury electric vehicle automakers are increasingly adopting OLED visualizations to strengthen their premium brand positioning and enhance in-vehicle user experiences. Suppliers of automobiles also investigate transparent OLED solutions for next-gen mobility and self-driving interfaces. In December 2024, OLEDWorks launched second-generation Atala OLED lighting featuring customizable segmented panels and advanced Vehicle-to-Everything communication capabilities for automotive integration.
The commercial sector registers a significant share of the market due to increasing enterprise visualization and digital signage deployment
The commercial sector is leading in terms of contributing to the organic LED market value because of rapid adoption of OLED screens by businesses for use in the retail sector, the hospitality industry, the entertainment industry, and enterprise visualizations. The use of OLED digital signage and transparent displays by firms for improved customer engagement and better brand positioning is increasing. Retailers and upscale businesses are adopting OLED technologies owing to their thin nature, vivid displays, and efficiency in terms of power consumption. In September 2024, Panasonic launched OLED and Mini-LED televisions featuring Fire TV integration, immersive streaming capabilities, and premium cinematic viewing experiences.
The organic LED market observes a growing adoption of OLED display technology in the industrial sector due to increased demand for improved monitoring, industrial automation interface, and robust visualizations. The manufacturing sector is increasingly relying on OLED panels for machine controls as well as in smart factories due to improved visibility and easy integration. Industrial manufacturers are also focusing on OLED displays for their diagnostic tools, instrumentation, and monitoring systems.


Asia Pacific secures the leading market position due to strong display manufacturing ecosystems and consumer electronics
Asia Pacific emerges to be the key organic LED market since the region houses the biggest OLED manufacturing cluster, which includes several top-notch display makers, semiconductor companies, and consumer electronics manufacturers. Nations such as South Korea, China, and Japan are making heavy investments in advanced display manufacturing technologies and OLED material research. The region also benefits from strong OLED manufacturing capabilities, supported by the high concentration of smartphone and television manufacturers. In May 2025, Samsung introduced its 2025 OLED and Neo QLED television lineup featuring Vision AI, glare-free displays, and immersive smart entertainment technologies.
The North American organic LED market is expected to grow the fastest in terms of adoption and manufacturing of OLED-based displays. This is because of the high growth potential of automobile makers, XR manufacturers, and premium electronics firms, who are making increased investments in OLED integration and advanced OLED display manufacturing. The micro-OLEDs segment shows great growth potential in the region because of increased demand for AR devices, military visualization devices, and medical simulation technologies.
The competition is growing fierce as display companies, material vendors, and electronics brands emphasize flexible designs, see-through interfaces, and highly efficient emissive materials. Investments in foldable OLED design, tandem OLED displays, and micro-OLEDs, used in XR hardware and smart vehicle cockpit, are being made by many businesses. There has been a surge in collaborations between semiconductor manufacturers and organic LED market players to enhance power management and display reaction times.
Additionally, firms target the development of phosphorescent blue emitter technology to address OLED displays' longevity and energy efficiency issues. The introduction of OLED displays in automobiles is generating new opportunities for suppliers who specialize in curved dashboard panels and transparent display solutions. On the other hand, organic LED companies are regionalizing their production facilities to ensure reliable supply chain management and decrease reliance on concentrated display manufacturing clusters.
Established in 1996, with its headquarters in Hsinchu, Taiwan, AU Optronics Corp. specializes in the manufacturing of high-end OLED displays for automotive components, notebooks, and premium consumer electronic gadgets. The firm intends to invest more in the development of micro-LED/OLED hybrid technology, together with the deployment of intelligent smart cockpit display solutions.
Cambridge Display Technology Limited was founded in 2007 with headquarters in the United Kingdom. The firm concentrates on the manufacture of polymer OLEDs, and emissive material development. Cambridge Display Technology Limited offers support services to OLED makers in terms of advanced material research aimed at improving display efficiency and lifespan.
Founded in 1994 and based out of New Jersey, United States, Universal Display Corporation is well-known for phosphorescent OLEDs and innovative display technology solutions. The company collaborates with panel manufacturers to produce OLED emitters which can be used in energy-saving applications. It focuses on sustainable material systems and high-quality OLED architecture that can help create premium smartphones, televisions, and automotive displays.
LG Electronics Inc. was established in 1958, and its headquarters are located in Seoul, South Korea. The organization has sustained its OLED dominance by producing premium television models, transparent displays, and automotive visualization displays. It is investing in tandem OLED screens as well as AI-powered display solutions to optimize brightness and viewing performance.
Other key players in the market include Samsung Electronics Co., Ltd., among others.
*Please note that this is only a partial list; the complete list of key players is available in the full report. Additionally, the list of key players can be customized to better suit your needs.*
Unlock the latest insights with our organic LED market trends 2026 report. Discover regional growth patterns, consumer preferences, and key industry players. Stay ahead of competition with trusted data and expert analysis. Download your free sample report today and drive informed decisions in the market.
Upto 15% Off
USD
$2499 $2249
$3999 $3599
$4999 $4249
$5999 $5099


*While we strive to always give you current and accurate information, the numbers depicted on the website are indicative and may differ from the actual numbers in the main report. At Expert Market Research, we aim to bring you the latest insights and trends in the market. Using our analyses and forecasts, stakeholders can understand the market dynamics, navigate challenges, and capitalize on opportunities to make data-driven strategic decisions.*
The global organic LED market reached a value of USD 68.91 Billion in 2025.
The market is projected to grow at a CAGR of nearly 23.20% in the forecast period of 2026-2035.
The market is estimated to reach a value of about USD 555.12 Billion by 2035.
The major drivers of the market include rising disposable incomes, increasing population, and the product’s high productivity, low power utilisation, enhanced image quality, durability, and lightweight.
The rising demand for environmentally friendly goods is expected to be a key trend guiding the growth of the market.
North America, Europe, the Asia Pacific, Latin America, and the Middle East and Africa are the leading regions in the market.
The major types of organic LED are flexible OLED and rigid OLED.
The leading products in the market are display and lighting.
The significant technologies of organic LED in the market are passive matrix OLED, active matrix OLED, transparent OLED, top-emitting OLED, foldable OLED, and white OLED.
The major application segments in the market are television and monitors, smartphones, laptops and tablets, and automotive, among others.
The leading sectors in the market are commercial, residential, and industrial.
The leading players in the market are Au Optronics Corp. (TPE: 2409), Cambridge Display Technology Limited, Universal Display Corporation (NASDAQ: OLED), LG Electronics Inc. (KRX: 066570), and Samsung Electronics Co., Ltd. (KRX: 005930), among others.
Explore our key highlights of the report and gain a concise overview of key findings, trends, and actionable insights that will empower your strategic decisions.
| REPORT FEATURES | DETAILS |
| Base Year | 2025 |
| Historical Period | 2019-2025 |
| Forecast Period | 2026-2035 |
| Scope of the Report |
Historical and Forecast Trends, Industry Drivers and Constraints, Historical and Forecast Market Analysis by Segment:
|
| Breakup by Type |
|
| Breakup by Product |
|
| Breakup by Technology |
|
| Breakup by Application |
|
| Breakup by Sector |
|
| Breakup by Region |
|
| Market Dynamics |
|
| Competitive Landscape |
|
| Companies Covered |
|
| Report Price and Purchase Option | Explore our purchase options that are best suited to your resources and industry needs. |
| Delivery Format | Delivered as an attached PDF and Excel through email, with an option of receiving an editable PPT, according to the purchase option. |
Datasheet
One User
USD 2,499
USD 2,249
tax inclusive*
Single User License
One User
USD 3,999
USD 3,599
tax inclusive*
Five User License
Five User
USD 4,999
USD 4,249
tax inclusive*
Corporate License
Unlimited Users
USD 5,999
USD 5,099
tax inclusive*
*Please note that the prices mentioned below are starting prices for each bundle type. Kindly contact our team for further details.*
Flash Bundle
Small Business Bundle
Growth Bundle
Enterprise Bundle
*Please note that the prices mentioned below are starting prices for each bundle type. Kindly contact our team for further details.*
Flash Bundle
Number of Reports: 3
20%
tax inclusive*
Small Business Bundle
Number of Reports: 5
25%
tax inclusive*
Growth Bundle
Number of Reports: 8
30%
tax inclusive*
Enterprise Bundle
Number of Reports: 10
35%
tax inclusive*
How To Order

Select License Type
Choose the right license for your needs and access rights.

Click on ‘Buy Now’
Add the report to your cart with one click and proceed to register.

Select Mode of Payment
Choose a payment option for a secure checkout. You will be redirected accordingly.
Strategic Solutions for Informed Decision-Making
Gain insights to stay ahead and seize opportunities.

Get insights & trends for a competitive edge.

Track prices with detailed trend reports.

Analyse trade data for supply chain insights.

Leverage cost reports for smart savings

Enhance supply chain with partnerships.

Connect For More Information
Our expert team of analysts will offer full support and resolve any queries regarding the report, before and after the purchase.
Our expert team of analysts will offer full support and resolve any queries regarding the report, before and after the purchase.
We employ meticulous research methods, blending advanced analytics and expert insights to deliver accurate, actionable industry intelligence, staying ahead of competitors.
Our skilled analysts offer unparalleled competitive advantage with detailed insights on current and emerging markets, ensuring your strategic edge.
We offer an in-depth yet simplified presentation of industry insights and analysis to meet your specific requirements effectively.


