

Consumer Insights
Uncover trends and behaviors shaping consumer choices today
Procurement Insights
Optimize your sourcing strategy with key market data
Industry Stats
Stay ahead with the latest trends and market analysis.
The Global Over The Top (OTT) Market reached a value of USD 143.43 Billion at 2025 and is projected to expand at a CAGR of around 15.00% during the forecast period of 2026-2035. With ad-tier acceleration, FAST channel expansion, premium platform consolidation, and rapid emerging-market adoption, the market is expected to reach USD 580.25 Billion by 2035.
Compound Annual Growth Rate
15%
Value in USD Billion
2026-2035
Read more about this report - REQUEST FREE SAMPLE COPY IN PDF
Hybrid monetisation, FAST channel proliferation, AI-augmented content discovery and platform consolidation are the dominant trends shaping the Global Over The Top (OTT) Market growth profile through the forecast period.
On 10 April 2026, Amazon launched Prime Video Ultra, a premium ad-free tier priced at USD 4.99 per month (or USD 45.99 per year) on top of an Amazon Prime membership. The new tier replaces the previous USD 2.99 ad-free add-on and adds exclusive 4K/UHD access, five concurrent streams and one hundred downloads. The launch reinforces Prime Video's position as a streaming aggregator, sitting alongside the company's bundle that pairs Apple TV and Peacock Premium Plus inside Prime Video for USD 19.99 per month.
Disney is in the process of fully integrating Hulu into the Disney+ app in 2026, phasing out the standalone Hulu experience and combining Disney Animation, Pixar, Marvel, Star Wars, National Geographic and FX originals with Hulu's on-demand catalogue inside a single interface. As part of the rollout, Disney repriced the Disney+/Hulu/ESPN Select bundle to USD 20 (ad-supported) and USD 30 (ad-free), while ESPN was rebranded into ESPN Unlimited. The integration is supported by a partnership with OpenAI to embed AI-generated character clips inside Disney+.
In December 2025, Netflix entered into a definitive agreement to acquire Warner Bros. Discovery in a cash-and-stock transaction valued at approximately USD 72 billion, with the deal expected to close within 18 months subject to regulatory approval. The combination would unite Netflix's global streaming platform with WBD's premium film, episodic and HBO library, accelerating consolidation in the streaming sector. Netflix ended Q4 2025 with more than 325 million paid memberships and over USD 1.5 billion in 2025 ad revenue, providing scale for integration synergies.
Apple TV launched as a paid add-on subscription inside Amazon Prime Video in the United States in October 2025 at USD 9.99 per month, granting Prime members access to Severance, Slow Horses, The Morning Show, Presumed Innocent, Shrinking, Hijack, Loot, Palm Royale, Major League Soccer and Major League Baseball through a single billing relationship. The launch underscores Amazon's strategic positioning of Prime Video as the dominant streaming aggregator in the US and reflects an industry-wide shift toward bundled distribution and reduced subscription friction.
NBCUniversal's Peacock reported 44 million paid subscribers at the end of 2025, up 22% year over year, supported by NFL, NBA and Premier League rights, expansive Universal film windows and original series. Peacock's growth came alongside a Prime Video bundle that pairs Apple TV with Peacock Premium Plus at USD 19.99 per month, illustrating how legacy media owners are leveraging hyperscaler distribution to add subscribers. Peacock's hybrid AVOD/SVOD architecture has been central to its scaling, particularly around tentpole live-sports moments.
Streaming services are pivoting toward hybrid monetisation models combining SVOD, AVOD, FAST and PPV. Netflix reported that 45% of household viewing hours are now happening on its ad-supported tier, up from 34% a year earlier, while FAST channel hours grew over 70% from 2023 levels. The shift, validated by Comscore's 2025 State of Streaming report, is driving Global Over The Top (OTT) Market growth by lowering the price of entry for cord-cutters and expanding ad inventory monetisable to advertisers seeking premium video at scale.
Netflix's December 2025 USD 72 billion agreement to acquire Warner Bros. Discovery is the most significant proposed M&A in OTT history, signalling that scale, library depth and bundling power are now the primary competitive levers. Disney's parallel integration of Hulu into Disney+ and the rebrand of ESPN+ into ESPN Unlimited consolidate the company's hybrid bundle. The combined effect is fewer, deeper streaming destinations versus a fragmented decade prior, with mid-tier services facing structural pressure.
Premium tiering is becoming a default monetisation play, illustrated by Amazon's Prime Video Ultra (USD 4.99/mo, launched 10 April 2026) and the maturation of multi-service bundles inside Prime Video. With Apple TV, Peacock Premium Plus and other channels available as add-ons, Prime Video is functioning as a streaming aggregator that allows consumers to manage premium content via one billing relationship. The trend reduces churn, improves ARPU and creates new wholesale revenue streams for content owners distributing through hyperscaler ecosystems.
OTT platforms are deploying generative AI for content recommendations, dynamic dubbing, accessibility, ad personalisation and on-platform content. Disney's 2026 partnership with OpenAI to embed AI-generated character clips inside Disney+ exemplifies how AI is moving from back-office cost optimisation into the consumer experience. AI-driven personalisation is increasingly important for ad-tier monetisation – matching the right content to the right viewer to support yield – and reinforcing competitive moats around large first-party data sets held by leading platforms.
Read more about this report - REQUEST FREE SAMPLE COPY IN PDF
The Expert Market Research’s report titled “Global Over the Top (OTT) Market Report and Forecast 2026-2035” offers a detailed analysis of the market based on the following segments:
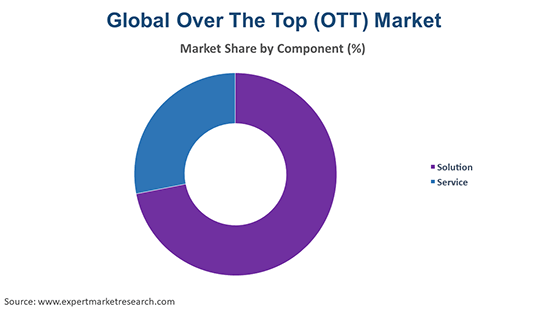
Market Breakup by Component
Key Insight: The solution component remains the largest sub-segment, encompassing video, audio, gaming and communication platforms operated by Netflix, Disney+, Amazon Prime Video, Apple TV and other major players. Service revenue – including managed cloud streaming, content delivery, encoding and analytics – is rising fastest, supported by AWS, Google Cloud, Akamai and other infrastructure suppliers. The Hulu/Disney+ integration in 2026 and Amazon's Prime Video Ultra tier launch reinforce solution-side dominance, while infrastructure services scale alongside.
Market Breakup by Device
Key Insight: Smartphones lead OTT consumption time, particularly across emerging markets where mobile is the primary screen. Smart TVs anchor household viewing and capture premium ad inventory, while gaming consoles and set-top boxes connect AAA gaming to streaming services such as Xbox Game Pass cloud streaming. Desktop and tablet usage remains relevant for productivity-adjacent OTT consumption (live news, work-from-home), and connected device proliferation continues to expand total addressable hours.
Market Breakup by Content Type
Key Insight: Video is the dominant content type by both revenue and engagement, supported by SVOD, AVOD, FAST and live sports rights such as Apple's MLS deal and Peacock's NFL/NBA contracts. Audio/VoIP is a major sub-segment via Spotify, Apple Music and Amazon Music, while games and communication (WhatsApp, Zoom, Teams) remain meaningful contributors to total OTT activity. Cross-content bundles – exemplified by Disney+/ESPN/Hulu and Amazon's Prime Video aggregator strategy – are increasing the share of multi-content OTT consumption.
Market Breakup by Revenue Model
Key Insight: Subscription remains the largest revenue model in dollar terms, but hybrid (SVOD + ads) is the fastest-growing model, with Netflix's ad-supported tier reaching 45% of household viewing hours by Q4 2025. Pure advertising-funded services (FAST, AVOD) are scaling rapidly, with channel counts and engagement up double digits in 2025. The mix shift toward hybrid is reshaping content economics, with platforms tuning ad load, frequency capping and AI-driven personalisation to maximise ARPU.
Market Breakup by Application
Key Insight: Personal applications dominate consumer OTT spend, while commercial applications – encompassing enterprise streaming, training, internal communications and corporate video – are growing through hybrid work normalisation and digital learning expansion.
Market Breakup by End Use
Key Insight: Media and entertainment is the dominant end-use vertical, supported by streaming, OTT advertising and live sports. Education and training is rapidly adopting OTT to deliver scalable learning and corporate development content, while health and fitness platforms (Peloton, Apple Fitness+) leverage OTT delivery for connected experiences. IT and telecom, e-commerce, BFSI and government adopt OTT for customer engagement, employee training and citizen services, expanding the market beyond consumer entertainment.
Market Breakup by Region
Key Insight: North America leads OTT revenue, anchored by Netflix, Disney+, Amazon Prime Video, Apple TV, Peacock and HBO Max. Europe combines mature Western markets with rising regional content investment in the UK, Germany, France and Italy. Asia-Pacific is the fastest-growing region, with India, China, Japan, ASEAN and South Korea driving subscriber additions. Latin America is dominated by Netflix and Globoplay, while the Middle East and Africa continue to grow rapidly on smartphone-led adoption and regional service launches.
By Component, Solutions hold the leading share. The category encompasses Netflix's 325 million paid memberships at the end of 2025, Disney+'s integrated Hulu library and Amazon's Prime Video aggregator strategy. Netflix's December 2025 USD 72 billion agreement to acquire Warner Bros. Discovery underscores the strategic premium placed on solution-side scale. Service revenues, although smaller in absolute terms, are growing on the back of cloud delivery, encoding, advertising stack and analytics offerings tied to the underlying solutions.
By Revenue Model, Subscription leads in dollar terms, but Hybrid is the most dynamic sub-segment. Netflix's ad tier reaching 45% of household hours by late 2025, Amazon's Prime Video Ultra premium tier launching in April 2026 and Disney's 2026 reset of the ad-supported and ad-free Disney+/Hulu/ESPN bundle all reflect platforms tuning monetisation around hybrid. The combined effect of subscription stability and hybrid expansion is supporting overall ARPU and protecting growth even as pure-SVOD price elasticity tightens.


Read more about this report - REQUEST FREE SAMPLE COPY IN PDF
North America is the dominant regional OTT market, anchored by Netflix, Disney+, Amazon Prime Video, Apple TV, Peacock, HBO Max and a range of niche subscription and FAST services. The region hosts the world's most developed advertising ecosystem, supporting hybrid monetisation maturity, and concentrates strategic transactions such as Netflix's USD 72 billion agreement to acquire Warner Bros. Discovery (December 2025) and Disney's 2026 Hulu integration. Major investments include Apple's MLS rights, Disney's ESPN Unlimited rebrand and Amazon's Prime Video Ultra tier (10 April 2026). Demand drivers include high disposable income, advanced broadband penetration and a robust connected-TV advertising market.
Asia Pacific is the fastest-growing OTT region, led by India, China, Japan, South Korea and ASEAN markets. Smartphone-first consumption, 5G rollouts, regional originals investment by Disney+ Hotstar, JioCinema, iQIYI and YouTube and the rise of regional AVOD models support double-digit subscriber expansion. Major players including Netflix, Amazon Prime Video, Apple, Hulu (under Disney) and Rakuten compete with strong domestic platforms. Demand drivers include young consumer demographics, expanding middle-class spend, premium connectivity and aggressive content investment in local-language scripted, sports and gaming categories.
The Global Over The Top (OTT) Market is moderately concentrated, with Netflix, Disney+, Amazon Prime Video, Apple TV+ and HBO Max controlling the majority of premium SVOD revenue, supported by infrastructure leaders such as Amazon Web Services, Google Cloud and Akamai. Hybrid monetisation, FAST channels and bundling are reshaping competitive dynamics, while M&A activity – including Netflix's USD 72 billion proposed Warner Bros. Discovery deal – is accelerating concentration.
Competitive priorities include premium content investment, live sports rights, AI-augmented discovery, ad-tech monetisation and bundle architecture. Strategic partnerships – such as Apple TV inside Prime Video, Peacock paired with Apple TV at USD 19.99 per month, and Disney's OpenAI collaboration – signal a shift to coopetition, with platforms simultaneously competing and distributing one another's content within aggregator interfaces.
Founded in 1997 and headquartered in Los Gatos, California, Netflix is the world's largest premium streaming platform, with more than 325 million paid memberships at the end of 2025 and approximately USD 1.5 billion in 2025 ad revenue. The company's December 2025 agreement to acquire Warner Bros. Discovery for USD 72 billion would establish unprecedented content and library scale.
Founded in 1994 (Amazon) and headquartered in Seattle, Washington, Amazon operates Prime Video as part of its Prime ecosystem, supported by Amazon Web Services for streaming infrastructure. Prime Video Ultra (USD 4.99/mo, launched April 2026) and the Apple TV/Peacock Premium Plus bundle position the platform as the dominant US streaming aggregator.
Founded in 1976 and headquartered in Cupertino, California, Apple operates Apple TV+ – distributing originals such as Severance, The Morning Show and Slow Horses, plus Major League Soccer and Major League Baseball rights. Apple TV launched on Prime Video in the US in October 2025 at USD 9.99 per month, materially expanding its addressable subscriber base.
Founded in 2007 and headquartered in Santa Monica, California, Hulu is being fully integrated into the Disney+ app in 2026, combining FX originals, next-day network TV and Disney's family-friendly content into one interface. Bundled with ESPN Unlimited, the integrated Disney+/Hulu offering anchors Disney's hybrid SVOD/AVOD strategy and pricing architecture.
Other key players in the market are Telstra Corporation Limited, Google LLC, Rakuten Group, Inc., and Others.
*Please note that this is only a partial list; the complete list of key players is available in the full report. Additionally, the list of key players can be customized to better suit your needs.*
Discover the latest insights on the Global Over The Top (OTT) Market 2026 with our comprehensive report. Stay ahead of the curve with valuable data on streaming consolidation, hybrid monetisation and top growth regions across the rapidly evolving OTT landscape. Whether you are launching a new platform, expanding internationally or planning content and ad investments, this report gives you the clarity you need. Download your free sample now and discover the key opportunities in the thriving Global Over The Top (OTT) industry.
Upto 15% Off
USD
$3999 $3599
$2499 $2249
$4999 $4249
$5999 $5099


*While we strive to always give you current and accurate information, the numbers depicted on the website are indicative and may differ from the actual numbers in the main report. At Expert Market Research, we aim to bring you the latest insights and trends in the market. Using our analyses and forecasts, stakeholders can understand the market dynamics, navigate challenges, and capitalize on opportunities to make data-driven strategic decisions.*
In 2025, the global over the top (OTT) market reached an approximate value of USD 143.43 Billion.
The market is projected to grow at a CAGR of 15.00% between 2026 and 2035.
The market is estimated to witness a healthy growth in the forecast period of 2026-2035 to reach about USD 580.25 Billion by 2035.
Key strategies driving the market include technology innovation, regional content production, telco partnerships, acquisitions, and diversified monetization models.
The key trends guiding the growth of the market includes the availability of various OTT providers and higher per capita incomes.
The major regions in the market are North America, Latin America, the Middle East and Africa, Europe, and the Asia Pacific.
The leading components of over the top (OTT) in the market are solution and service.
The various devices of over the top (OTT) include smartphones, smart TVs, desktops and tablets, gaming consoles, and set-top box, among others.
The significant content types of over the top (OTT) in the market are video, audio/VoIP, games, and communication, among others.
The leading revenue models of over the top (OTT) in the market are subscription, advertisement, and hybrid, among others.
The major applications of over the top (OTT) are personal and commercial.
The significant end uses of over the top (OTT) are media and entertainment, education and training, health and fitness, IT and telecom, e-commerce, BFSI, and government, among others.
The key players in the market include Amazon Web Services, Inc., Netflix, Inc., Hulu, LLC, Telstra Corporation Limited, Apple Inc., Google LLC, Rakuten Group, Inc., and others.
The over the top (OTT) market faces challenges such as intense competition, high content costs, licensing complexities, multi-device integration, and regulatory compliance.
Explore our key highlights of the report and gain a concise overview of key findings, trends, and actionable insights that will empower your strategic decisions.
| REPORT FEATURES | DETAILS |
| Base Year | 2025 |
| Historical Period | 2019-2025 |
| Forecast Period | 2026-2035 |
| Scope of the Report |
Historical and Forecast Trends, Industry Drivers and Constraints, Historical and Forecast Market Analysis by Segment:
|
| Breakup by Component |
|
| Breakup by Device |
|
| Breakup by Content Type |
|
| Breakup by Revenue Model |
|
| Breakup by Application |
|
| Breakup by End Use |
|
| Breakup by Region |
|
| Market Dynamics |
|
| Competitive Landscape |
|
| Companies Covered |
|
| Report Price and Purchase Option | Explore our purchase options that are best suited to your resources and industry needs. |
| Delivery Format | Delivered as an attached PDF and Excel through email, with an option of receiving an editable PPT, according to the purchase option. |
Single User License
One User
USD 3,999
USD 3,599
tax inclusive*
Datasheet
One User
USD 2,499
USD 2,249
tax inclusive*
Five User License
Five User
USD 4,999
USD 4,249
tax inclusive*
Corporate License
Unlimited Users
USD 5,999
USD 5,099
tax inclusive*
*Please note that the prices mentioned below are starting prices for each bundle type. Kindly contact our team for further details.*
Flash Bundle
Small Business Bundle
Growth Bundle
Enterprise Bundle
*Please note that the prices mentioned below are starting prices for each bundle type. Kindly contact our team for further details.*
Flash Bundle
Number of Reports: 3
20%
tax inclusive*
Small Business Bundle
Number of Reports: 5
25%
tax inclusive*
Growth Bundle
Number of Reports: 8
30%
tax inclusive*
Enterprise Bundle
Number of Reports: 10
35%
tax inclusive*
How To Order

Select License Type
Choose the right license for your needs and access rights.

Click on ‘Buy Now’
Add the report to your cart with one click and proceed to register.

Select Mode of Payment
Choose a payment option for a secure checkout. You will be redirected accordingly.
Strategic Solutions for Informed Decision-Making
Gain insights to stay ahead and seize opportunities.

Get insights & trends for a competitive edge.

Track prices with detailed trend reports.

Analyse trade data for supply chain insights.

Leverage cost reports for smart savings

Enhance supply chain with partnerships.

Connect For More Information
Our expert team of analysts will offer full support and resolve any queries regarding the report, before and after the purchase.
Our expert team of analysts will offer full support and resolve any queries regarding the report, before and after the purchase.
We employ meticulous research methods, blending advanced analytics and expert insights to deliver accurate, actionable industry intelligence, staying ahead of competitors.
Our skilled analysts offer unparalleled competitive advantage with detailed insights on current and emerging markets, ensuring your strategic edge.
We offer an in-depth yet simplified presentation of industry insights and analysis to meet your specific requirements effectively.


