

Consumer Insights
Uncover trends and behaviors shaping consumer choices today
Procurement Insights
Optimize your sourcing strategy with key market data
Industry Stats
Stay ahead with the latest trends and market analysis.
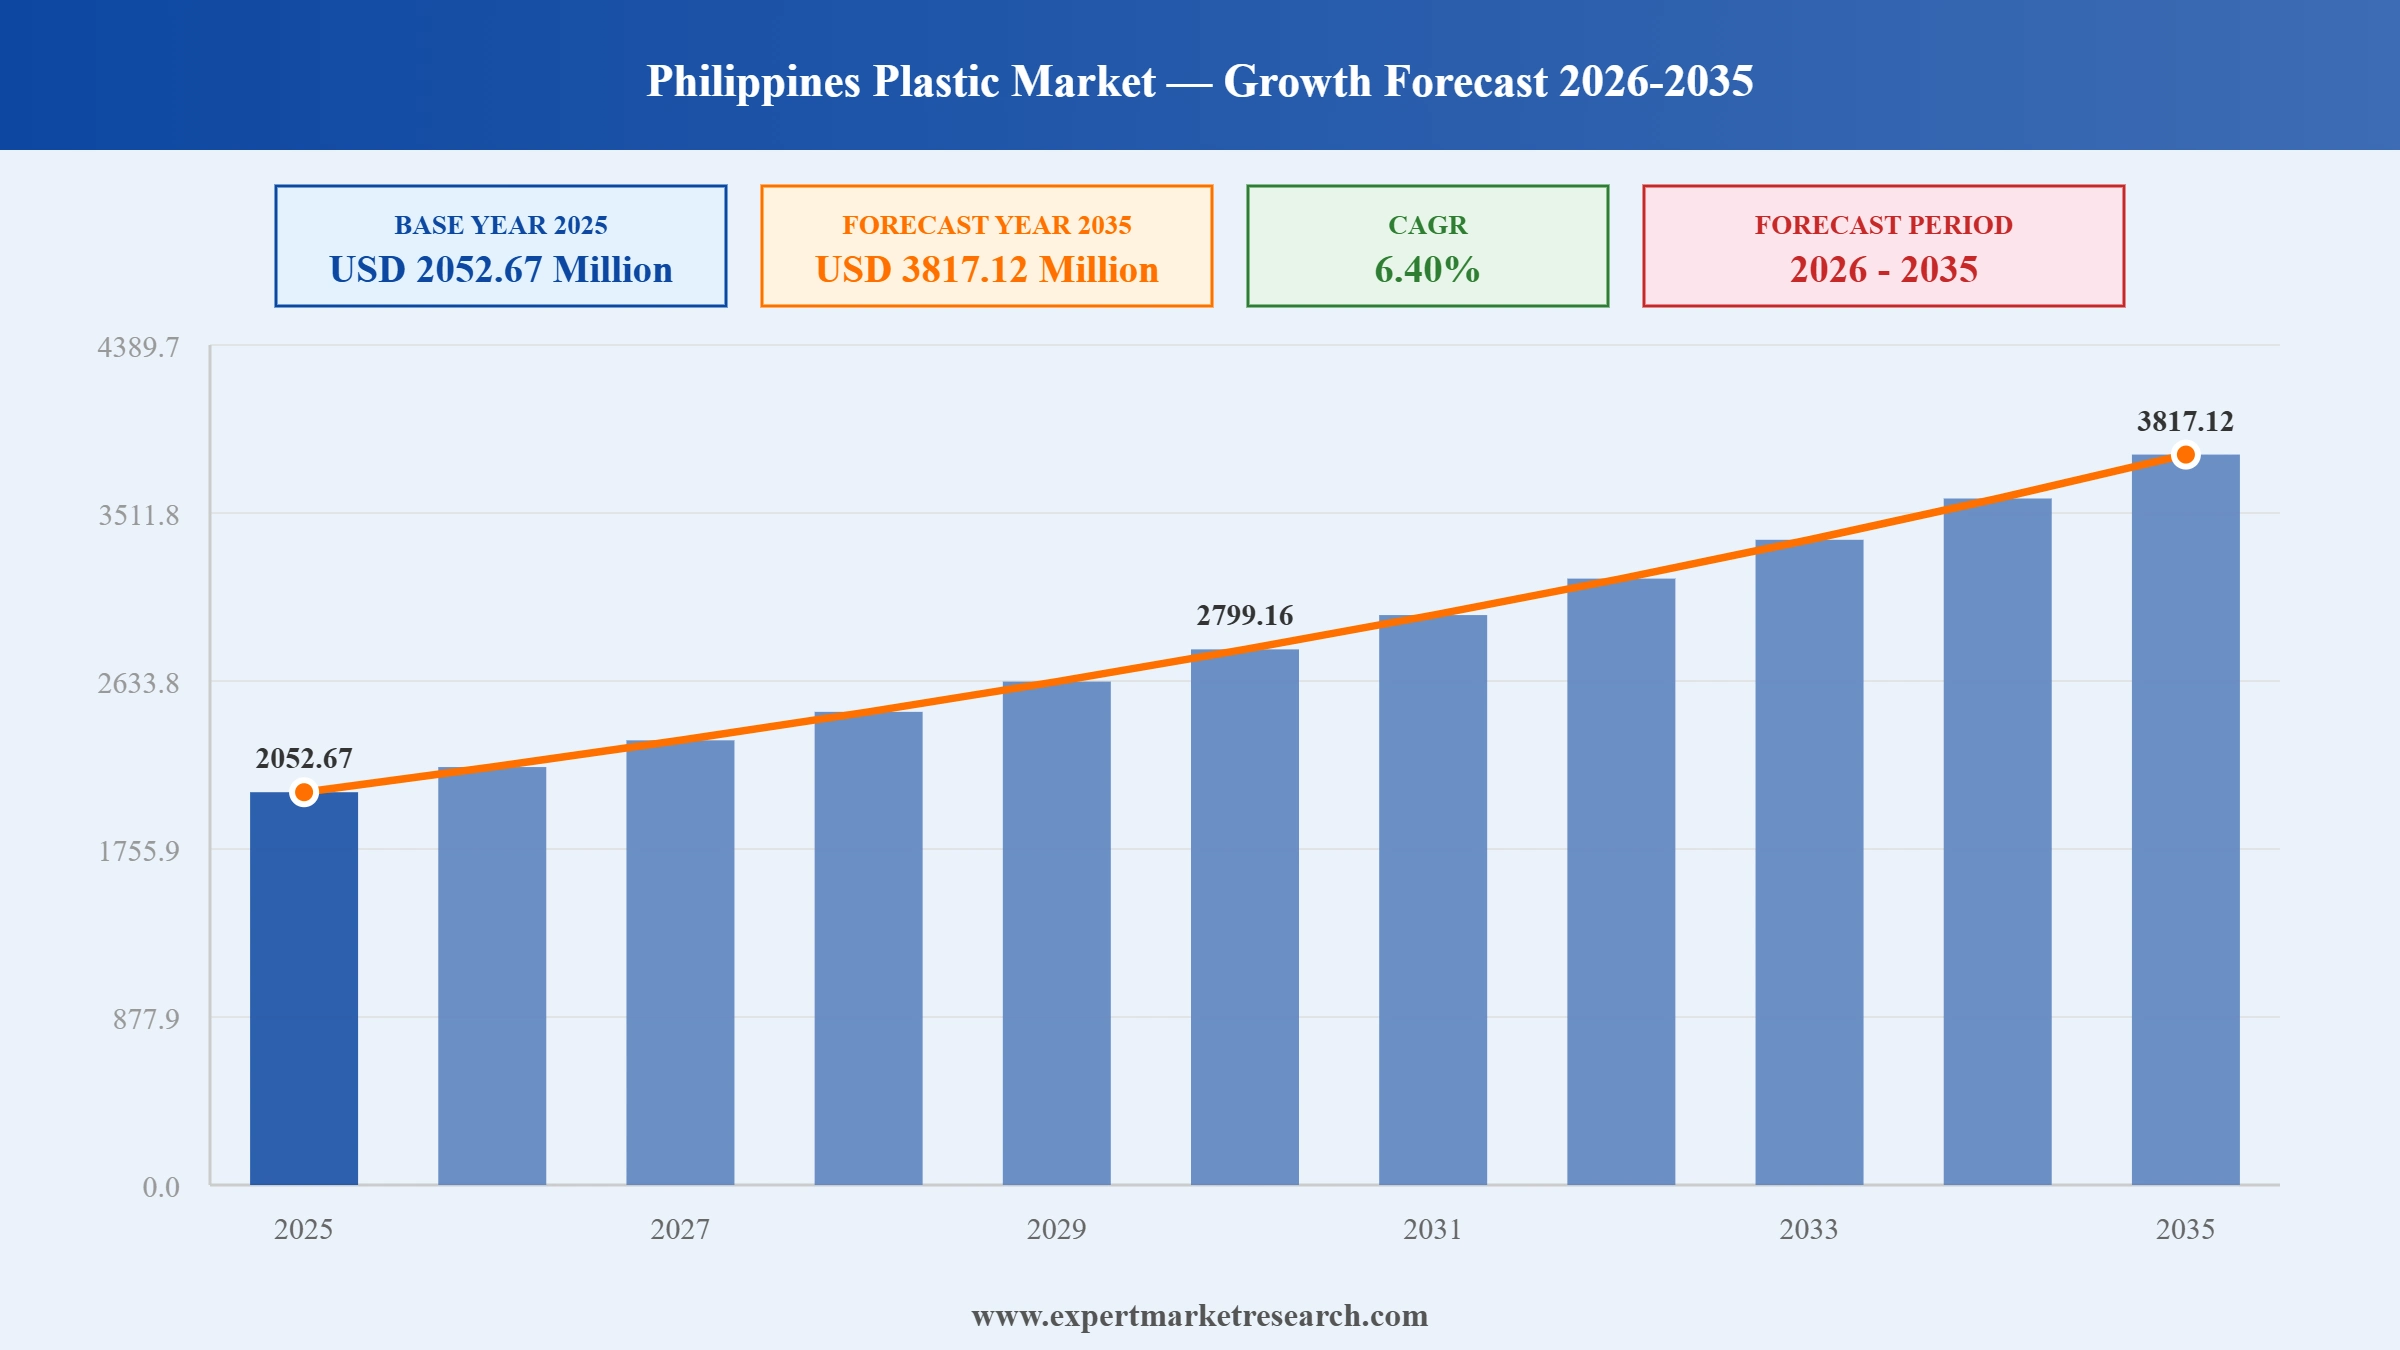
The Philippines plastic market reached a value of USD 2052.67 Million in 2025 and is projected to expand at a CAGR of around 6.40% during the forecast period of 2026-2035. Rising demand from packaging, building and construction, electrical and electronics, automotive, and medical device sectors, the Philippines' expanding consumer market, rapid urbanisation, and government infrastructure investment are driving Philippines plastic market growth. The market is expected to reach USD 3817.12 Million by 2035.
Read more about this report - REQUEST FREE SAMPLE COPY IN PDF
| Philippines Plastic Market Report Summary | Description | Value |
| Base Year | USD Million | 2025 |
| Historical Period | USD Million | 2019-2025 |
| Forecast Period | USD Million | 2026-2035 |
| Market Size 2025 | USD Million | 2052.67 |
| Market Size 2035 | USD Million | 3817.12 |
| CAGR 2019-2025 | Percentage | XX% |
| CAGR 2026-2035 | Percentage | 6.40% |
| CAGR 2026-2035 - Market by Type | Polyvinyl Chloride | 7.1% |
| CAGR 2026-2035 - Market by End Use | Housewares | 7.2% |
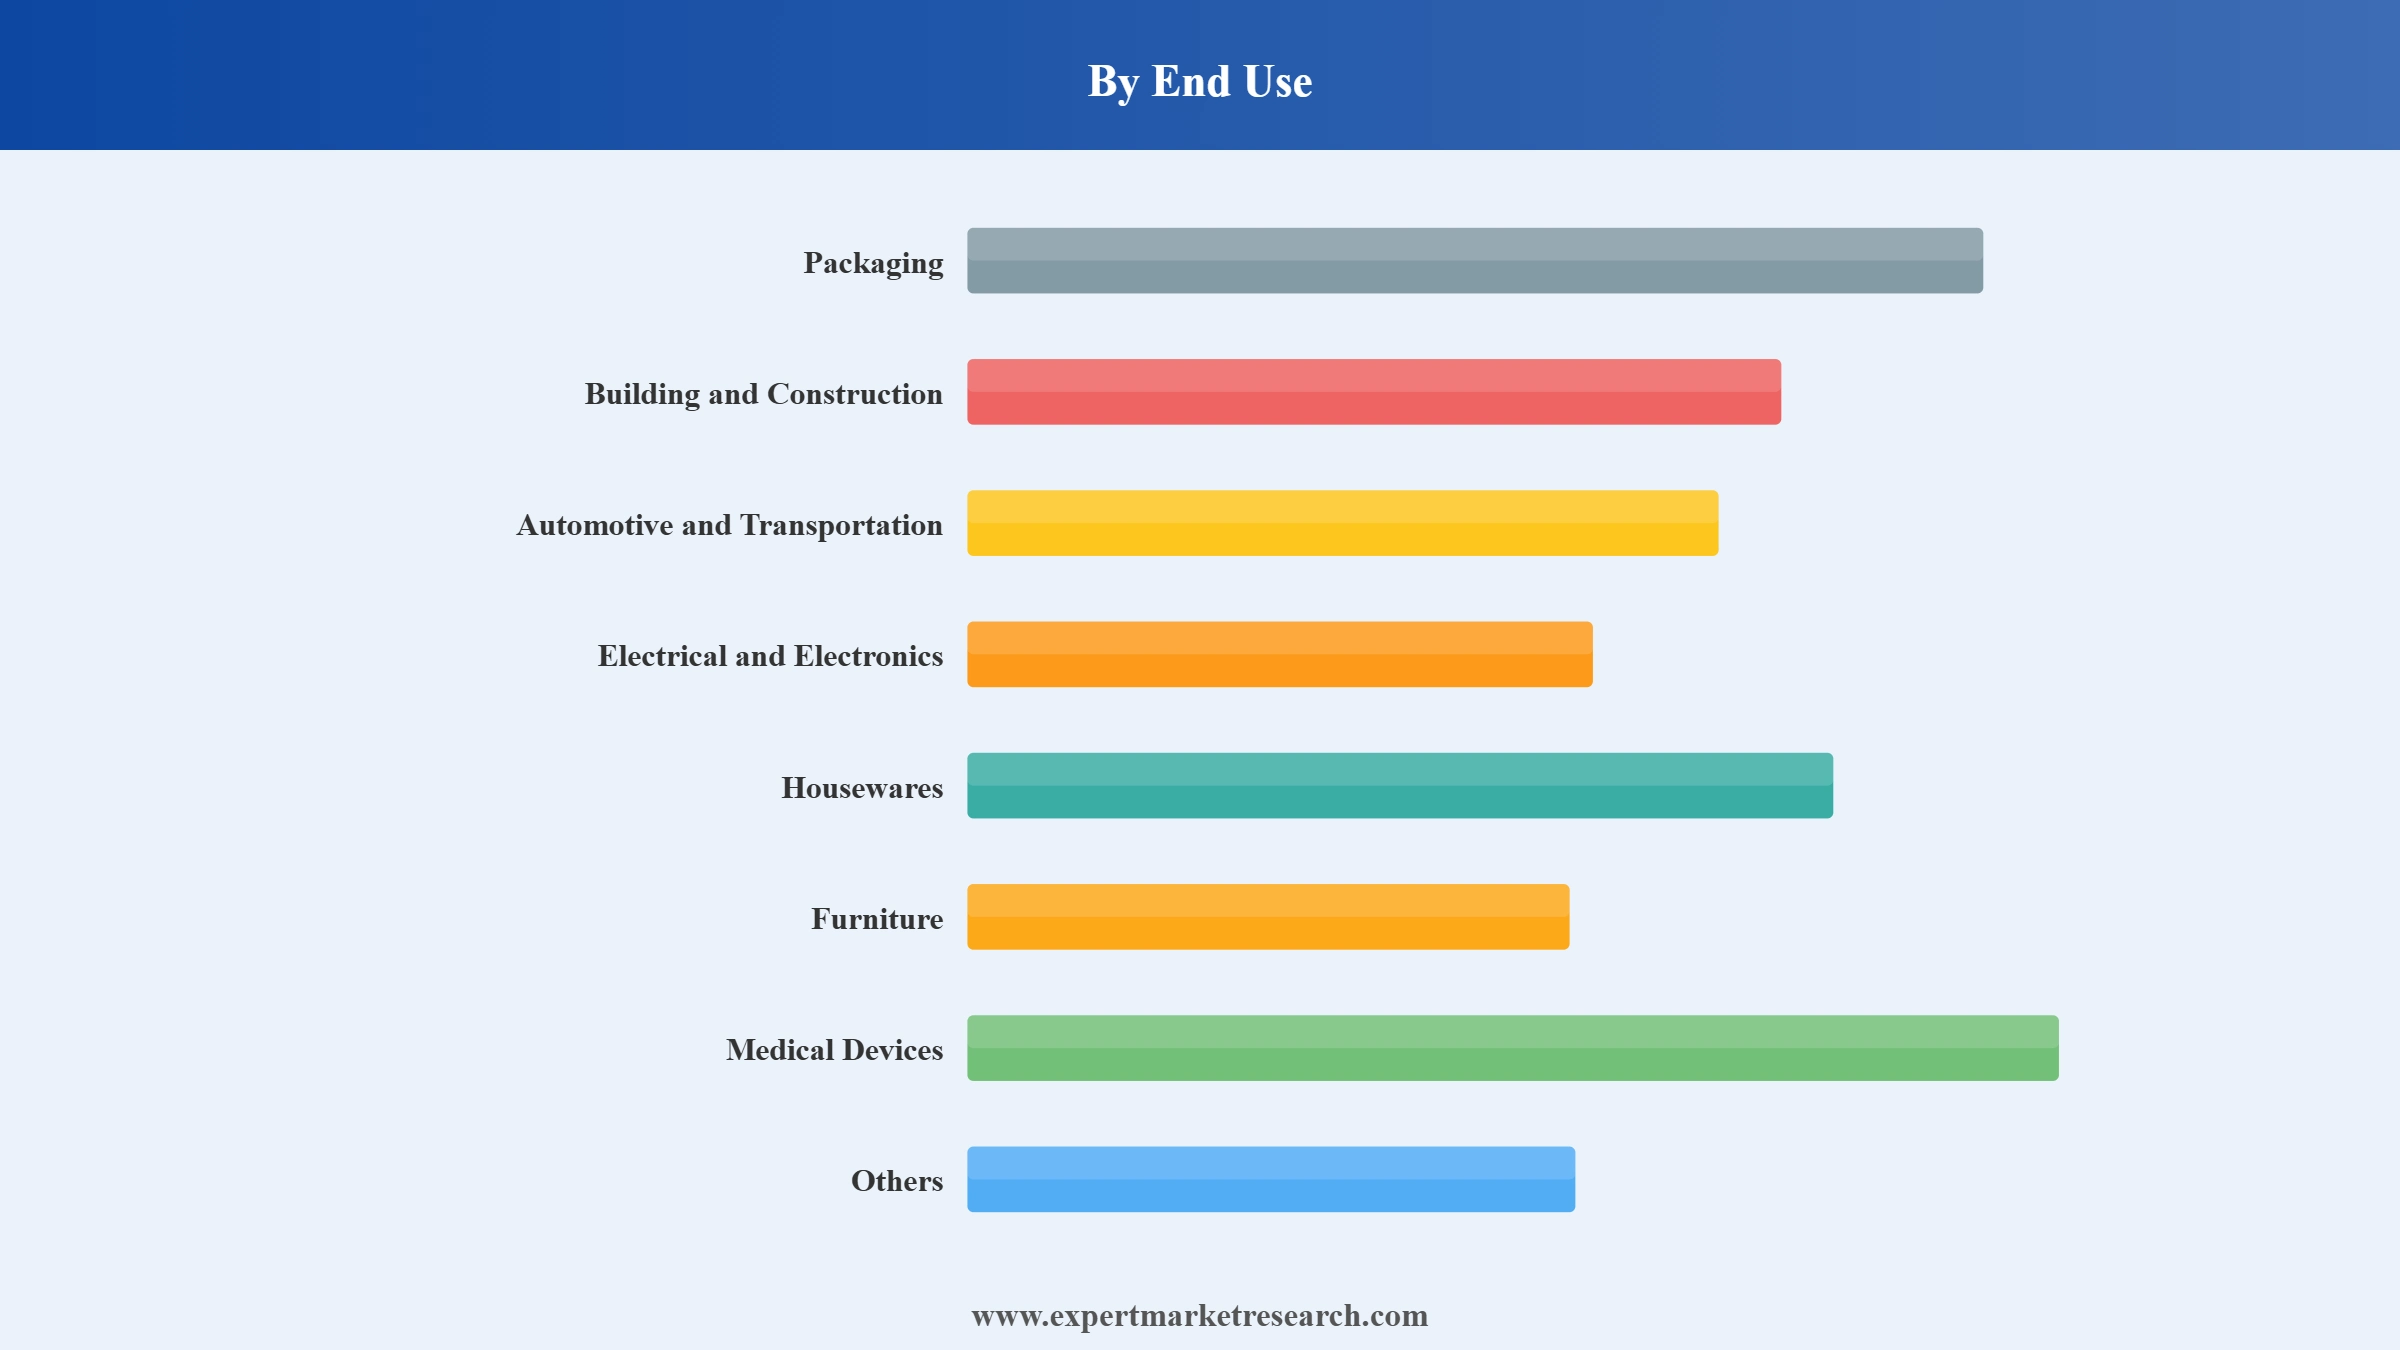
| 2025 Market Share by End Use | Packaging | 47.6% |
The Philippines plastic market is driven by expanding packaging demand, rapid urbanisation and infrastructure investment, growth in electrical and electronics manufacturing, the adoption of recycled plastics under the EPR regulatory framework, and product innovation from domestic and international plastic producers.
The Department of Environment and Natural Resources (DENR) announced at the 2026 EPR Recognition Program on January 30, 2026 that the Philippines surpassed its 2025 plastic waste recovery target under the EPR Act of 2022 (RA 11898). The national plastic diversion rate reached 55.98%, surpassing the mandated 40% recovery target. The EPR Act requires obliged enterprises with at least PHP 100 million in assets to take responsibility for an increasing percentage of their plastic packaging footprint, rising from 20% in 2023 to 80% in 2028. The Philippines is the first ASEAN country to impose mandatory EPR on plastic packaging.
JG Summit Olefins Corporation (JGSOC) announced on January 30-31, 2025 that it had placed its Batangas City petrochemical complex on indefinite commercial shutdown due to persisting unfavorable global petrochemical market conditions. The plant, the Philippines' first and only naphtha cracker producing PE and PP resins, had overall site capacity of over 1 million metric tonnes of petrochemical products per year. The shutdown leaves the Philippines fully reliant on imports for its polyethylene and polypropylene requirements. JG Summit recognised a PHP 114.3 billion impairment loss on its discontinued petrochemical operations in Q4 2025.
JG Summit Holdings' board approved management's plan to pursue various paths to monetise JG Summit Olefins Corporation (JGSOC) in November 2024, including potential full sale, joint venture, or asset preservation. The decision came amid persistent losses from unfavorable global petrochemical market conditions, Chinese overcapacity in PE and PP resins, and close to PHP 100 billion in petrochemical group debt. JG Summit also injected PHP 17.1 billion into JGSOC to cover maturing obligations before announcing the commercial shutdown in January 2025.
JG Summit Olefins Corporation (JGSOC) inaugurated its expanded petrochemical manufacturing complex in Batangas City on January 19, 2024, with President Ferdinand R. Marcos Jr. as guest of honor. The PHP 150 billion (USD 1.3 billion) expansion project completed the final leg of JGSOC's investment programme, bringing overall site capacity to over 1 million metric tonnes of petrochemical products per year. The expanded complex, the Philippines' largest wholly owned petrochemical investment, produces polyethylene, polypropylene, ethylene, propylene, and aromatic compounds.
Packaging is the dominant Philippines plastic end use, driven by the rapid growth of e-commerce, food and beverage production, personal care, and pharmaceutical packaging demand. The Philippines' packaging industry processed approximately 78.5 billion units in 2024, with flexible packaging as the most used pack material. Polyethylene, PET, and PVC are the key plastic materials for packaging. The Philippine EPR Act mandates packaging producers to take responsibility for an increasing share of their plastic packaging footprint.
Injection Moulding is the dominant Philippines plastic application, driving demand for polypropylene, polyethylene, ABS, polycarbonate, and PVC resins across consumer goods, packaging, automotive, electrical and electronics, housewares, and medical device manufacturing. The Philippines' injection moulding industry serves the electronics and semiconductor export sector, which exported USD 49 billion in electronics goods and semiconductors in 2022.
Electrical and Electronics is a growing Philippines plastic end use, driven by the Philippines' position as a key global electronics and semiconductor manufacturing hub. The Philippines' construction sector is expected to grow at 6% per annum over the next 15 years, sustaining demand for PVC, polyethylene, and polystyrene in construction applications including pipes, cables, and insulation.
Medical Devices is the fastest-growing Philippines plastic end use, driven by the expansion of healthcare manufacturing, rising demand for disposable medical products, and pharmaceutical packaging growth under the government's generic medicine programme. The EPR Act targets 80% plastic packaging recovery from 2028, incentivising healthcare packaging producers to invest in recyclable and compliant plastic solutions.
Building and Construction is the second-largest Philippines plastic end use, driven by sustained demand for PVC pipes, polyethylene sheeting, and polystyrene insulation across residential, commercial, and public infrastructure projects. The Philippines’ construction sector is expected to grow at 6% per annum over the next 15 years, supporting consistent demand for PVC water supply pipes, electrical conduit, cable insulation, and plastic structural materials across public works, real estate, and utility infrastructure projects.
The "Philippines Plastic Market Report and Forecast 2026-2035" by Expert Market Research offers detailed analysis across the following segments:
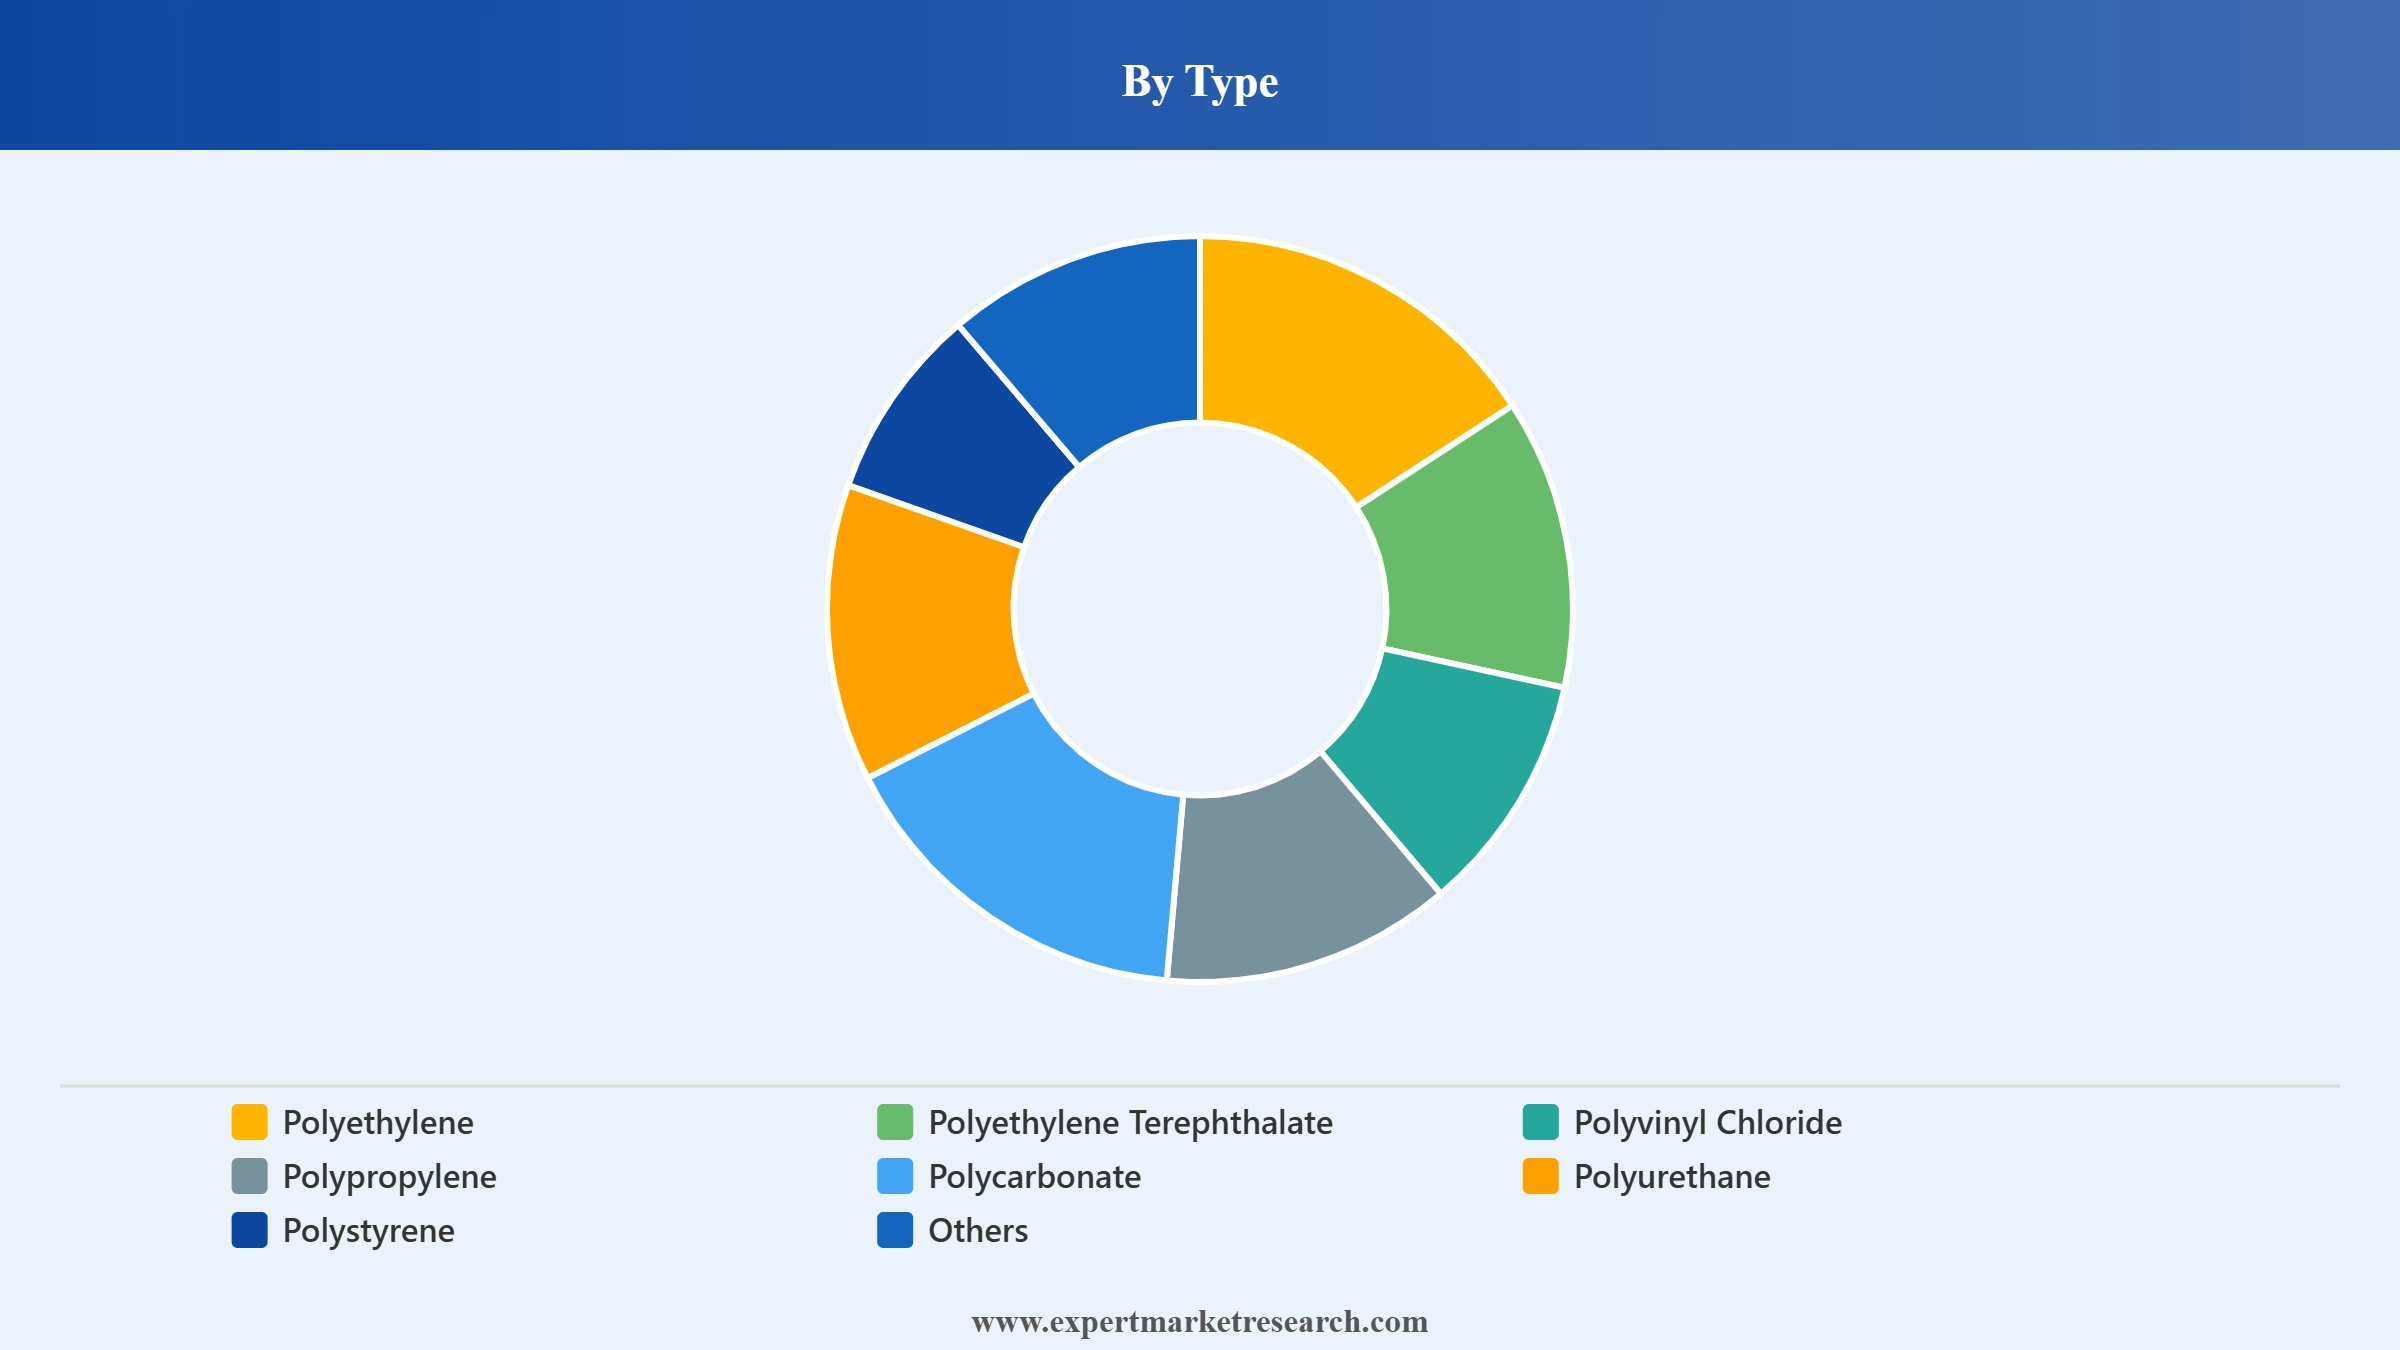
Market Breakup by Type
Key Insight: Polyethylene is the dominant plastic type through packaging and flexible film applications. PET is growing through packaging and beverage bottle demand. PVC is a key type for construction and cable applications.
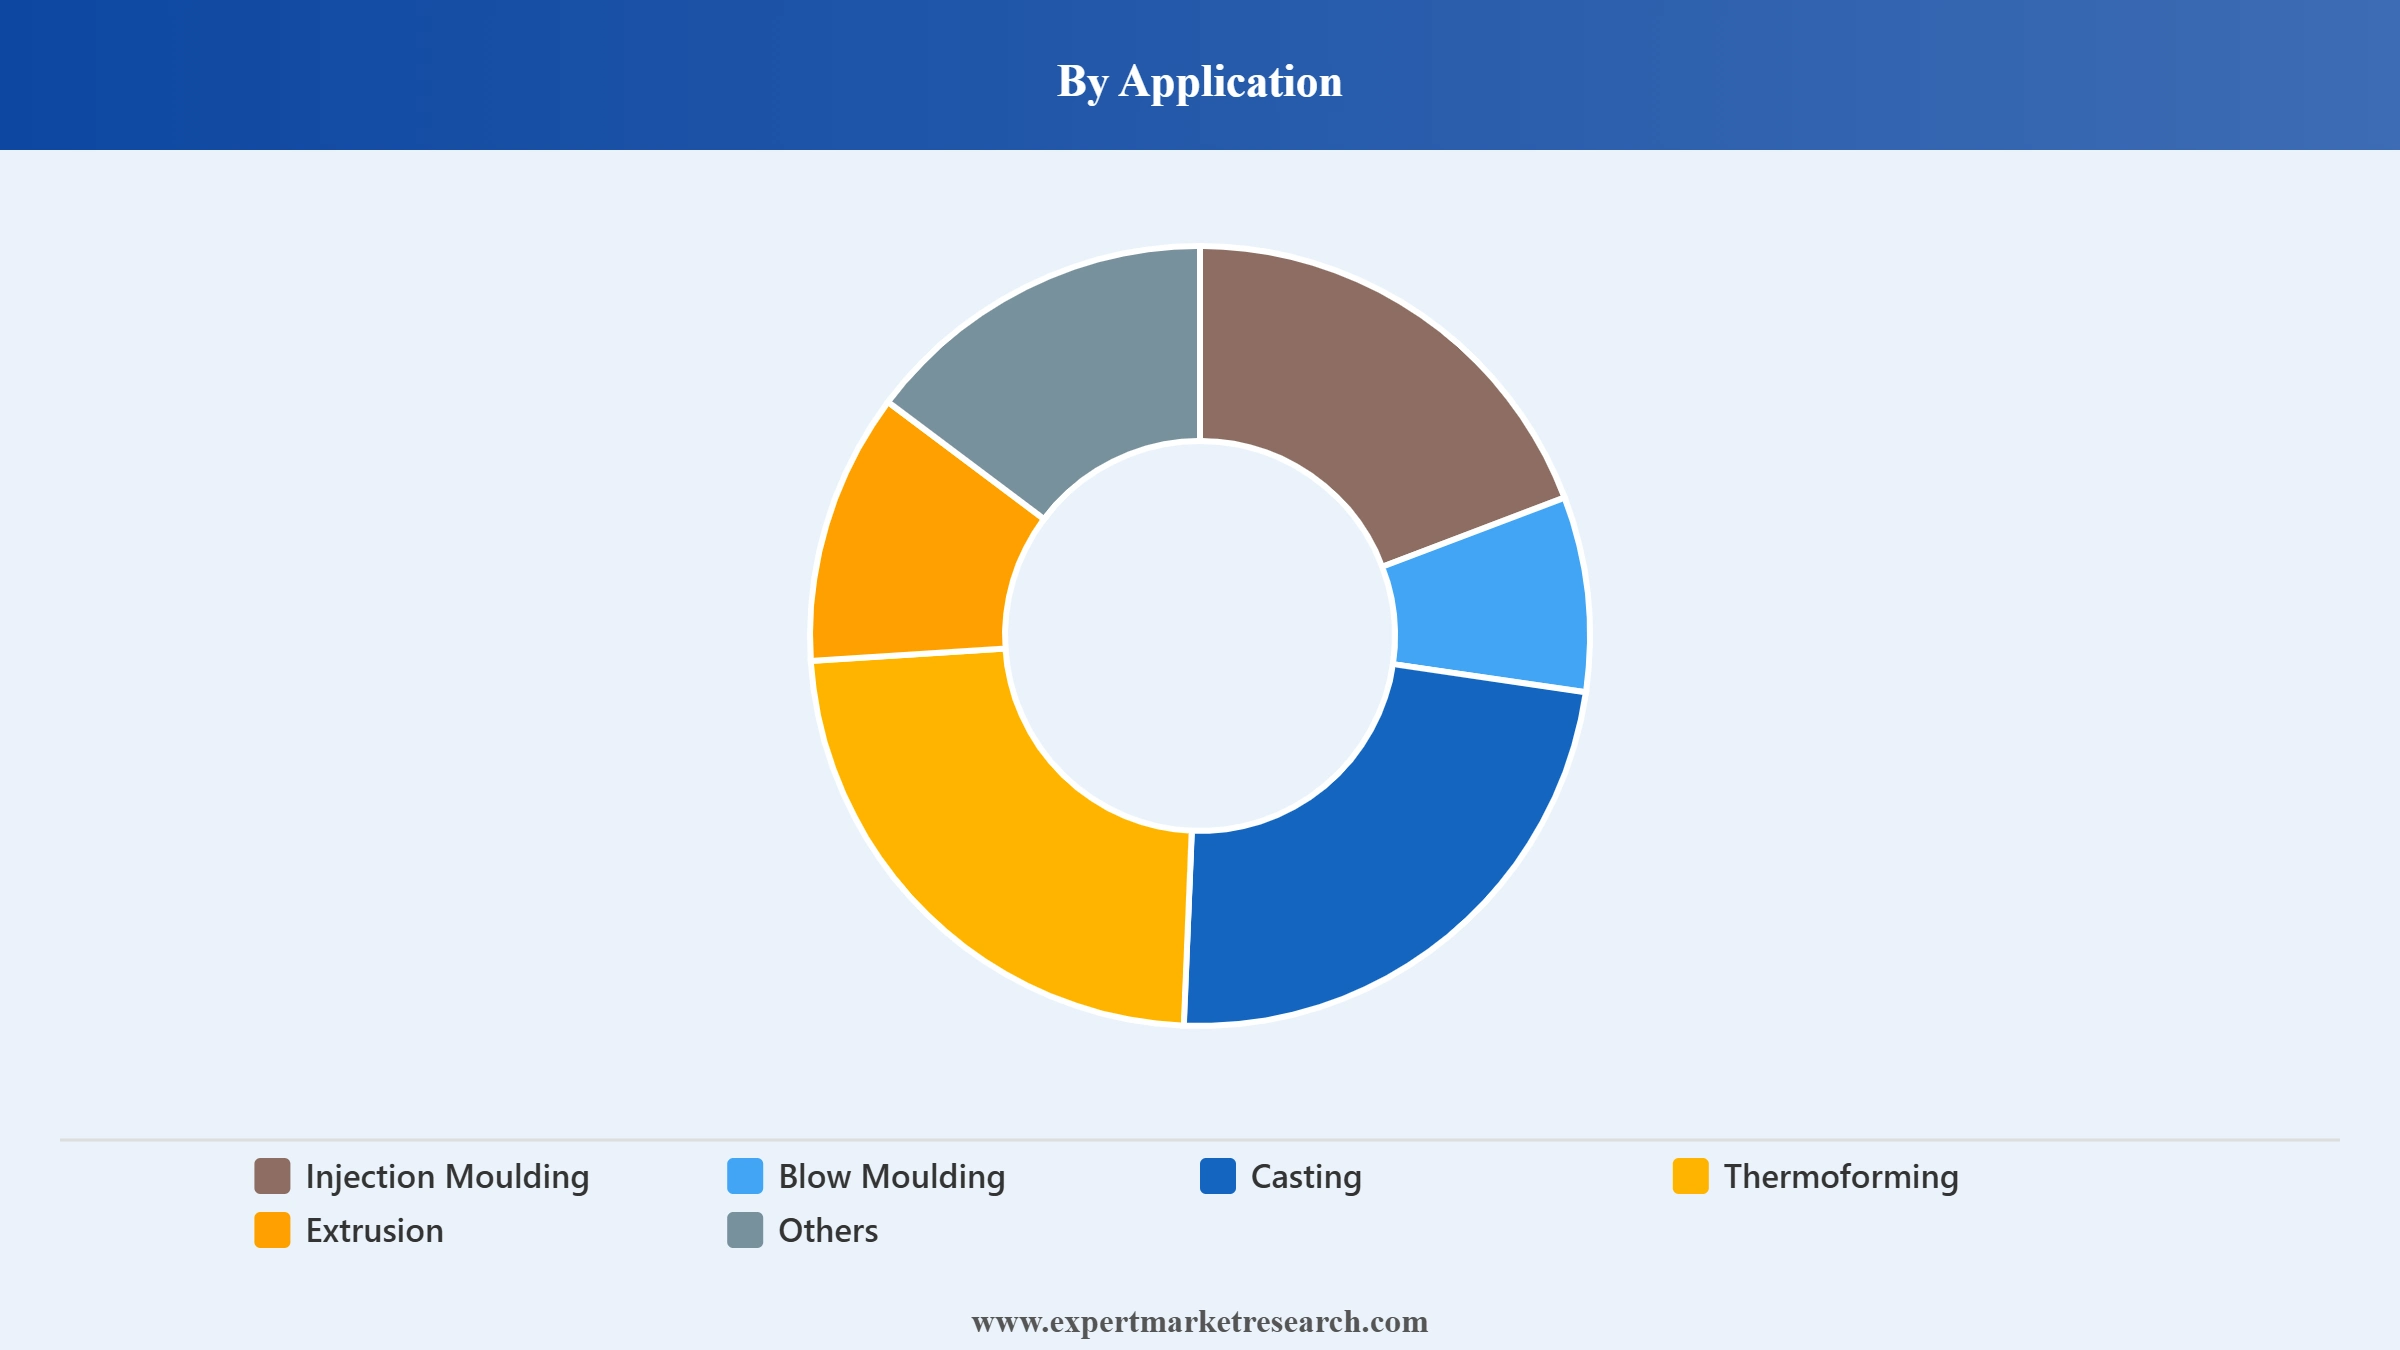
Market Breakup by Application
Key Insight: Injection Moulding is the dominant application through precision component and packaging manufacturing. Extrusion is a key application for film, pipe, and cable plastic processing in the Philippines.
Market Breakup by End Use
Key Insight: Packaging is the largest end use at approximately 7.0% CAGR while Medical Devices is the fastest-growing end use through healthcare manufacturing expansion.
Read more about this report - REQUEST FREE SAMPLE COPY IN PDF
By Type, Polyethylene is the dominant plastic type through packaging and flexible film applications
Polyethylene leads the Philippines plastic market by type, driven by its dominant use in flexible packaging films, rigid packaging containers, agricultural films, and construction applications. Polypropylene is the second-largest type through injection moulding and packaging applications. PET is a growing type through beverage bottle and food packaging demand. PVC serves the construction, cable, and medical device sectors. Polycarbonate, Polyurethane, and Polystyrene serve electrical and electronics, furniture, and insulation sectors.
Read more about this report - REQUEST FREE SAMPLE COPY IN PDF
By Application, Injection Moulding is the dominant application through precision component manufacturing
Injection Moulding commands the largest Philippines plastic market share by application, driven by the Philippines' electronics, consumer goods, automotive, and medical device manufacturing sectors. Blow Moulding serves beverage bottle, container, and packaging demand. Extrusion produces plastic film, pipe, and cable products. Casting serves plastic components requiring complex geometries. Thermoforming serves packaging and food service trays and containers.
Read more about this report - REQUEST FREE SAMPLE COPY IN PDF
By End Use, Packaging is the largest end use while Medical Devices is the fastest-growing segment
Packaging commands the largest Philippines plastic end-use share at approximately 35% of revenue, driven by food and beverage, personal care, pharmaceutical, and e-commerce packaging demand. Building and Construction is the second-largest end use through PVC pipes, cables, and insulation. Electrical and Electronics serves the Philippines' semiconductor and electronics export sector. Medical Devices is the fastest-growing end use. Housewares, Furniture, and Automotive serve domestic and export markets.
Read more about this report - REQUEST FREE SAMPLE COPY IN PDF
The Philippines plastic market is served by international and domestic plastic producers, compounders, and converters competing through product quality, resin formulation capabilities, supply reliability, and EPR sustainability compliance.
Sumitomo Chemical Co. Ltd. is a Japan-based diversified chemical company with a Philippines plastic market presence through its petrochemical and polymer operations. Sumitomo Chemical operates in the Philippines through polymer resin and plastic compound supply, serving the electronics, packaging, and consumer goods sectors. The company leverages its global polymer technology expertise to supply high-performance plastic resins for injection moulding and packaging applications.
DuPont de Nemours Inc. is a US-based science and engineering company with a Philippines plastic market presence through its high-performance polymer and specialty plastic materials. DuPont's engineering plastics serve the Philippines' electronics, semiconductor packaging, automotive, and medical device sectors. The company's global R&D capabilities and specialty plastic formulations support the Philippines' electronics export sector.
JG Summit Holdings, Inc. (through JG Summit Olefins Corporation) was the Philippines' largest petrochemical company and the only producer of polyethylene and polypropylene resins in the country. JGSOC completed a USD 1.3 billion expansion of its Batangas City petrochemical complex in January 2024, bringing site capacity to over 1 million metric tonnes per year. However, due to unfavorable global petrochemical market conditions, JG Summit placed JGSOC on indefinite commercial shutdown in January 2025 and is now evaluating strategic options including a potential sale.
LyondellBasell Industries N.V. is a Netherlands-based global plastics, chemicals, and refining company operating in the Philippines plastic market through its polyolefin and polymer resin supply. LyondellBasell supplies polyethylene and polypropylene resins to Philippines plastic processors across packaging, injection moulding, and industrial applications. The company's global supply chain and product portfolio serve the Philippines' growing packaging and consumer goods manufacturing sectors.
Other key players include NPC Alliance Corporation (NPCA), Petron Corporation, Philippine Resins Industries, Inc., Chemrez Technologies, Inc., and Nan Ya Plastic Corporation, among others.
*Please note that this is only a partial list; the complete list of key players is available in the full report. Additionally, the list of key players can be customized to better suit your needs.*
Our full report for 2026-2035 delivers the market data, competitive intelligence, and strategic analysis to capture the Philippines' growing plastic market. Reach out to our team to access the complete report or request a customised version.
Upto 15% Off
USD
$2499 $2249
$3999 $3599
$4999 $4249
$5999 $5099


*While we strive to always give you current and accurate information, the numbers depicted on the website are indicative and may differ from the actual numbers in the main report. At Expert Market Research, we aim to bring you the latest insights and trends in the market. Using our analyses and forecasts, stakeholders can understand the market dynamics, navigate challenges, and capitalize on opportunities to make data-driven strategic decisions.*
The market reached nearly USD 2052.67 Million in 2025.
The market is projected to grow at a CAGR of 6.40% between 2026 and 2035.
The market is assessed to witness healthy growth in the forecast period to reach around USD 3817.12 Million in 2035.
The different types of plastics in the market are polyethylene, polyethylene terephthalate, polyvinyl chloride, polypropylene, polycarbonate, polyurethane, and polystyrene, among others.
The different applications of plastics are injection moulding, blow moulding, casting, thermoforming, and extrusion, among others.
The different end users of plastics include packaging, building and construction, automotive and transportation, electrical and electronics, housewares, furniture, and medical devices, among others.
The key market players are Sumitomo Chemical Co. Ltd., DuPont de Nemours Inc., JG Summit Holdings, Inc. (JG Summit Olefins Corporation), LyondellBasell Industries N.V., NPC Alliance Corporation (NPCA), Petron Corporation, Philippine Resins Industries, Inc., Chemrez Technologies, Inc., and Nan Ya Plastic Corporation, among others.
Explore our key highlights of the report and gain a concise overview of key findings, trends, and actionable insights that will empower your strategic decisions.
| REPORT FEATURES | DETAILS |
| Base Year | 2025 |
| Historical Period | 2019-2025 |
| Forecast Period | 2026-2035 |
| Scope of the Report |
Historical and Forecast Trends, Industry Drivers and Constraints, Historical and Forecast Market Analysis by Segment:
|
| Breakup by Type |
|
| Breakup by Application |
|
| Breakup by End Use |
|
| Market Dynamics |
|
| Competitive Landscape |
|
| Companies Covered |
|
Datasheet
One User
USD 2,499
USD 2,249
tax inclusive*
Single User License
One User
USD 3,999
USD 3,599
tax inclusive*
Five User License
Five User
USD 4,999
USD 4,249
tax inclusive*
Corporate License
Unlimited Users
USD 5,999
USD 5,099
tax inclusive*
*Please note that the prices mentioned below are starting prices for each bundle type. Kindly contact our team for further details.*
Flash Bundle
Small Business Bundle
Growth Bundle
Enterprise Bundle
*Please note that the prices mentioned below are starting prices for each bundle type. Kindly contact our team for further details.*
Flash Bundle
Number of Reports: 3
20%
tax inclusive*
Small Business Bundle
Number of Reports: 5
25%
tax inclusive*
Growth Bundle
Number of Reports: 8
30%
tax inclusive*
Enterprise Bundle
Number of Reports: 10
35%
tax inclusive*
How To Order

Select License Type
Choose the right license for your needs and access rights.

Click on ‘Buy Now’
Add the report to your cart with one click and proceed to register.

Select Mode of Payment
Choose a payment option for a secure checkout. You will be redirected accordingly.
Strategic Solutions for Informed Decision-Making
Gain insights to stay ahead and seize opportunities.

Get insights & trends for a competitive edge.

Track prices with detailed trend reports.

Analyse trade data for supply chain insights.

Leverage cost reports for smart savings

Enhance supply chain with partnerships.

Connect For More Information
Our expert team of analysts will offer full support and resolve any queries regarding the report, before and after the purchase.
Our expert team of analysts will offer full support and resolve any queries regarding the report, before and after the purchase.
We employ meticulous research methods, blending advanced analytics and expert insights to deliver accurate, actionable industry intelligence, staying ahead of competitors.
Our skilled analysts offer unparalleled competitive advantage with detailed insights on current and emerging markets, ensuring your strategic edge.
We offer an in-depth yet simplified presentation of industry insights and analysis to meet your specific requirements effectively.


