Explore Our Diverse Range Of Offerings
From detailed reports to experts services offered in 15+ Industry Domains
Report
Press Release
Blogs
Industry Statistics
Add 2 More Reports For 20% off

Philippines Power EPC Market Report Overview

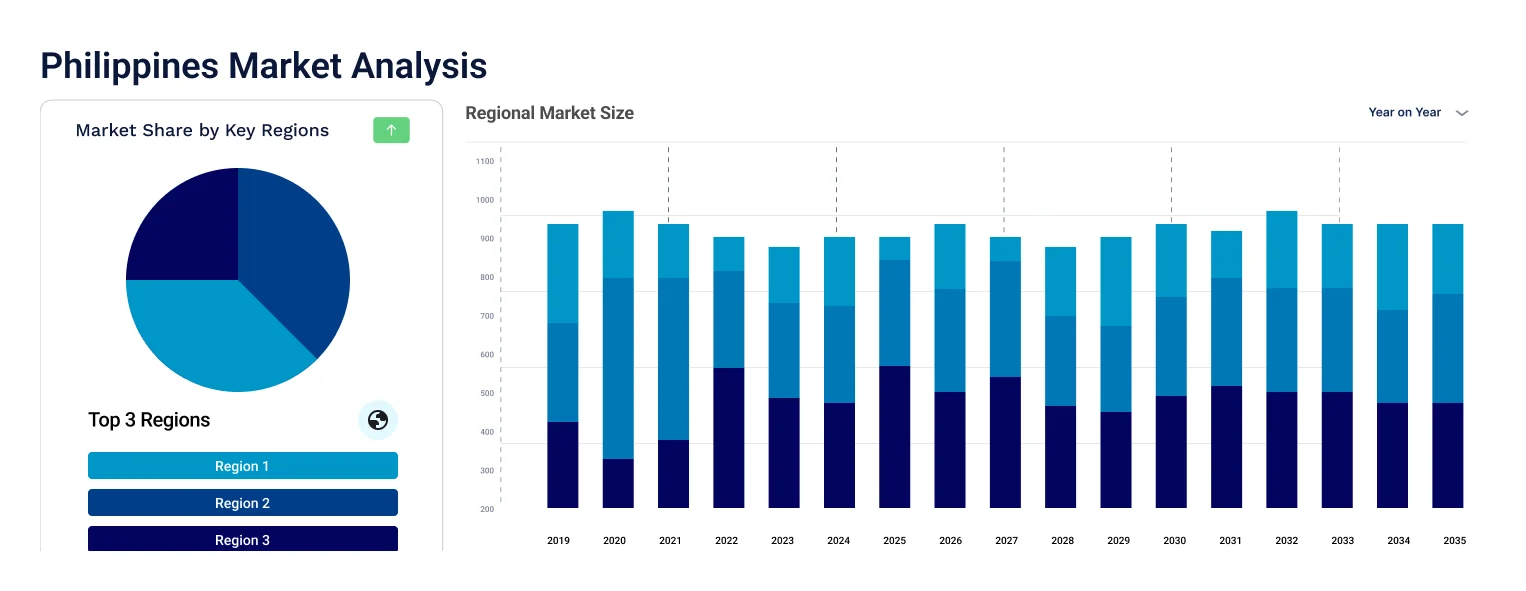
The Philippines power EPC market reached approximately USD 383.57 Million in 2025. The market is projected to grow at a CAGR of 5.90% between 2026 and 2035, reaching a value of around USD 680.46 Million by 2035.

Q1 2026 Market Updates

Geopolitical Impact of Iran, US, and Israel War on the Philippines Power EPC Market

United States: The Philippines Power EPC Market, a key segment of the global economy, is experiencing a complex operating environment in Q1 2026 as a direct consequence of the US-Israel-Iran war. Brent crude has surged past USD 120 per barrel as the Strait of Hormuz, through which 20% of global oil and 19% of LNG transits, has been effectively closed since March 4, 2026. The Ras Tanura refinery strike, which disabled 550,000 bpd of processing capacity, and Qatar's LNG force majeure are creating structural supply disruptions. The conflict is simultaneously the most powerful strategic demand catalyst for renewable energy in decades, as every petroleum-free megawatt directly reduces military vulnerability and fuel import dependence. The conflict is simultaneously driving the strongest-ever strategic demand signal for energy diversification and resilience investment.

Iran: Iran's domestic Philippines Power EPC sector has been effectively suspended by the conflict. US-Israeli strikes on industrial and civilian infrastructure across Tehran, Mashhad, Isfahan, and other major cities have disrupted all commercial activity. Power outages from attacks on electricity generation facilities have halted manufacturing operations, and the collapse of the commercial banking and logistics system has eliminated any residual trade flows. The broader humanitarian crisis, with over 1,900 casualties and 4,000+ civilian buildings damaged, has redirected the entire Iranian economy toward survival rather than production or consumption.

Israel: Israel's Philippines Power EPC sector is experiencing near-term disruption from wartime conditions. Consumer spending on non-essential categories has declined as millions of Israelis regularly shelter from missile and drone alerts. Supply chain logistics are disrupted by regional airspace closures, elevated war-risk insurance premiums, and the suspension of major carrier services through the region. International business partnerships with Israeli companies have been temporarily suspended. Post-conflict reconstruction and recovery demand is expected to provide meaningful demand acceleration across affected market segments once operational conditions normalise.

Key Takeaways

Government

  • Relevant energy regulators should activate strategic petroleum and LNG reserve release programmes as a bridge supply measure while the Strait of Hormuz disruption continues, stabilising industrial and consumer energy costs.
  • Energy ministries should accelerate renewable energy project approvals, recognising that the Ras Tanura strike and Hormuz blockade have provided the most powerful national security case for energy diversification in decades.
  • Governments should establish emergency frameworks for energy cost support to the most exposed industrial users, preventing permanent capacity closures that would compound the economic impact of the conflict.

Market

  • Brent crude above USD 120 per barrel and LNG spot prices elevated by the Qatar force majeure are creating immediate input cost inflation for energy-dependent sectors while simultaneously reinforcing the investment case for all forms of energy diversification.
  • The conflict has provided the most powerful real-world demonstration of the strategic vulnerability of concentrated petroleum-dependent energy systems, permanently elevating the business case for renewable energy, energy efficiency, and grid resilience investment.
  • Near-term project delays from FDI caution are expected to be temporary, with the medium-term investment pipeline for energy infrastructure significantly strengthened by the conflict's strategic impact.

Procurement

  • Energy procurement managers should prioritise long-term supply contract renewals for LNG and petroleum products at current price levels, ahead of further conflict escalation that could push spot prices materially higher.
  • Buyers should advance renewable energy power purchase agreement negotiations, using the current energy price shock as a compelling economic and strategic business case for accelerated clean energy procurement.
  • Procurement teams should build strategic energy reserves where physically and commercially feasible, using the current conflict to establish organisational resilience against future energy supply disruptions.
2025

Base Year

2019-2025

Historical Period

2026-2035

Forecast Period

  • In 2022, the solar capacity in the Philippines grew by 214 MW, bringing the total to 1.53 GW.

  • Energy consumption has seen a steady annual growth rate of 4% since 2020, culminating in a total of 64.5 Mtoe in 2022.

  • The Renewable energy roadmap for 2020-2040 of the nation is targeting a 35% share of renewables in the power mix by 2030, with a further goal of 50% by 2040.

Compound Annual Growth Rate

5.9%

Value in USD Million

2026-2035


*this image is indicative*

Philippines Power EPC Market Report Summary Description Value
Base Year USD Million 2025
Historical Period USD Million 2019-2025
Forecast Period USD Million 2026-2035
Market Size 2025 USD Million 383.57
Market Size 2035 USD Million 680.46
CAGR 2019-2025 Percentage XX%
CAGR 2026-2035 Percentage 5.90%
CAGR 2026-2035 - Market by Type Renewable 6.7%
Market Share by Type Thermal 30.0%

Philippines Power EPC Market Growth

The Department of Energy (DOE) in the Philippines anticipates the commissioning of almost 4.2 GW of new power projects by the end of 2024, which involves a combination of renewable and conventional sources. This includes the commencement of commercial operations for a solar power capacity of nearly 2 GW (1,985 MW) in 2024, as well as the development of two large thermal power plants - the Batangas CCGT power project with a capacity of 1,320 MW (4x440 MW) and the Mariveles coal-fired power project with a capacity of 600 MW (4x150 MW, with unit 1 already operational and the other 3 units undergoing testing and commissioning). Furthermore, around 590 MW of battery energy storage is expected to be commissioned within the year.

The swift expansion of the Philippines' economy and population has led to a significant increase in energy needs. This upsurge in demand has required the enlargement of the power infrastructure, leading to the commencement of several engineering, procurement, and construction (EPC) endeavours.

To meet the objectives outlined in the Renewable Energy Roadmap 2020-2040, which seeks to achieve 35% of renewables in the power mix by 2030 and 50% by 2040 under a Clean Energy Scenario (CES) (35% in a Reference Scenario (REF)), the country will require PHP 25.3bn (US$490m) of green investments for pre-development under the CES scenario and PHP 17.9bn (US$347m) under the REF scenario.

Philippines Power EPC Industry Segmentation

“Philippines Power EPC Market Report and Forecast 2026-2035” offers a detailed analysis of the market based on the following segments:

Market Breakup by Type

  • Thermal
  • Oil and Gas
  • Renewable
  • Nuclear
  • Others
CAGR 2026-2035 - Market by Type
Renewable 6.7%
Nuclear 6.0%
Thermal XX%
Oil and Gas XX%
Others XX%

Philippines Power EPC Market Share

Based on type, the market is segmented into thermal, oil and gas, renewable, and nuclear, among others. The renewable segment is projected to grow at a CAGR of 6.7% during the forecast period of 2026-2035. Renewable energy sources are continuously replenished, ensuring a dependable energy supply. The utilisation of renewable energy greatly diminishes greenhouse gas emissions and pollution in comparison to traditional fossil fuels. This aids in combating climate change and lowering air and water pollution.

Market Share by Type
Thermal 30%
Oil and Gas XX%
Renewable XX%
Nuclear XX%
Others XX%

Leading Companies in the Philippines Power EPC Market

Major players are focusing on the adoption of cutting-edge technologies to gain a competitive edge in the market.

  • First Balfour, Inc.
  • EEI Corporation
  • MERALCO INDUSTRIAL ENGINEERING SERVICES CORPORATION
  • Aboitiz Construction, Inc.
  • D.M. Consunji, Inc.
  • Sta. Clara International Corporation
  • JGC Philippines, Inc.
  • Others

*While we strive to always give you current and accurate information, the numbers depicted on the website are indicative and may differ from the actual numbers in the main report. At Expert Market Research, we aim to bring you the latest insights and trends in the market. Using our analyses and forecasts, stakeholders can understand the market dynamics, navigate challenges, and capitalize on opportunities to make data-driven strategic decisions.*

Looking for specific insights?

Get in touch with us for a customized solution tailored to your unique requirements and save upto 35%!

Key Questions Answered in the Report

In 2025, the market reached an approximate value of USD 383.57 Million.

The market is estimated to grow at a CAGR of 5.90% between 2026 and 2035.

The market is estimated to witness a healthy growth during 2026-2035 to reach around USD 680.46 Million by 2035.

The market is being driven by rapid urbanisation and rising infrastructure development projects.

The key trends aiding the market expansion include the growing adoption of renewable energy and the expansion of grid infrastructure.

The different types of power EPC in the market include thermal, oil and gas, renewable, and nuclear, among others.

The major players in the market are First Balfour, Inc., EEI Corporation, MERALCO INDUSTRIAL ENGINEERING SERVICES CORPORATION, Aboitiz Construction, Inc., D.M. Consunji, Inc., Sta. Clara International Corporation, and JGC Philippines, Inc. among others.

Report Summary

Explore our key highlights of the report and gain a concise overview of key findings, trends, and actionable insights that will empower your strategic decisions.

Key Highlights of the Report

Please note that the figures mentioned in the description serve as estimates and may vary from the actual figures presented in the final report.

REPORT FEATURES DETAILS
Base Year 2025
Historical Period 2019-2025
Forecast Period 2026-2035
Scope of the Report

Historical and Forecast Trends, Industry Drivers and Constraints, Historical and Forecast Market Analysis by Segment:

  • Type
Breakup by Type
  • Thermal
  • Oil and Gas
  • Renewable
  • Nuclear
  • Others
Market Dynamics
  • SWOT Analysis
  • Porter's Five Forces Analysis
  • Key Indicators for Demand
  • Key Indicators for Price
Competitive Landscape
  • Market Structure
  • Company Profiles
    • Company Overview
    • Product Portfolio
    • Demographic Reach and Achievements
    • Certifications
Companies Covered
  • First Balfour, Inc.
  • EEI Corporation
  • MERALCO INDUSTRIAL ENGINEERING SERVICES CORPORATION
  • Aboitiz Construction, Inc.
  • D.M. Consunji, Inc.
  • Sta. Clara International Corporation
  • JGC Philippines, Inc.
  • Others

Single User License

10 % Off

USD

3,999

3,599

Datasheet

10 % Off

USD

2,499

2,249

Five User License

15 % Off

USD

4,999

4,249

Corporate License

15 % Off

USD

5,999

5,099

Single User License

One User

USD 3,999

USD 3,599

tax inclusive*

  • All Segments
  • Printing Restrictions
  • PDF Delivered via Email
  • Custom Report Layout
  • Post Sales Analysts Support
  • Periodic Updates
  • Unlimited Prints

Datasheet

One User

USD 2,499

USD 2,249

tax inclusive*

  • Selected Segments
  • Printing Restrictions
  • Excel Spreadsheet Delivered via Email
  • Full Report
  • Periodic Updates
  • Post Sales Analysts Support
  • Unlimited Prints

Five User License

Five User

USD 4,999

USD 4,249

tax inclusive*

  • All Segments
  • Five Prints Available
  • PDF Delivered via Email
  • Limited Free Customization
  • Post Sales Analyst Support
  • Custom Report Layout
  • Periodic Updates
  • Unlimited Prints

Corporate License

Unlimited Users

USD 5,999

USD 5,099

tax inclusive*

  • All Segments
  • Unlimited Prints Available
  • PDF & Excel Delivery via Email
  • Limited Free Customization
  • Post Sales Analysts Support
  • Discount On Next Update
  • Custom Report Layout

*Please note that the prices mentioned below are starting prices for each bundle type. Kindly contact our team for further details.*

Bundle Type

Flash Bundle

20% OFF Number of Reports: 3

Small Business Bundle

25% OFF Number of Reports: 5

Growth Bundle

30% OFF Number of Reports: 8

Enterprise Bundle

35% OFF Number of Reports: 10
Overview
  • Life Time Access
  • Analyst Support Related to Report
  • PDF Version of the Report
  • Complimentary Excel Data Set
  • Free Analyst Hours
  • Complimentary Free 1 Month Subscription to Trade Data Base
  • Complimentary One Month Subscription to Price Database (Chemicals only)
  • Complimentary PPT Version of the Report
  • Complimentary License Upgrade
  • Complimentary Power BI Dashboards
  • Life Time Access
  • Analyst Support Related to Report
  • PDF Version of the Report
  • Complimentary Excel Data Set
  • Free Analyst Hours - 50 Hours
  • Complimentary Free 1 Month Subscription to Trade Data Base
  • Complimentary One Month Subscription to Price Database (Chemicals only)
  • Complimentary PPT Version of the Report
  • Complimentary License Upgrade
  • Complimentary Power BI Dashboards
  • Life Time Access
  • Analyst Support Related to Report
  • PDF Version of the Report
  • Complimentary Excel Data Set
  • Free Analyst Hours - 80 Hours
  • Complimentary Free 1 Month Subscription to Trade Data Base
  • Complimentary One Month Subscription to Price Database (Chemicals only)
  • Complimentary PPT Version of the Report
  • Complimentary License Upgrade
  • Complimentary Power BI Dashboards
  • Life Time Access
  • Analyst Support Related to Report
  • PDF Version of the Report
  • Complimentary Excel Data Set
  • Free Analyst Hours - 100 Hours
  • Complimentary Free 1 Month Subscription to Trade Data Base
  • Complimentary One Month Subscription to Price Database (Chemicals only)
  • Complimentary PPT Version of the Report
  • Complimentary License Upgrade
  • Complimentary Power BI Dashboards

*Please note that the prices mentioned below are starting prices for each bundle type. Kindly contact our team for further details.*

Flash Bundle

Number of Reports: 3

20%

tax inclusive*

  • 3 Reports Included
  • Life Time Acess
  • Analyst Support Related to Report
  • PDF Version of the Report
  • Free 1 Month Subscription to Trade Data Base
  • 1 Month Subscription to Price Database (Chemicals only)
  • Complimentary Excel Data Set
  • PPT Version of the Report
  • Power BI Dashboards
  • License Upgrade
  • Free Analyst Hours

Small Business Bundle

Number of Reports: 5

25%

tax inclusive*

  • 5 Reports Included
  • Life Time Acess
  • Analyst Support Related to Report
  • PDF Version of the Report
  • Complimentary Excel Data Set
  • Free Analyst Hours - 50 Hours
  • Free 1 Month Subscription to Trade Data Base
  • 1 Month Subscription to Price Database (Chemicals only)
  • Complimentary Excel Data Set
  • PPT Version of the Report
  • Power BI Dashboards
  • License Upgrade

Growth Bundle

Number of Reports: 8

30%

tax inclusive*

  • 8 Reports Included
  • Life Time Acess
  • Analyst Support Related to Report
  • PDF Version of the Report
  • Complimentary Excel Data Set
  • Free Analyst Hours - 50 Hours
  • Free 1 Month Subscription to Trade Data Base
  • 1 Month Subscription to Price Database (Chemicals only)
  • License Upgrade
  • Free Analyst Hours - 80 Hours
  • Power BI Dashboards

Enterprise Bundle

Number of Reports: 10

35%

tax inclusive*

  • 10 Reports Included
  • Life Time Acess
  • Analyst Support Related to Report
  • PDF Version of the Report
  • Complimentary Excel Data Set
  • Free Analyst Hours - 50 Hours
  • Free 1 Month Subscription to Trade Data Base
  • 1 Month Subscription to Price Database (Chemicals only)
  • License Upgrade
  • Power BI Dashboards
  • Free Analyst Hours - 100 Hours

How To Order

This is a collaborative report by Ketan Gandhi and Rakesh Nandi reflecting perspectives and research-driven insights from Expert Market Research.

Our step-by-step guide will help you select, purchase, and access your reports swiftly, ensuring you get the information that drives your decisions, right when you need it.

License Type

Select License Type

Choose the right license for your needs and access rights.

shopping cart

Click on ‘Buy Now’

Add the report to your cart with one click and proceed to register.

Bookmark Icon

Select Mode of Payment

Choose a payment option for a secure checkout. You will be redirected accordingly.

Strategic Solutions for Informed Decision-Making

Connect For More Information

Our expert team of analysts will offer full support and resolve any queries regarding the report, before and after the purchase.

Our expert team of analysts will offer full support and resolve any queries regarding the report, before and after the purchase.

We employ meticulous research methods, blending advanced analytics and expert insights to deliver accurate, actionable industry intelligence, staying ahead of competitors.

Our skilled analysts offer unparalleled competitive advantage with detailed insights on current and emerging markets, ensuring your strategic edge.

We offer an in-depth yet simplified presentation of industry insights and analysis to meet your specific requirements effectively.

We’re here to help answer any questions about our products and services.

Contact us