

Consumer Insights
Uncover trends and behaviors shaping consumer choices today
Procurement Insights
Optimize your sourcing strategy with key market data
Industry Stats
Stay ahead with the latest trends and market analysis.
The Philippines Smartphone Market reached a value of USD 4.17 Billion at 2025 and is projected to expand at a CAGR of around 6.90% during the forecast period of 2026-2035. With internet penetration crossing 76% in 2024, smartphones serving as the primary internet access device for over 90% of Filipino users, 5G rollout driving demand for capable devices at accessible price points, growing digital payment and e-commerce adoption requiring more sophisticated mobile hardware, and government connectivity programs extending digital access to underserved provincial regions, the market is expected to reach USD 8.13 Billion by 2035.
Compound Annual Growth Rate
6.9%
Value in USD Billion
2026-2035
Read more about this report - REQUEST FREE SAMPLE COPY IN PDF
|
Philippines Smartphone Market Report Summary |
Description |
Value |
|
Base Year |
USD Billion |
2025 |
|
Historical period |
USD Billion |
2019-2025 |
|
Forecast Period |
USD Billion |
2026-2035 |
|
Market Size 2025 |
USD Billion |
4.17 |
|
Market Size 2035 |
USD Billion |
8.13 |
|
CAGR 2019-2025 |
Percentage |
XX% |
|
CAGR 2026-2035 |
Percentage |
6.90% |
|
CAGR 2026-2035 - Market by Operating System |
Android |
7.8% |
|
CAGR 2026-2035 - Market by Distribution Channel |
Online Channels |
8.6% |
The growth of the Philippines smartphone market can be attributed to the growing support for internet connectivity, expansion of digital wallets, rising production initiatives and the surge in government investments.
The Philippine government was in advanced stages in March 2025 of finalizing the first tranche of incentives to be offered to Samsung Electronics, which was evaluating a manufacturing investment exceeding PHP 50 billion (approximately USD 870 million) in the Philippines. The package under negotiation reflected the government's broader strategy to attract global electronics and smartphone manufacturers to set up production operations in the country, diversifying the Philippines' role from a smartphone consumer market to a manufacturing hub. A confirmed Samsung manufacturing commitment of this scale would substantially deepen the country's integration into global smartphone supply chains and position the Philippines as a meaningful electronics production base in Southeast Asia alongside existing hubs in Vietnam and Indonesia.
The Philippines' Department of Information and Communications Technology (DICT) and the Department of Trade and Industry (DTI) partnered with the local government of Catarman in March 2025 to launch the DigiPay Initiative, a pilot digital payment system targeting micro, small, and medium enterprises. The initiative is specifically designed to drive smartphone-enabled payment adoption among small business owners and consumers in communities where digital payment infrastructure has historically been underdeveloped. As mobile payment functionality becomes a standard feature requirement for Filipino consumers and MSMEs, programs such as DigiPay directly stimulate smartphone upgrade demand, particularly among first-time digital payment users transitioning from cash to mobile-based transactions.
Xiaomi Corporation launched a new series of 5G-capable smartphones specifically calibrated for the Philippines market in March 2025, timed to align with the acceleration of 5G network coverage by local telecom carriers. The new devices target the growing mid-range consumer segment seeking faster connectivity and richer mobile experiences at accessible price points, a segment that accounts for approximately 42% of total Philippines smartphone unit sales. Xiaomi's deliberate market-fit strategy in the Philippines reflects the brand's broader positioning as a value-first challenger that bridges the gap between entry-level affordability and near-flagship specifications, making it well-suited to the Philippines' price-sensitive but feature-conscious smartphone consumer.
The Philippine government enacted the Konektadong Pinoy Act in August 2025, a landmark piece of legislation designed to improve internet access and foster greater competition among telecom service providers across the country. The law is expected to accelerate the rollout of affordable broadband and 4G/5G connectivity to underserved communities, directly supporting smartphone adoption in secondary cities, provincial towns, and rural areas that have historically lacked affordable high-speed internet access. By lowering the cost and expanding the availability of mobile connectivity, the Konektadong Pinoy Act creates structural conditions for sustained smartphone demand growth beyond Metro Manila and the major urban centers, opening the mass-market provincial consumer base to mid-range device purchases driven by streaming, social media, and digital payment use.
Samsung expanded its manufacturing and distribution activities in the Philippines in February 2025, with a stated focus on increasing production of affordable smartphone models designed to meet local consumer preferences. The expansion was aimed at stabilizing supply chains for the Philippine market and better positioning Samsung products for distribution across both traditional retail and fast-growing online channels. Samsung's commitment to the Philippines market is further reflected in its evaluation of the PHP 50 billion manufacturing incentive package being negotiated with the government, as well as its existing partnership with Versatech International to deliver advanced mobile solutions more broadly across the Philippine consumer and business markets.
The accelerating deployment of 5G infrastructure by Philippine telecom carriers is creating a device refresh cycle as consumers seek smartphones capable of accessing higher-speed networks. The Department of Information and Communications Technology has made 5G coverage expansion a policy priority, and by 2025, 5G-capable chips were becoming a standard requirement for mid-range smartphone imports entering the Philippines. The shift is particularly significant for the mid-range segment, which accounts for approximately 42% of unit sales, as 5G support transitions from a premium-tier differentiator to a mainstream expectation at lower price points. Philippines Smartphone Market growth is meaningfully accelerated by this technical transition, as consumers who might otherwise defer upgrades find compelling technical reasons to move to newer devices. In March 2025, Xiaomi launched a dedicated 5G smartphone series for the Philippines market specifically designed to deliver 5G connectivity at accessible price points.
Android maintains an overwhelming hold on the Philippines smartphone market, with approximately 89% operating system market share in 2025, a position that reflects the enormous price diversity and manufacturer variety that Android's open ecosystem enables. The Philippines is a deeply price-sensitive market where over 60% of all smartphone sales occur at prices below USD 200, a price tier where Android devices have no meaningful competition from iOS. Budget-oriented Android brands including Transsion Holdings (parent of Infinix, TECNO, and itel), Xiaomi, and ASUS deliver feature-rich devices at sub-USD 200 price points that appeal to first-time buyers and cost-conscious upgraders across all regions of the Philippines. By Q3 2025, Transsion commanded approximately 35% of the Philippine smartphone market, demonstrating how value-first positioning can achieve commanding share in a volume-driven emerging market. Samsung remains the dominant branded player across the mid-range segment, leveraging its established retail presence and brand trust.
Smartphones in the Philippines have evolved from aspirational consumer electronics to essential economic infrastructure, serving as the primary device for digital payments, e-commerce participation, mobile banking, and social commerce for the vast majority of Filipino users. The Philippines' e-commerce market is projected to reach USD 24 billion in 2025, growing at approximately 17% annually, a trajectory that is inseparable from smartphone penetration and capability advancement. Digital wallets including GCash and Maya serve tens of millions of active users who depend entirely on smartphone access for financial transactions, bill payments, and fund transfers. This dependency creates structural smartphone demand that is resilient to broader economic cycles, as the digital payment and e-commerce utility of smartphones makes device ownership a practical financial necessity rather than a discretionary lifestyle choice. Government initiatives such as the March 2025 DigiPay pilot are further embedding smartphones in the daily economic lives of Filipinos in provincial communities previously underserved by digital financial services.
Government-led connectivity initiatives are emerging as a structural growth driver for the Philippines smartphone market by extending affordable internet access to communities that have historically lacked the network infrastructure to support meaningful smartphone utility. The August 2025 Konektadong Pinoy Act, alongside the National Broadband Plan and the Free Wi-Fi for All program, is accelerating telecom competition and driving down data plan costs in secondary and tertiary cities. These programs are particularly impactful in regions such as Eastern Visayas, the Bangsamoro Autonomous Region, and remote island communities across Mindanao, where smartphone penetration lags Metro Manila by a significant margin. As reliable and affordable connectivity reaches these areas, smartphone demand is expected to accelerate rapidly, driven by new entrants to e-commerce, social media, online education, and digital payment platforms who require capable mobile devices to participate fully in the Philippine digital economy.
The EMR’s report titled “Philippines Smartphone Market Report and Forecast 2026-2035” offers a detailed analysis of the market based on the following segments:
Breakup by Operating System
Key Insight: Android commands approximately 89% of the Philippines smartphone market by operating system, an overwhelmingly dominant position sustained by the platform's extraordinary price tier diversity, strong local brand ecosystems, and deep integration with Philippine-specific applications for banking, payments, and social media. The Android segment encompasses devices ranging from under PHP 5,000 (approximately USD 85) entry-level phones for first-time buyers to flagship devices exceeding PHP 80,000 (approximately USD 1,370), covering the entire income spectrum of Filipino smartphone consumers. Samsung is the leading Android brand in the mid-range and premium tiers, while Transsion, Xiaomi, ASUS, and Lenovo compete aggressively in the value and mid-range segments. iOS holds the remaining approximately 11% market share, concentrated among higher-income urban consumers in Metro Manila who value Apple's ecosystem integration, brand prestige, and perceived software quality. Apple's Philippines market performance is anchored by regular iPhone refresh cycles and the expanding trade-in and installment purchasing options making flagship devices more financially accessible.
Breakup by Distribution Channel
Key Insight: Specialty stores remain an important distribution channel for premium and mid-range smartphones in the Philippines, providing dedicated brand experiences, certified product authenticity, installment financing options, and post-sale technical support that consumers value particularly for higher-ticket purchases. Authorized brand stores for Samsung, Apple, ASUS, and Sony operate across major shopping malls in Metro Manila and provincial cities. Retail stores, including electronics chains such as Abenson's and Octagon, serve a broad middle market by carrying multiple brands under one roof and offering flexible payment terms. Online Channels are the fastest-growing distribution route, driven by the rapid maturation of Shopee and Lazada as the primary smartphone discovery and purchase platforms for younger and provincial Filipino consumers. By 2025, online channels accounted for a growing proportion of smartphone sales, with value-first brands such as Transsion building their Philippines market share almost entirely through digital storefronts and social commerce on TikTok Shop.
Read more about this report - REQUEST FREE SAMPLE COPY IN PDF
By Operating System
Android maintains an overwhelming market share dominance in the Philippines smartphone market at approximately 89% in 2025, a position that reflects structural market dynamics unlikely to shift significantly through the forecast period. The Android ecosystem's breadth of price tiers, from sub-USD 100 entry-level devices through to premium flagship smartphones, allows it to serve every segment of the Filipino consumer market simultaneously. By Q3 2025, Transsion Holdings commanded approximately 35% of the Philippines smartphone market through its Infinix, TECNO, and itel sub-brands, all operating exclusively on Android and targeting the high-volume sub-USD 200 price tier. Samsung retains the largest individual brand share in the mid-range and premium Android segments. iOS holds approximately 11% market share, largely concentrated among higher-income Metro Manila consumers, with Apple's iPhone refresh cycle and installment financing programs gradually expanding accessibility in the upper-middle income tier.
By Distribution Channel
Specialty stores and retail stores collectively account for the majority of Philippines smartphone sales by value, as the high ticket price of smartphones relative to average Filipino incomes makes in-person product evaluation, brand-certified authenticity, and installment financing access important purchasing considerations. Specialty stores perform particularly strongly in the premium and near-premium segments where brand experience and certified service matter to consumers. Online Channels hold a smaller share by value currently but are growing the fastest, driven by the massive promotional mechanics of Shopee and Lazada, which use flash sales, platform vouchers, and influencer-driven content to move high volumes of value-tier and mid-range devices. By 2025, social commerce via TikTok Shop was emerging as a meaningful secondary online channel particularly effective for value-first brands such as Transsion and Xiaomi seeking to build brand awareness alongside direct sales volume among younger Filipino consumers.
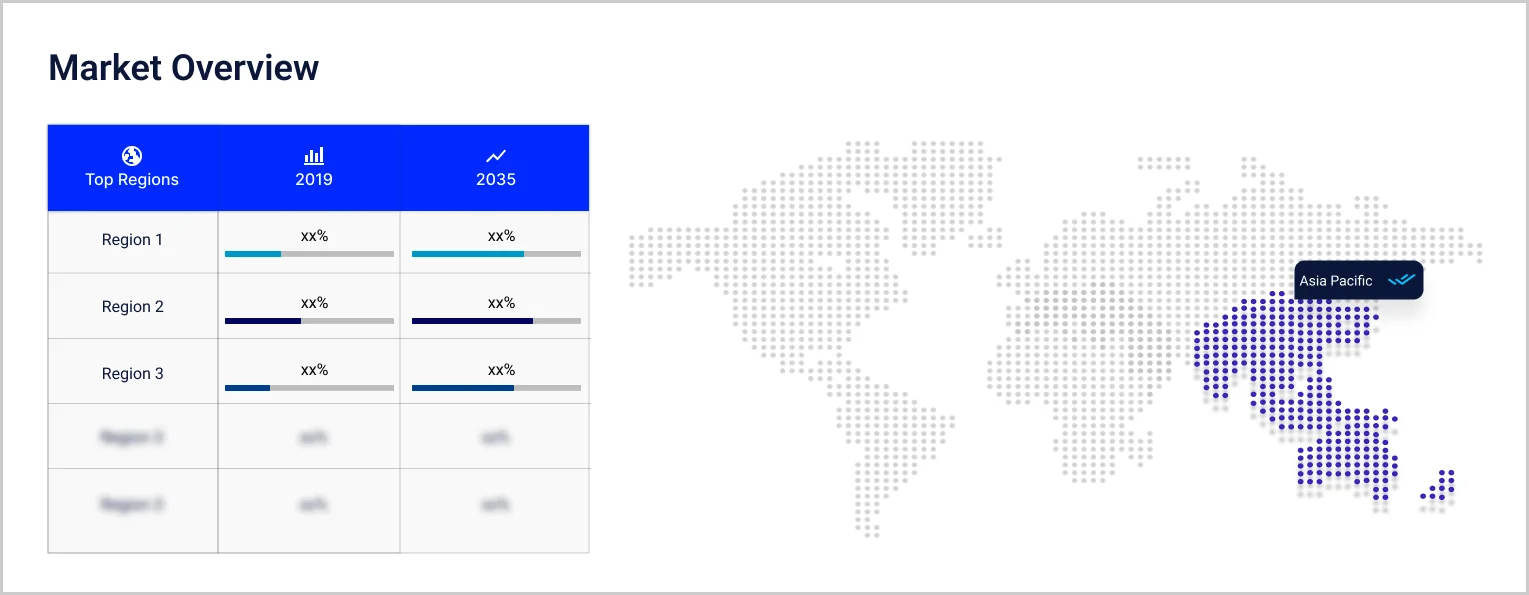
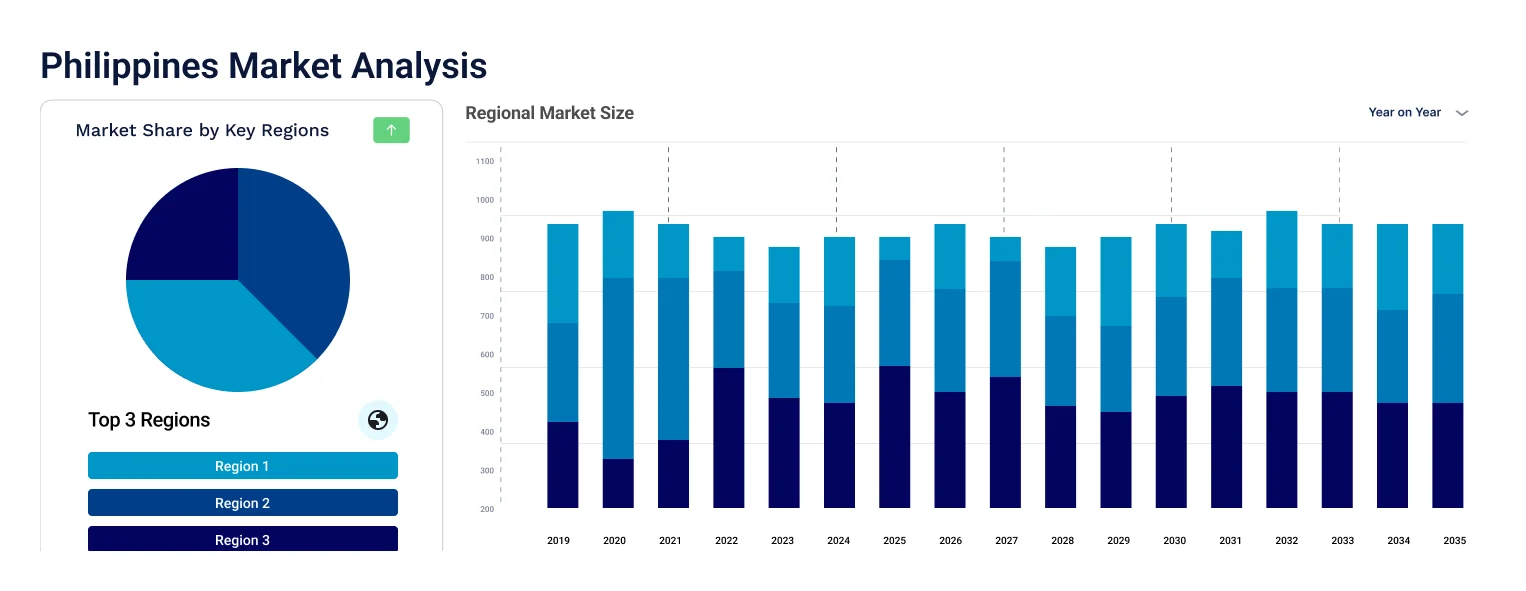
Luzon, and specifically the National Capital Region (Metro Manila), represents the Philippines smartphone market's primary commercial heartland, accounting for approximately 58% of market share in 2025 and serving as the entry point for new device launches, brand flagship stores, and innovative distribution models. Metro Manila's high household income levels relative to the national average, its dense concentration of young urban professionals, and its sophisticated retail infrastructure across major shopping malls in Makati, Bonifacio Global City, and Quezon City create layered demand from entry-level first-time buyers through to high-income Apple and Samsung flagship consumers. All major smartphone brands including Apple, Samsung, Xiaomi, ASUS, and Lenovo prioritize Metro Manila for product launches and brand activations. The expansion of 5G coverage in Metro Manila is accelerating the premium device upgrade cycle, as consumers with existing network access are most motivated by 5G-enabled hardware improvements. Samsung's February 2025 manufacturing and distribution expansion in the Philippines specifically emphasized optimizing supply for Metro Manila retail and online channels.
Visayas and Mindanao together represent the most significant regional growth opportunity for the Philippines smartphone market through the forecast period. Both regions have historically lagged Luzon in smartphone penetration, device mix, and distribution channel sophistication, but structural improvements in connectivity, income growth, and logistics are closing these gaps meaningfully. Cebu City in Visayas and Davao City in Mindanao are emerging as secondary smartphone retail hubs, attracting brand store openings from Samsung and other mid-tier players. Online channels are proving particularly effective in these regions, as e-commerce logistics have improved significantly and digital payment adoption via GCash and Maya has reached meaningful scale among younger consumers in provincial cities. The August 2025 Konektadong Pinoy Act is expected to accelerate smartphone adoption in remote areas of Mindanao and Eastern Visayas by improving the affordability and availability of mobile internet, which is the primary utility driving first-time smartphone purchases in these communities.
The Philippines smartphone market is intensely competitive, featuring a diverse mix of global technology brands, Chinese value-first challengers, and regional players competing across multiple price tiers. Samsung holds the strongest overall brand position in the Philippines, combining mid-range volume leadership with premium flagship presence and the largest authorized retail footprint. Apple commands the premium tier with strong loyalty among affluent Metro Manila consumers. Transsion Holdings has emerged as the market share leader in the high-volume budget and entry-mid segment, commanding approximately 35% of total market share by Q3 2025 through its Infinix, TECNO, and itel brands.
The competitive dynamic is increasingly shaped by the mid-range segment battleground, where brands including Samsung, Xiaomi, ASUS, and Lenovo compete fiercely to deliver the best feature-to-price ratio for the approximately 42% of total unit sales that occur in the mid-range price band. 5G capability is rapidly becoming a differentiator in this segment, with brands launching dedicated 5G models for the Philippines market to capture upgrade demand from consumers on older 4G devices. Online channel competition through Shopee, Lazada, and TikTok Shop is particularly intense, as brands without extensive physical retail networks can compete effectively through platform promotions and influencer-driven marketing. Samsung's possible PHP 50 billion manufacturing investment in the Philippines, if confirmed, would significantly strengthen its local supply chain advantage and position the brand for sustained competitive leadership through the forecast period.
Apple Inc., founded in 1976 and headquartered in Cupertino, California, commands the premium segment of the Philippines smartphone market through its iPhone lineup, which drives disproportionate revenue share relative to its unit volume. Apple's iOS ecosystem, built around services including the App Store, Apple Pay, iMessage, and iCloud, creates strong lock-in effects that sustain loyalty among Philippine consumers who invest in the Apple platform. Despite occupying approximately 11% of the Philippines smartphone market by operating system, Apple's premium pricing ensures its revenue contribution is significantly higher than its unit share implies. Expanding iPhone installment financing programs and trade-in offers through authorized resellers and telecom partners are gradually making Apple devices accessible to a broader upper-middle income segment beyond the traditional affluent Metro Manila buyer.
Samsung Electronics Co., Ltd., founded in 1969 and headquartered in Suwon, South Korea, is the dominant individual brand in the Philippines smartphone market across mid-range and premium segments, combining the largest authorized retail network in the country with a comprehensive product lineup from the entry-level Galaxy A series through to flagship Galaxy S devices. Samsung's February 2025 expansion of manufacturing and distribution activities in the Philippines reinforces its long-term market commitment, and its evaluation of a PHP 50 billion manufacturing investment would cement its position as the most deeply integrated global smartphone brand in the Philippine economy. Samsung's partnership with Versatech International and its collaboration with the government on smartphone affordability and digital inclusion programs further differentiate its market strategy from pure sales-focused competitors.
Xiaomi Corporation, founded in 2010 and headquartered in Beijing, China, has established itself as one of the most commercially impactful smartphone brands in the Philippines mid-range segment, combining aggressive pricing with strong feature specifications that resonate with the value-conscious Filipino consumer. Xiaomi's March 2025 launch of a dedicated 5G smartphone series for the Philippines market demonstrates the brand's commitment to staying ahead of network technology transitions and capturing upgrade demand from consumers moving to 5G. Xiaomi's digital-first distribution approach, combining Shopee and Lazada with its own official brand stores, gives it effective reach across both urban and provincial Filipino consumers without the overhead of a traditional retail network. Its Redmi and Poco sub-brands serve distinct price tiers within the mid-range and budget segments respectively.
ASUSTeK Computer Inc., founded in 1989 and headquartered in Taipei, Taiwan, maintains a distinctive competitive position in the Philippines smartphone market through its ROG Phone (Republic of Gamers) series targeting mobile gaming enthusiasts, alongside its Zenfone lineup for mainstream mid-range consumers. Gaming smartphones are a growing niche in the Philippines, where mobile gaming via titles such as Mobile Legends and PUBG Mobile commands a large and deeply engaged user base. ASUSTeK's ROG Phone premium gaming smartphones offer specifications including high-refresh-rate displays, advanced cooling systems, and extended battery capacity that appeal to Filipino mobile gamers willing to pay near-flagship prices for performance-oriented devices. Asus maintains authorized retailer presence and online channel distribution through Shopee and Lazada to reach both enthusiast and mainstream segments.
Other key players in the market are Alphabet Inc., Nothing Technology Limited, Lenovo Group Ltd., Huawei Technologies Co., Ltd., HTC Corporation, Sony Group Corp., and Others.
*Please note that this is only a partial list; the complete list of key players is available in the full report. Additionally, the list of key players can be customized to better suit your needs.*
Understand the full scope of the Philippines Smartphone Market with our comprehensive 2026 research report. From Android's 89% dominance to the race for mid-range market share among Samsung, Xiaomi, and value-first challengers, from Luzon's leadership to the fast-rising opportunity in Visayas and Mindanao, this report covers every angle that matters for your strategy. Whether you are a device manufacturer, a distributor, an investor, or a retail platform evaluating the Philippines opportunity, download your free sample today and discover the insights that will sharpen your competitive edge in one of Southeast Asia's most dynamic smartphone markets.
Upto 15% Off
USD
$2499 $2249
$3999 $3599
$4999 $4249
$5999 $5099


*While we strive to always give you current and accurate information, the numbers depicted on the website are indicative and may differ from the actual numbers in the main report. At Expert Market Research, we aim to bring you the latest insights and trends in the market. Using our analyses and forecasts, stakeholders can understand the market dynamics, navigate challenges, and capitalize on opportunities to make data-driven strategic decisions.*
In 2025, the Philippines smartphone market reached an approximate value of USD 4.17 Billion.
The market is projected to grow at a CAGR of 6.90% between 2026 and 2035.
The market is estimated to witness healthy growth in the forecast period of 2026-2035 to reach a value of around USD 8.13 Billion by 2035.
The major drivers of the market are the growing government investments, ease of internet access, and the growth of young population.
The key trends of the market include the expansion of local manufacturing, influx of streaming services and rising imports.
The various operating systems considered in the market report are android and iOS and others.
The distribution channels considered in the market report are specialty stores, retail stores, online channels, and others.
The major players in the market are Apple Inc., Alphabet Inc., Samsung Electronics Co., Ltd., Xiaomi Corporation, Nothing Technology Limited, ASUSTeK Computer Inc., Lenovo Group Ltd., Huawei Technologies Co., Ltd., HTC Corporation, Sony Group Corp., and others.
Explore our key highlights of the report and gain a concise overview of key findings, trends, and actionable insights that will empower your strategic decisions.
| REPORT FEATURES | DETAILS |
| Base Year | 2025 |
| Historical Period | 2019-2025 |
| Forecast Period | 2026-2035 |
| Scope of the Report |
Historical and Forecast Trends, Industry Drivers and Constraints, Historical and Forecast Market Analysis by Segment:
|
| Breakup by Operating System |
|
| Breakup by Distribution Channel |
|
| Market Dynamics |
|
| Competitive Landscape |
|
| Companies Covered |
|
Datasheet
One User
USD 2,499
USD 2,249
tax inclusive*
Single User License
One User
USD 3,999
USD 3,599
tax inclusive*
Five User License
Five User
USD 4,999
USD 4,249
tax inclusive*
Corporate License
Unlimited Users
USD 5,999
USD 5,099
tax inclusive*
*Please note that the prices mentioned below are starting prices for each bundle type. Kindly contact our team for further details.*
Flash Bundle
Small Business Bundle
Growth Bundle
Enterprise Bundle
*Please note that the prices mentioned below are starting prices for each bundle type. Kindly contact our team for further details.*
Flash Bundle
Number of Reports: 3
20%
tax inclusive*
Small Business Bundle
Number of Reports: 5
25%
tax inclusive*
Growth Bundle
Number of Reports: 8
30%
tax inclusive*
Enterprise Bundle
Number of Reports: 10
35%
tax inclusive*
How To Order

Select License Type
Choose the right license for your needs and access rights.

Click on ‘Buy Now’
Add the report to your cart with one click and proceed to register.

Select Mode of Payment
Choose a payment option for a secure checkout. You will be redirected accordingly.
Strategic Solutions for Informed Decision-Making
Gain insights to stay ahead and seize opportunities.

Get insights & trends for a competitive edge.

Track prices with detailed trend reports.

Analyse trade data for supply chain insights.

Leverage cost reports for smart savings

Enhance supply chain with partnerships.

Connect For More Information
Our expert team of analysts will offer full support and resolve any queries regarding the report, before and after the purchase.
Our expert team of analysts will offer full support and resolve any queries regarding the report, before and after the purchase.
We employ meticulous research methods, blending advanced analytics and expert insights to deliver accurate, actionable industry intelligence, staying ahead of competitors.
Our skilled analysts offer unparalleled competitive advantage with detailed insights on current and emerging markets, ensuring your strategic edge.
We offer an in-depth yet simplified presentation of industry insights and analysis to meet your specific requirements effectively.


