

Consumer Insights
Uncover trends and behaviors shaping consumer choices today
Procurement Insights
Optimize your sourcing strategy with key market data
Industry Stats
Stay ahead with the latest trends and market analysis.
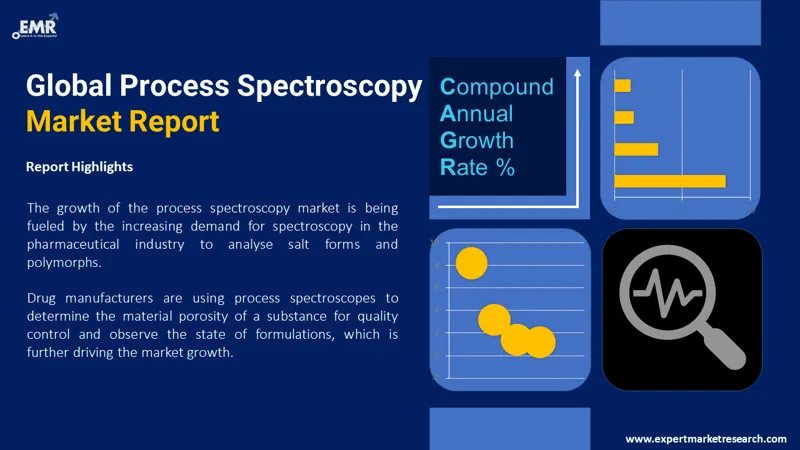
The global process spectroscopy market size reached a value of approximately USD 25.69 Billion in 2025. The market is further expected to grow at a CAGR of 7.10% in the forecast period of 2026-2035, reaching a value of USD 51.01 Billion by 2035.
Compound Annual Growth Rate
7.1%
Value in USD Billion
2026-2035
Process spectroscopy is a technique that is used for analysis of interactions between matter, light, and electromagnetic radiations. It uses devices such as hyphenated and portable spectroscopes, display units and microscopes, amplifiers, and signal processors, among others. It is widely used in different fields of research and industries including food and agriculture, and pharmaceuticals.
Read more about this report - REQUEST FREE SAMPLE COPY IN PDF
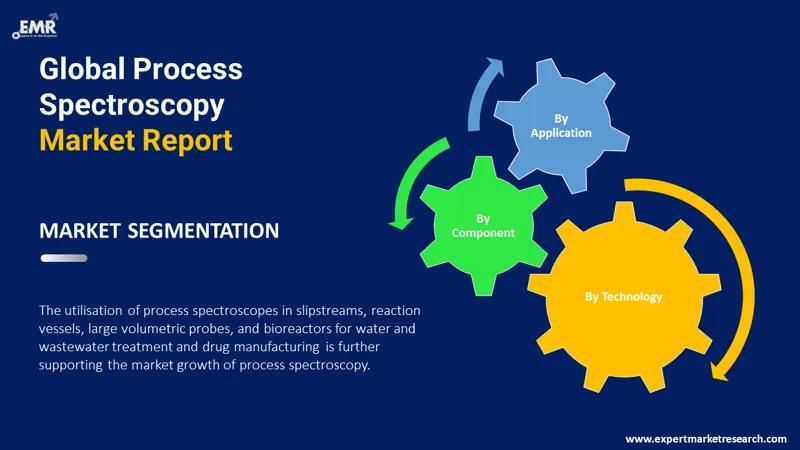
The EMR’s report titled “Process Spectroscopy Market Report and Forecast 2026-2035" offers a detailed analysis of the market based on the following segments:
Market Breakup by Technology
Market Breakup by Component
Market Breakup by Application
Market Breakup by Region
Read more about this report - REQUEST FREE SAMPLE COPY IN PDF
Molecular spectroscopy, based on technology, is projected to witness significant growth in the process spectroscopy market in the upcoming years. This technology is used for investigating the electronic configuration of atoms in excited and ground state and for determining the chemical composition of unknown materials. Rising demand from chemical and petrochemical industries, among other industries is fuelling the usage of molecular spectroscopy.
Applications of molecular spectroscopy can also be found in food and beverage and polymer industries for qualitative and quantitative analysis and in nanomaterials and microplastics. In pharmaceutical industry, molecular spectroscopy is used for ensuring tablet content uniformity, and moisture and stability of lyophilised materials, among others.


North America is anticipated to occupy a sizable share of the process spectroscopy market over the forecast period. This is due to the presence of stringent regulations of governments in the region to ensure the quality of manufactured products. Furthermore, the expansion of the market is boosted by the adoption of advanced process monitoring systems by various manufacturing industries.
Meanwhile, the market for process spectroscopy in the Asia Pacific is anticipated to witness considerable growth due to rapid adoption of new technologies and innovations in the field of process spectroscopy. Growing availability of skilled workforce and rising research and development activities are further projected to aid the market expansion in the Asia Pacific region.
The comprehensive EMR report provides an in-depth assessment of the market based on the Porter's five forces model along with giving a SWOT analysis. The report gives a detailed analysis of the following key players in the process spectroscopy market, covering their competitive landscape and latest developments like mergers, acquisitions, investments, and expansion plans.
Bruker Corporation is a scientific equipment manufacturing company that was established in 1960 and is headquartered in Massachusetts, United States. They are known for offering high value diagnostic and analytical solutions and high-performance scientific instruments. They cover a broad spectrum of applications in the field of research and development and ensure process reliability and quality in various industrial production processes.
Sartorius AG is a biotechnology research company that was founded in 1870 and is based in Lower Saxony, Germany. They are industry leaders and one of the fastest growing global life science companies that is devoted towards simplifying medical processes and the production of new medications. They offer a wide range of consumables and instruments for biopharmaceutical laboratories and industries, among others.
Shimadzu Corporation is a biotechnology research company that was established in 1875 and is headquartered in Kyoto, Japan. Shimadzu specialises in analytical and measuring instruments, thermal analysis and molecular spectroscopy, optical devices, life science lab instruments, optical devices, hydraulic equipment, material testing, industrial machinery, and non-destructive testing systems, among others. Their products and services are aimed towards advancing human health and increasing the safety and security of industrial processes.
*Please note that this is only a partial list; the complete list of key players is available in the full report. Additionally, the list of key players can be customized to better suit your needs.*
Other market players include BÜCHI Labortechnik AG, Agilent Technologies, Inc., and tec5USA Inc., among others.
Upto 15% Off
USD
$2499 $2249
$3999 $3599
$4999 $4249
$5999 $5099


*While we strive to always give you current and accurate information, the numbers depicted on the website are indicative and may differ from the actual numbers in the main report. At Expert Market Research, we aim to bring you the latest insights and trends in the market. Using our analyses and forecasts, stakeholders can understand the market dynamics, navigate challenges, and capitalize on opportunities to make data-driven strategic decisions.*
The market size reached a value of approximately USD 25.69 Billion in 2025.
The market is expected to grow at a CAGR of 7.10% between 2026 and 2035.
The market is estimated to witness a healthy growth in the forecast period of 2026-2035 to reach USD 51.01 Billion by 2035.
The major market drivers include rising adoption of process spectroscopes by drug manufacturers and growing requirements for wastewater treatment.
The key trends fuelling the growth of the market include innovations and technological advancements in process spectroscopes, rising research and development activities, and booming pharmaceutical industry.
The major regions in the market are North America, Europe, the Asia Pacific, Latin America, and the Middle East and Africa.
The significant components of process spectroscopy are hardware and software.
The various applications of process spectroscopy in the market include oil and gas, polymer, metal and mining, water and wastewater, pulp and paper, pharmaceuticals, food and agriculture, and chemicals, among others.
The key market players, according to the process spectroscopy market report, are Bruker Corporation, BÜCHI Labortechnik AG, Sartorius AG, Shimadzu Corporation, Agilent Technologies, Inc., and tec5USA Inc., among others.
Explore our key highlights of the report and gain a concise overview of key findings, trends, and actionable insights that will empower your strategic decisions.
| REPORT FEATURES | DETAILS |
| Base Year | 2025 |
| Historical Period | 2019-2025 |
| Forecast Period | 2026-2035 |
| Scope of the Report |
Historical and Forecast Trends, Industry Drivers and Constraints, Historical and Forecast Market Analysis by Segment:
|
| Breakup by Technology |
|
| Breakup by Component |
|
| Breakup by Application |
|
| Breakup by Region |
|
| Market Dynamics |
|
| Competitive Landscape |
|
| Companies Covered |
|
| Report Price and Purchase Option | Explore our purchase options that are best suited to your resources and industry needs. |
| Delivery Format | Delivered as an attached PDF and Excel through email, with an option of receiving an editable PPT, according to the purchase option. |
Datasheet
One User
USD 2,499
USD 2,249
tax inclusive*
Single User License
One User
USD 3,999
USD 3,599
tax inclusive*
Five User License
Five User
USD 4,999
USD 4,249
tax inclusive*
Corporate License
Unlimited Users
USD 5,999
USD 5,099
tax inclusive*
*Please note that the prices mentioned below are starting prices for each bundle type. Kindly contact our team for further details.*
Flash Bundle
Small Business Bundle
Growth Bundle
Enterprise Bundle
*Please note that the prices mentioned below are starting prices for each bundle type. Kindly contact our team for further details.*
Flash Bundle
Number of Reports: 3
20%
tax inclusive*
Small Business Bundle
Number of Reports: 5
25%
tax inclusive*
Growth Bundle
Number of Reports: 8
30%
tax inclusive*
Enterprise Bundle
Number of Reports: 10
35%
tax inclusive*
How To Order

Select License Type
Choose the right license for your needs and access rights.

Click on ‘Buy Now’
Add the report to your cart with one click and proceed to register.

Select Mode of Payment
Choose a payment option for a secure checkout. You will be redirected accordingly.
Strategic Solutions for Informed Decision-Making
Gain insights to stay ahead and seize opportunities.

Get insights & trends for a competitive edge.

Track prices with detailed trend reports.

Analyse trade data for supply chain insights.

Leverage cost reports for smart savings

Enhance supply chain with partnerships.

Connect For More Information
Our expert team of analysts will offer full support and resolve any queries regarding the report, before and after the purchase.
Our expert team of analysts will offer full support and resolve any queries regarding the report, before and after the purchase.
We employ meticulous research methods, blending advanced analytics and expert insights to deliver accurate, actionable industry intelligence, staying ahead of competitors.
Our skilled analysts offer unparalleled competitive advantage with detailed insights on current and emerging markets, ensuring your strategic edge.
We offer an in-depth yet simplified presentation of industry insights and analysis to meet your specific requirements effectively.


