

Consumer Insights
Uncover trends and behaviors shaping consumer choices today
Procurement Insights
Optimize your sourcing strategy with key market data
Industry Stats
Stay ahead with the latest trends and market analysis.
The global quick service restaurants market size was valued at USD 498.88 Billion in 2025. The industry is expected to grow at a CAGR of 3.70% during the forecast period of 2026-2035 to reach a value of USD 717.44 Billion by 2035. The market growth is fueled by the industry player’s efforts in integrating their international expansion strategies with solid local partnerships and master franchise agreements.
With ongoing competition in saturated markets, brands are opting to focus more and more on regions with high growth potential like Latin America and Asia. In these regions, local partners can provide operational expertise, regulatory familiarity, and supply chain trustworthiness. Through this method, QSR companies are growing in a step, by, step manner and at the same time, they can customize their menus, store formats, and pricing according to regional consumer preferences.
One prime example of such a strategy was when Chipotle Mexican Grill signed a development agreement with Alsea in April 2025 to open their first stores in Mexico, thus, making a strategic move into a culturally matching but less penetrated market for the brand. Moreover, in September 2025, Chipotle disclosed its first venture in Asia through a joint venture with SPC Group, aiming at South Korea and Singapore, thus, providing further evidence to the driver. Such partnership led expansion models are becoming the core of sustained global quick service restaurants market growth.
Compound Annual Growth Rate
3.7%
Value in USD Billion
2026-2035
Read more about this report - REQUEST FREE SAMPLE COPY IN PDF
Burger King launched a nationwide hiring search to add up to 60,000 team members across nearly 6,500 U.S. restaurants. The company said the hiring push covers entry-level and management roles and follows restaurant modernization and operational improvement efforts.
McDonald’s and Netflix announced two KPop Demon Hunters-inspired adult meals, scheduled to launch at participating U.S. restaurants on March 31. The campaign included exclusive photocards and first-access content linked to the film.
Restaurant Brands International reaffirmed its 2024–2028 growth algorithm at its 2026 Investor Day, including 8%+ organic adjusted operating income growth and 5%+ net restaurant growth by 2028. The company also announced plans to return over USD 1.6 billion of capital in 2026.
Burger King launched the Ultimate Steakhouse Whopper, a guest-inspired product from its Whopper by You platform, at U.S. menus on January 6. The company said the platform had received more than 600,000 submissions to date.
QSR brands are experimenting with hybrid brands to maximize reach. The idea of bringing two brands within one operating unit will allow the operator to better manage real estate, improve revenue per unit, and cater to different consumers. A case example in point is Dine Brands International’s expansion into Costa Rica and Mexico in March 2025 of dual-branded Applebee’s + IHOP in non-traditional locations such as travel centers and airports in Mexico and Costa Rica.
Franchising facilitates quick expansion of QSR chains by leveraging the local operator’s understanding of the local market with a share in the risk of operation. In March 2025, GoTo Foods made an announcement about inking 1,177 new franchises in 2024. This is in line with the continued expansion through franchises in both traditional and non-traditional outlets.
Extending the restaurant footprint via the opening of new outlets enables QSR companies to seize a larger market share. This expansion tactic increases the overall visibility of the restaurant chains by benefiting from economies of scale. For example, Dine Brands Global Inc. announced the opening of 17 new Applebee’s and IHOP restaurants in the third quarter of 2025.
The QSR chains adjust their offering according to preferences and trends in each region through novel product development and diversification of menus. This helps in attracting new clients and encouraging regular visits from existing ones. In 2024, Tropical Smoothie Cafe launched its Tropinc Bowl series, thereby adding new occasions to mealtimes through novel development in its menu, which goes beyond smoothies.
Increasing disposable income and urbanization in the emerging market have driven the QSR dining trend. The QSR companies have benefited from the trend by adopting specific store designs to cater to a local marketplace. For instance, the Chipotle restaurant chain entered the Mexico marketplace in April 2025 through Alsea and has outlined the operation strategy in South Korea and Singapore in September 2025 to enter the market jointly with SPC Group.
Read more about this report - REQUEST FREE SAMPLE COPY IN PDF
The Expert Market Research's report titled “Global Quick Service Restaurants Market Report and Forecast 2026-2035” offers a detailed analysis of the market based on the following segments:
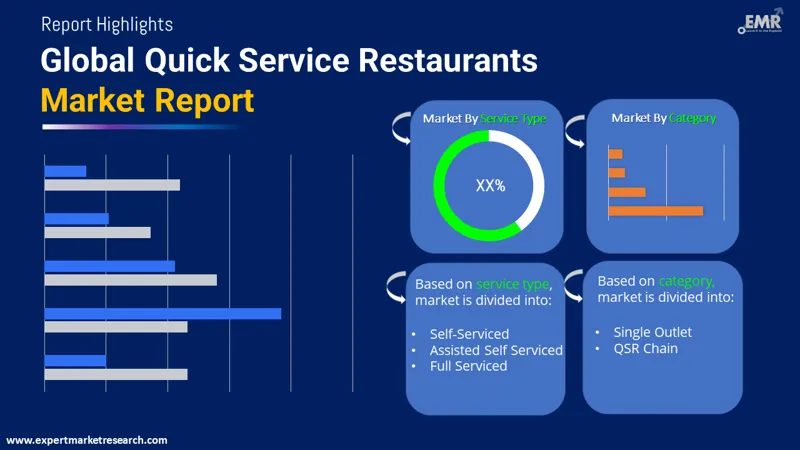
Market Breakup by Service Type
Key Insights: The quick service restaurants market includes Self-Serviced, Assisted Self-Serviced, and Fully Serviced models, which adjust to changing demands in consumer behavior. Self-Serviced models account for most markets owing to their speed and efficiency, even as technology in the form of kiosks and applications shortens wait and labor costs in lines, exemplified in Little Caesars opening its first fully self-service restaurant in Illinois to take advantage of independence and convenience. Assisted Self-Serviced models combine technology and human assistance for markets where a mix of both is preferred, while others have fully serviced models for markets requiring convenience and services.
Market Breakup by Category
Key Insights: The single outlet and QSR chain sub-segments depict the different models for development in the global QSR industry. Chain restaurants are in the leading position because of their recognizable brands, standard services, and extensive reach, striving for rapid development through networks and global alliances. Single outlet operators target niche development and localized menus in their operations. McDonald’s announcement concerning their strategy to open more than 8,000 restaurants globally by 2027 indicates chains' scalability in meeting global demand in a short period. Single outlets take advantages of their special features for distinguishing themselves in their locations.
Market Breakup by Region
Key Insights: The regional segmentation of the QSR industry helps identify areas that display high growth potential and those that display mature markets. North America still represents one of the largest markets driven by consumer demand for convenience and technology infrastructure. In Europe, the demand for fast-casual dining and technology-driven dining experiences is on the rise. The Asia Pacific region stands out as the largest growing region due to factors such as increasing affluence and Western food trends. Other markets include Latin America and the Middle East and Africa. Strategic investments help QSRs adapt to local tastes.
Read more about this report - REQUEST FREE SAMPLE COPY IN PDF
By service type, self-serviced category record significant growth
Self-serviced QSR formats are rapidly expanding as brands invest in kiosks, mobile ordering, and pickup-led models to improve speed and labor efficiency. Key players emphasize automation to manage large order volumes without sacrificing consistency. McDonald’s, in December 2023, announced further growth of the “CosMc’s” small-format, self-service beverage-focused concept in the United States, designed around digital ordering and drive-thru efficiency. This reflects growing industry focus on streamlined, self-operated service models.
As consumers look for enhanced dine-in experiences without giving up the core quick service values, full serviced QSR formats remain in favor. Brands are strengthening their position in the global market by investing in larger footprints, upgraded interiors, and hospitality-led service to facilitate a point of difference versus kiosk-heavy formats. Shake Shack announced in June 2024 that it planned to open 35 to 40 new full-service restaurants around the world, with a key focus on dine-in while integrating digital ordering into this concept. This will also help drive premium positioning and higher average order values in the full-service QSR segment.
By category, single outlets show robust growth
The single-outlet QSRs compete on menu differentiation, local sourcing, and experiential branding. These operators have increasingly invested in flagship locations to build brand identity. In July 2024, Pret A Manger announced the opening of a new standalone, company-owned store format focused on freshly prepared food and sustainability-driven operations. Such investments have shown how single outlets are using premium positioning and operational transparency to drive footfall.
The QSR chains dominate global expansions on the basis of franchising, standardization of operations, and large-scale capital deployment. The chain models can speed up market penetration with a similar consumer experience across different regions. In February 2024, Domino's Pizza announced plans for the opening of more than 1,300 new stores globally, driven by investments from master franchise partners, especially in Asia Pacific and Europe. This would further fortify how chain-driven expansion continues to drive overall QSR market growth.


Read more about this report - REQUEST FREE SAMPLE COPY IN PDF
By Region, North America leads the market growth
North America is still a mature, yet innovative QSR marketplace, where chains are investing heavily in the modernization of their stores and the roll-out of new concepts. In May of 2024, Taco Bell revealed plans to open more than 300 new restaurants every year in the United States, while investing in next-generation drive-thru and digital-first formats. Sustained capital committed here thus underlines the region's ongoing role in revenue stability and concept testing.
Asia Pacific is the fastest-growing region for QSR, driven by factors such as urbanization, rising disposable incomes, and strong franchise participation. Global brands are rapidly ramping up store rollouts through partnerships at the local levels. In August 2024, Yum China announced plans to open 1,500 new KFC and Pizza Hut restaurants every year, backed by investments in lower-tier cities and localized menus. This move underlines the status of Asia Pacific as a key growth driver for global QSR players.
Global quick, service restaurant players are amplifying their initiatives to consolidate their hold in the market through bold expansion, portfolio diversification, and franchise, led growth strategies. These companies are focusing their efforts on regions with rapid growth while also making investments in new restaurant formats, locally sourced menus, and operating models that are scalable. By forming strategic alliances with local operators and master franchisees, companies are able to enter markets more quickly, use their capital more efficiently and have a consistent brand presence which is the main reason why leading QSR brands are able to maintain their competitive positioning in both mature and emerging markets.
Market players have placed digital transformation at the core of their operational efficiency and customer engagement strategies. Several initiatives such as mobile ordering, loyalty platforms, self, service kiosks, and AI, enabled drive, thru solutions have been implemented and these are radically changing the way service is delivered. On the other hand, the store designs of the players in the market are being revamped and omnichannel experiences are being integrated to keep up with the demand for speed and at the same time maintain quality. All of these efforts are enabling QSR brands to effectively manage labor, increase order accuracy, and get higher average transaction values in different parts of the world.
Subway IP LLC operates as a global quick service restaurant chain, which focuses primarily on submarine sandwiches as well as customizable meals. It was established in the year 1965, and its headquarters is located in Shelton, Connecticut, in the United States.
McDonald’s Corporation is an internationally leading quick service restaurant chain, popular for its menu standardization and broad geographical reach. Established in 1955, it is headquartered at Chicago, Illinois, United States.
Restaurant Brands International Inc. is a global fast-service restaurants holding company that owns popular fast-food brands, including the burgers, coffee, and chicken categories. This company was established in 2014, and its operational hub is positioned in Toronto, Canada, serving more than 100 different global nations.
Yum! Brands, Inc. is a global restaurant leader with a diversified family of iconic QSR brands. The company was established in 1997 and operates its headquarters in Louisville, Kentucky, in the United States of America.
Other players in the market include The Wendy's Company, and Domino's Pizza, Inc., among others.
*Please note that this is only a partial list; the complete list of key players is available in the full report. Additionally, the list of key players can be customized to better suit your needs.*
Explore the latest trends shaping the Global Quick Service Restaurants Market 2026-2035 with our in-depth report. Gain strategic insights, future forecasts, and key market developments that can help you stay competitive. Download a free sample report or contact our team for customized consultation on global quick service restaurants market trends 2026.
Upto 15% Off
USD
$2499 $2249
$3999 $3599
$4999 $4249
$5999 $5099


*While we strive to always give you current and accurate information, the numbers depicted on the website are indicative and may differ from the actual numbers in the main report. At Expert Market Research, we aim to bring you the latest insights and trends in the market. Using our analyses and forecasts, stakeholders can understand the market dynamics, navigate challenges, and capitalize on opportunities to make data-driven strategic decisions.*
In 2025, the global quick service restaurants market reached an approximate value of USD 498.88 Billion.
The market is projected to grow at a CAGR of 3.70% between 2026 and 2035.
The market is estimated to witness a healthy growth in the forecast period of 2026-2035 to reachUSD 717.44 Billion by 2035.
Key strategies driving the market include franchise-led expansion, international partnerships, menu innovation, and increased investments in digital ordering, delivery platforms, and self-service formats.
Key trends aiding quick service restaurant market expansion include the incorporation of advanced technology like self-ordering kiosks and the use of artificial intelligence to streamline the food ordering process.
The major regional markets for quick service restaurants are North America, Latin America, the Asia Pacific, Europe, and the Middle East and Africa.
Different types of services offered by quick service restaurants are self-serviced, assisted self-serviced, and full serviced.
The major categories of quick service restaurants are single outlet and QSR chain.
QSRs differ from fast casual restaurants in several ways. QSRs emphasise speed, efficiency, and a smaller selection of preassembled menu items, whereas fast casual restaurants offer more variety, fresher ingredients, and a more relaxed dining environment.
The key players in the market include Subway IP LLC, McDonald's Corporation, Restaurant Brands International Inc., Yum! Brands, Inc., The Wendy's Company, and Domino's Pizza, Inc., along with several other regional and international operators contributing to market competition.
Major challenges include rising food and labor costs, intense competition, supply chain volatility, regulatory pressures, and evolving consumer preferences.
Explore our key highlights of the report and gain a concise overview of key findings, trends, and actionable insights that will empower your strategic decisions.
| REPORT FEATURES | DETAILS |
| Base Year | 2025 |
| Historical Period | 2019-2025 |
| Forecast Period | 2026-2035 |
| Scope of the Report |
Historical and Forecast Trends, Industry Drivers and Constraints, Historical and Forecast Market Analysis by Segment:
|
| Breakup by Service Type |
|
| Breakup by Category |
|
| Breakup by Region |
|
| Market Dynamics |
|
| Competitive Landscape |
|
| Companies Covered |
|
Datasheet
One User
USD 2,499
USD 2,249
tax inclusive*
Single User License
One User
USD 3,999
USD 3,599
tax inclusive*
Five User License
Five User
USD 4,999
USD 4,249
tax inclusive*
Corporate License
Unlimited Users
USD 5,999
USD 5,099
tax inclusive*
*Please note that the prices mentioned below are starting prices for each bundle type. Kindly contact our team for further details.*
Flash Bundle
Small Business Bundle
Growth Bundle
Enterprise Bundle
*Please note that the prices mentioned below are starting prices for each bundle type. Kindly contact our team for further details.*
Flash Bundle
Number of Reports: 3
20%
tax inclusive*
Small Business Bundle
Number of Reports: 5
25%
tax inclusive*
Growth Bundle
Number of Reports: 8
30%
tax inclusive*
Enterprise Bundle
Number of Reports: 10
35%
tax inclusive*
How To Order

Select License Type
Choose the right license for your needs and access rights.

Click on ‘Buy Now’
Add the report to your cart with one click and proceed to register.

Select Mode of Payment
Choose a payment option for a secure checkout. You will be redirected accordingly.
Strategic Solutions for Informed Decision-Making
Gain insights to stay ahead and seize opportunities.

Get insights & trends for a competitive edge.

Track prices with detailed trend reports.

Analyse trade data for supply chain insights.

Leverage cost reports for smart savings

Enhance supply chain with partnerships.

Connect For More Information
Our expert team of analysts will offer full support and resolve any queries regarding the report, before and after the purchase.
Our expert team of analysts will offer full support and resolve any queries regarding the report, before and after the purchase.
We employ meticulous research methods, blending advanced analytics and expert insights to deliver accurate, actionable industry intelligence, staying ahead of competitors.
Our skilled analysts offer unparalleled competitive advantage with detailed insights on current and emerging markets, ensuring your strategic edge.
We offer an in-depth yet simplified presentation of industry insights and analysis to meet your specific requirements effectively.


