

Consumer Insights
Uncover trends and behaviors shaping consumer choices today
Procurement Insights
Optimize your sourcing strategy with key market data
Industry Stats
Stay ahead with the latest trends and market analysis.
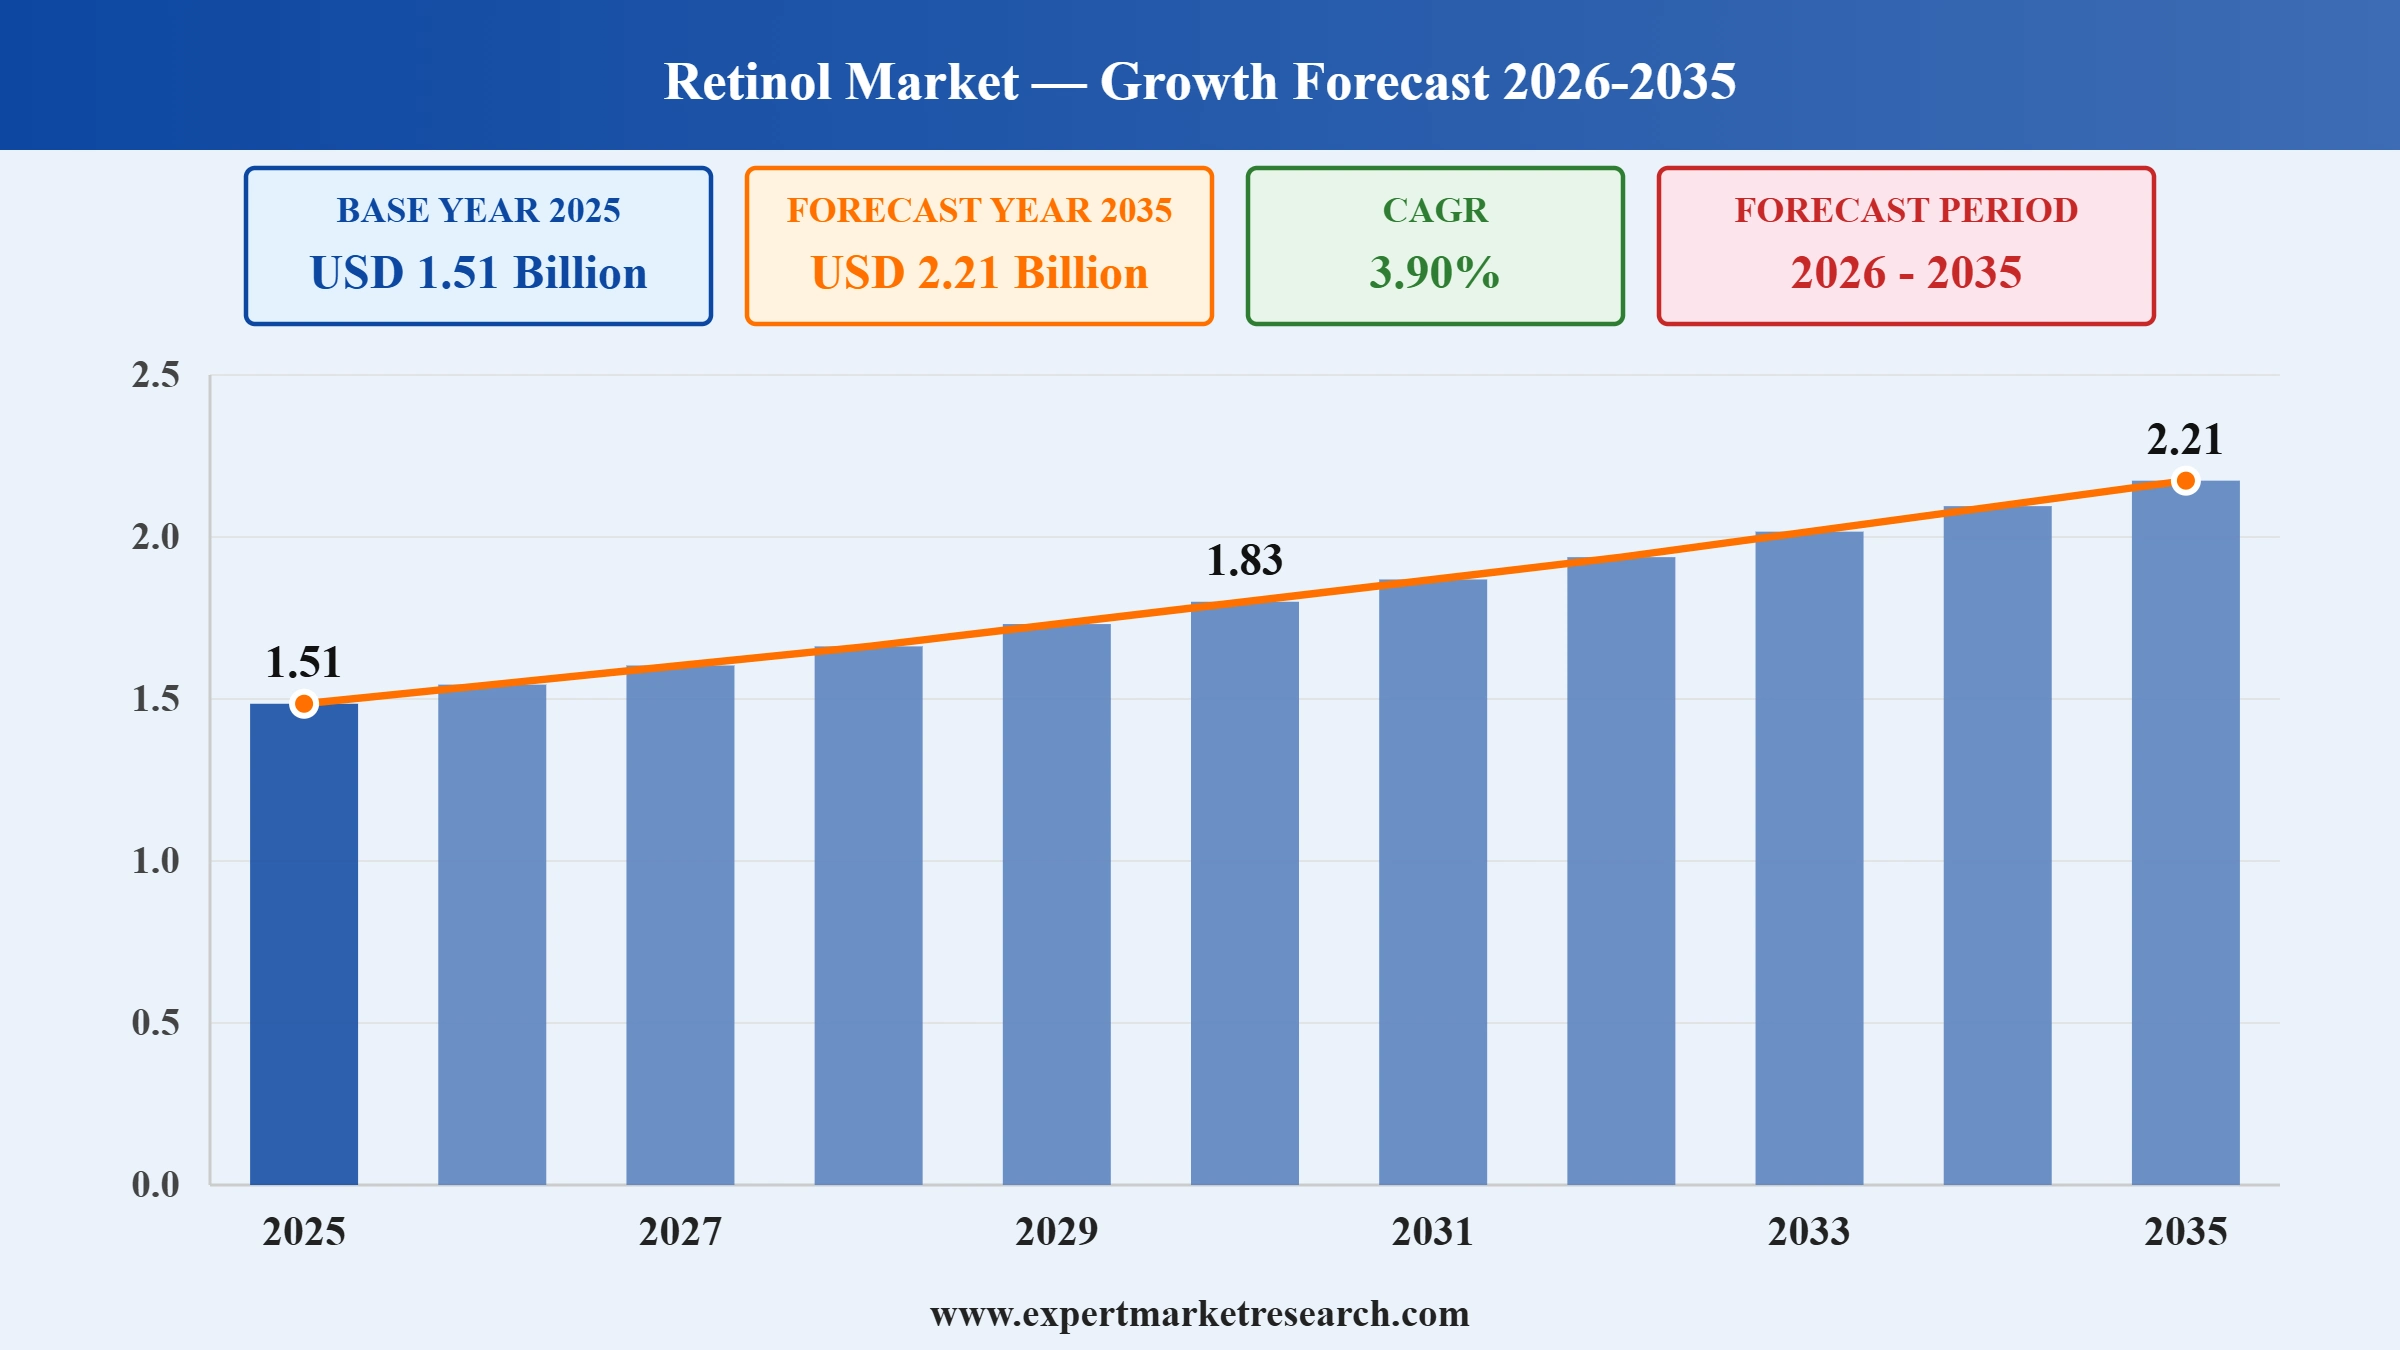
The global retinol market size reached around USD 1.51 Billion in 2025. The market is projected to grow at a CAGR of 3.90% between 2026 and 2035 to reach nearly USD 2.21 Billion by 2035.
Read more about this report - REQUEST FREE SAMPLE COPY IN PDF
| Global Retinol Market Report Summary | Description | Value |
| Base Year | USD Billion | 2025 |
| Historical Period | USD Billion | 2019-2025 |
| Forecast Period | USD Billion | 2026-2035 |
| Market Size 2025 | USD Billion | 1.51 |
| Market Size 2035 | USD Billion | 2.21 |
| CAGR 2019-2025 | Percentage | XX% |
| CAGR 2026-2035 | Percentage | 3.90% |
| CAGR 2026-2035 - Market by Region | Asia Pacific | 4.5% |
| CAGR 2026-2035 - Market by Country | India | 5.1% |
| CAGR 2026-2035 - Market by Country | China | 4.4% |
| CAGR 2026-2035 - Market by Type | Synthetic | 4.3% |
| CAGR 2026-2035 - Market by Application | Personal Care and Cosmetics | 4.6% |
| Market Share by Country 2025 | Germany | 4.7% |
In 2023, the retail sales of all beauty products recorded a year-on-year surge of 10% to reach nearly USD 446 billion. North America, Europe, the Middle East and Africa, and Latin America witnessed year-on-year growth of 9%, 10%, 18%, and 17% respectively. However, the market analysis suggests that the Asia Pacific (excluding Australia and China) recorded the highest growth in retail sales of beauty products, with India leading the market growth. In 2023, overall sales surged y-o-y by 10%, indicating the rising demand for beauty products even among low-income consumers. This is expected to drive the retinol market expansion as it’s extensively used in anti-ageing creams, acne treatment formulations, and sunscreens.
Moreover, as per the International Agency for Research on Cancer (working under the WHO), nearly 20 million new cases of cancers were reported in 2020, while 9.7 million individuals lost their lives. Every 1 in 5 people are expected to develop cancer over their lifetime, with 1 in 12 women and 1 in 9 men at a risk of not improving from treatment. To improve the survival rates among patients, many healthcare providers are switching towards the usage of retinols for treating Acute Promyelocytic Leukemia (APL) and Neuroblastoma, apart from other types of cancers occurring in lungs, women’s breasts, women’s ovaries, prostate gland, gall bladder, and mouth. This is expected to drive the retinol market value over the forecast period.


Read more about this report - REQUEST FREE SAMPLE COPY IN PDF
Increasing pet food sales worldwide; rising appeal for fortified foods; development of pharmaceuticals; and increasing scientific research are trends favourably shaping the retinol market outlook.
COSRX, a leading skincare brand introduced the Retinol 3.0 cream on e-commerce platforms. Its lightweight formula is designed to reduce the appearance of fine lines and ensure youthful-looking skin.
Eluminex Biosciences Limited acquired certain assets and commercialisation rights for a unique oral therapy known as zuretinol acetate from Retinagenix Holdings, LLC, which is an American ophthalmic company. Zuretinol is an upcoming treatment for children with rare forms of blindness and is expected to drive the retinol market revenue.
Merck KGaA established a strategic partnership with Exscientia and BenevolentAI to strengthen its AI-driven drug discovery efforts. This is expected to facilitate the growth of the retinol market development over the forecast period.
By 2030, global pet food sales are expected to grow by over 50% from the current levels due to changing family sizes and increasing rates of pet adoption among the millennials. This is expected to drive the demand for retinol-based pet food supplies, since they enhance skin texture and immune health of animals.
Vitamin A is renowned for its health benefits, such as improved eyesight, better immune health, and ensuring overall physical growth and development. This is expected to increase the demand for food products fortified with retinol, thereby contributing to retinol market expansion.
Retinol is a crucial ingredient in many pharmaceutical products, including creams for treating hyperpigmentation due to its therapeutic benefits.
Rapid advancements in biotechnological research has led to the discovery of numerous benefits of using retinols in small quantities. This is expected to drive the market growth.
The United States and Europe are expected to dominate the global pet food sales till 2030. As per the market analysis, the average cost of owning dogs is expected to reach USD 1520 in the United States and USD 695 in Europe, driven by growing consumer expenditure on healthy and nutritious pet food products. A similar trajectory is observed in cat food, as the cost of ownership has risen to USD 950 in the United States and USD 472.50 in Europe. This is expected to favourably impact the market outlook, as fortified pet food products ensure all-round development of pet health, including reproductive and immunity functions.
The Expert Market Research’s report titled “Global Retinol Market Report and Forecast 2026-2035” offers a detailed analysis of the market based on the following segments:
Market Breakup by Type
Market Breakup by Application
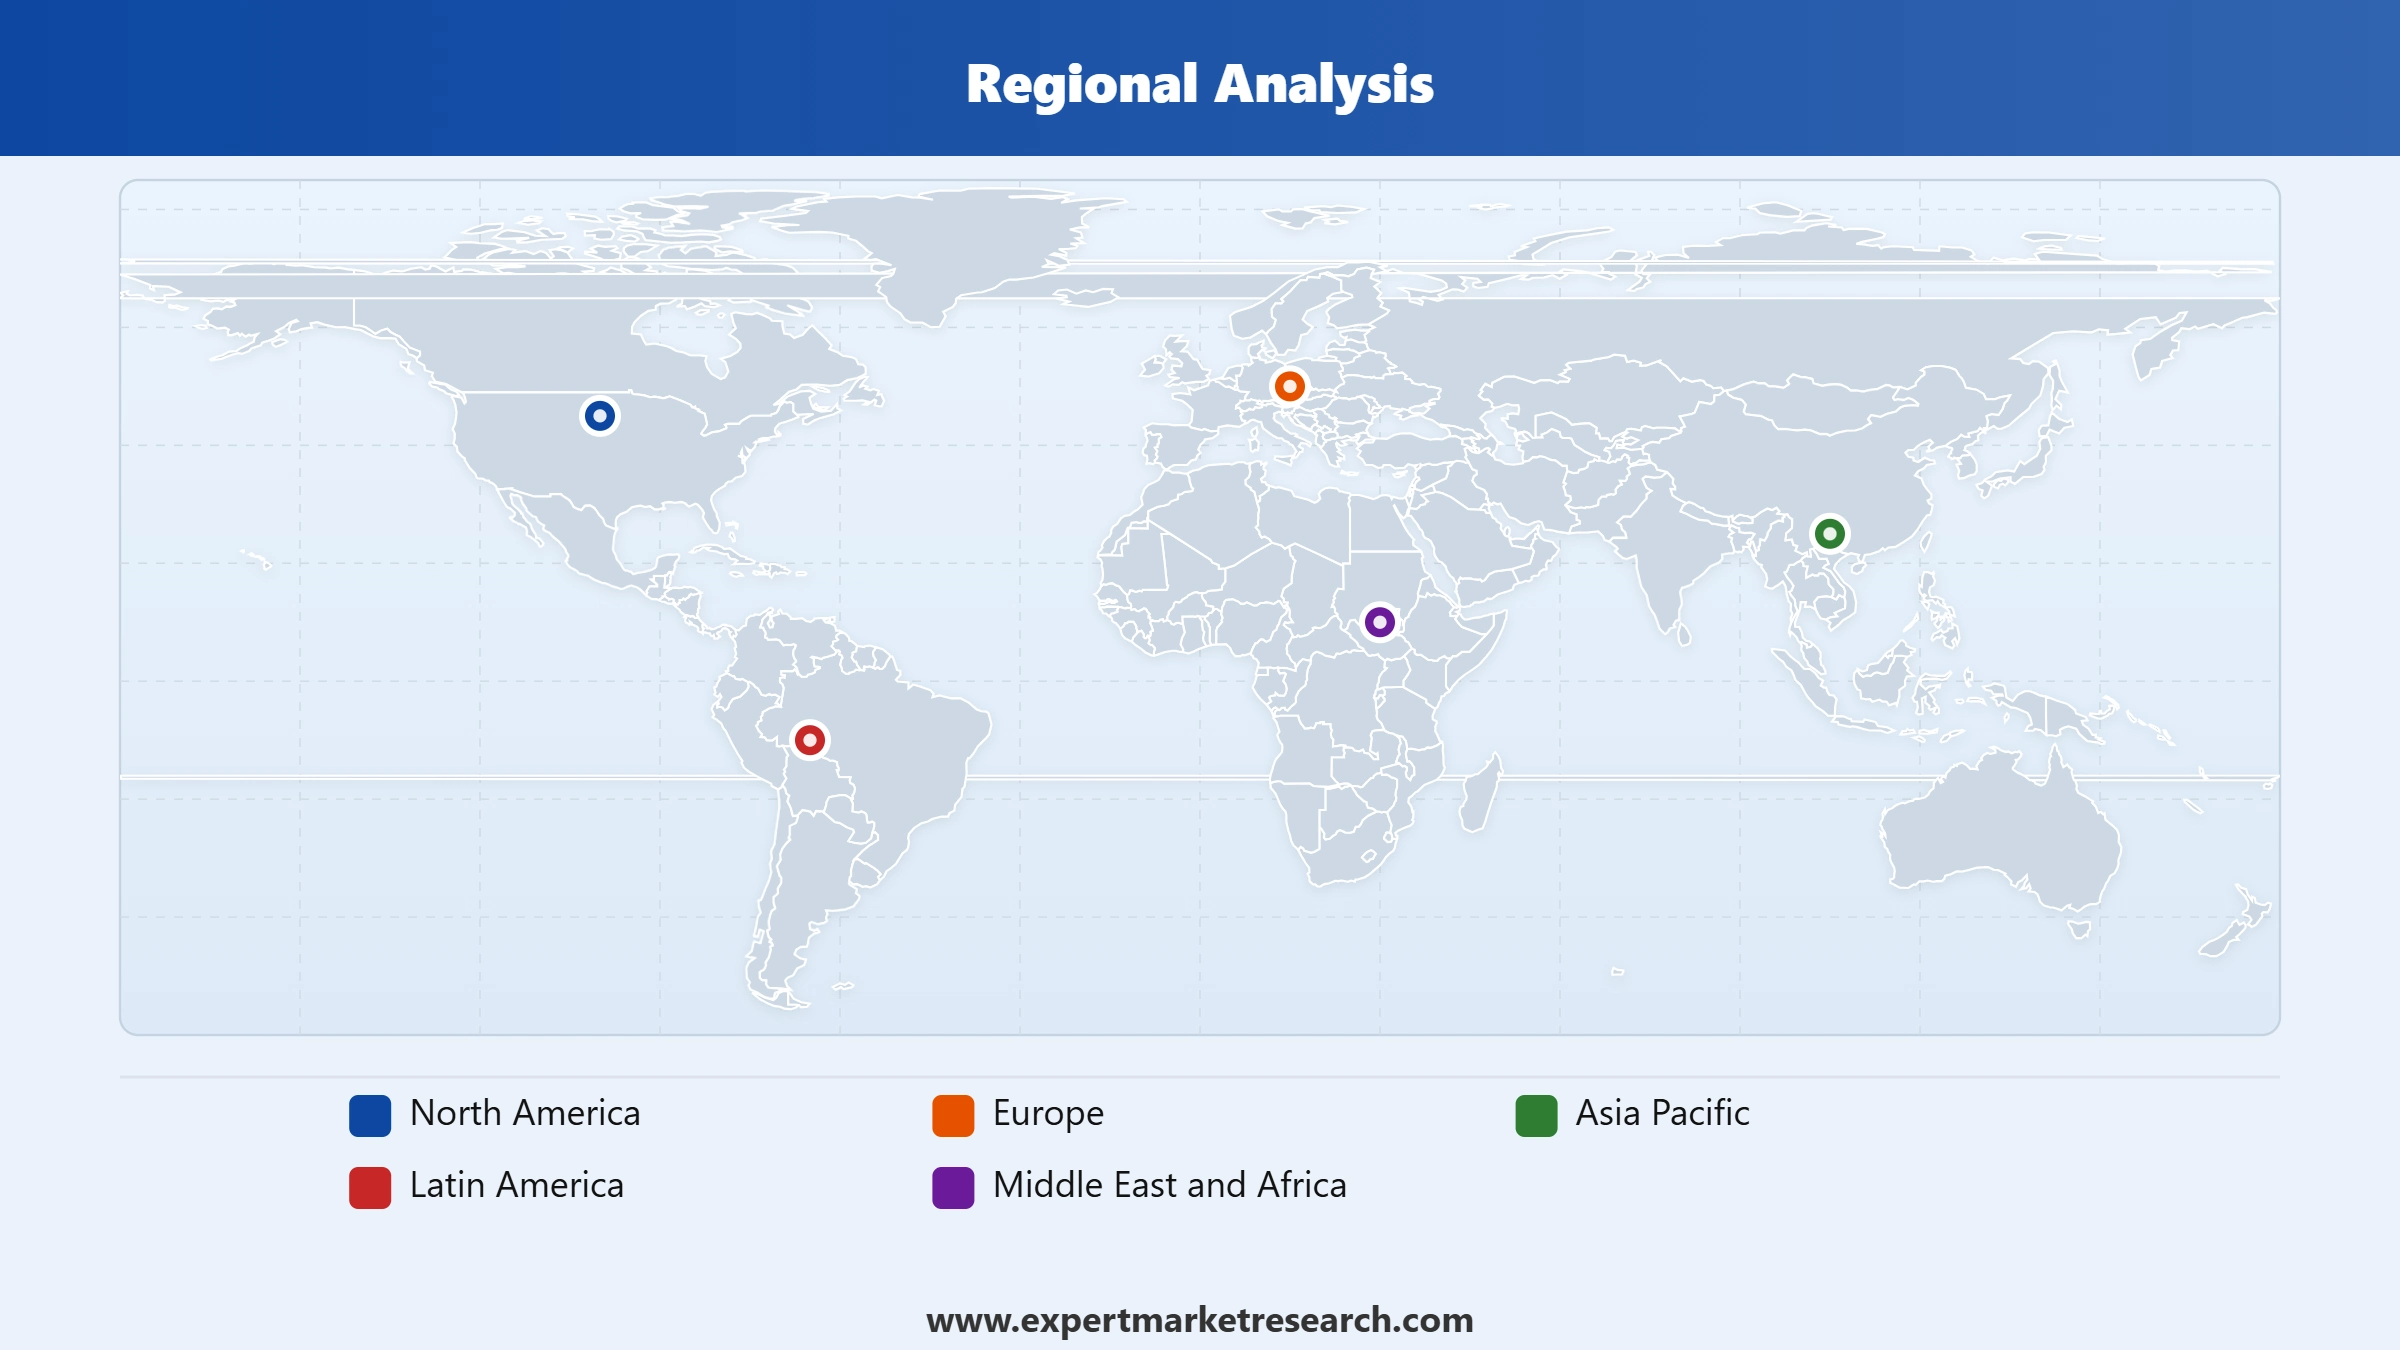
Market Breakup by Region
Based on region, the market is segmented into North America, Europe, the Asia Pacific, Latin America, and the Middle East and Africa. Over the forecast period of 2024-32, the Asia Pacific is expected to grow at a CAGR of 4.5% because of growing sales of retinol-based beauty products in the region. Moreover, the increasing consumption of dietary supplements for enhancing eye health and promoting immune strength is expected to drive the market expansion in APAC over the forecast period.
Read more about this report - REQUEST FREE SAMPLE COPY IN PDF
Major players are removing ingredients of concern such as BHA and BHT from their retinol formulations to increase their revenue from cosmetics manufacturers and expand their retinol market share.
BASF SE is a multinational company which was founded in 1865 and is based in Ludwigshafen, Germany. It is involved in the production of numerous functional solutions and materials, apart from performance products and agricultural solutions.
dsm-firmenich was founded in 1895 and is headquartered in Aargau, Switzerland. It is engaged in producing early life nutrition solutions, baking ingredients, fragrances, and animal nutrition solutions.
Eluminex Biosciences is a privately held company engaged in conducting biotechnological research. It was established in early 2020 and is headquartered in Suzhou, China.
Merck KGaA was founded in 1668 and is headquartered in Darmstadt, Germany. It is a leading science and technology company which specialises in the production of chemicals and pharmaceutical products.
*Please note that this is only a partial list; the complete list of key players is available in the full report. Additionally, the list of key players can be customized to better suit your needs.*
There are many other players in the global retinol market landscape.
Upto 15% Off
USD
$3999 $3599
$2499 $2249
$4999 $4249
$5999 $5099


*While we strive to always give you current and accurate information, the numbers depicted on the website are indicative and may differ from the actual numbers in the main report. At Expert Market Research, we aim to bring you the latest insights and trends in the market. Using our analyses and forecasts, stakeholders can understand the market dynamics, navigate challenges, and capitalize on opportunities to make data-driven strategic decisions.*
In 2025, the market reached an approximate value of USD 1.51 Billion.
The market is projected to grow at a CAGR of 3.90% between 2026 and 2035.
The market is estimated to witness healthy growth in the forecast period of 2026-2035 to reach a value of around USD 2.21 Billion by 2035.
Key trends aiding the market expansion are increasing pet food sales worldwide, rising appeal for fortified foods, development of pharmaceuticals, and increasing scientific research and development efforts.
The different regions covered in the market report include North America, Europe, the Asia Pacific, Latin America, and the Middle East and Africa.
The different types of retinols in the market are natural and synthetic.
The different applications of retinol include personal care and cosmetics, dietary supplements, food and beverage, and animal feed, among others.
The key market players are BASF SE, dsm-firmenich, Eluminex Biosciences, and Merck KGaA, among others.
Explore our key highlights of the report and gain a concise overview of key findings, trends, and actionable insights that will empower your strategic decisions.
| REPORT FEATURES | DETAILS |
| Base Year | 2025 |
| Historical Period | 2019-2025 |
| Forecast Period | 2026-2035 |
| Scope of the Report |
Historical and Forecast Trends, Industry Drivers and Constraints, Historical and Forecast Market Analysis by Segment:
|
| Breakup by Type |
|
| Breakup by Application |
|
| Breakup by Region |
|
| Market Dynamics |
|
| Competitive Landscape |
|
| Companies Covered |
|
Single User License
One User
USD 3,999
USD 3,599
tax inclusive*
Datasheet
One User
USD 2,499
USD 2,249
tax inclusive*
Five User License
Five User
USD 4,999
USD 4,249
tax inclusive*
Corporate License
Unlimited Users
USD 5,999
USD 5,099
tax inclusive*
*Please note that the prices mentioned below are starting prices for each bundle type. Kindly contact our team for further details.*
Flash Bundle
Small Business Bundle
Growth Bundle
Enterprise Bundle
*Please note that the prices mentioned below are starting prices for each bundle type. Kindly contact our team for further details.*
Flash Bundle
Number of Reports: 3
20%
tax inclusive*
Small Business Bundle
Number of Reports: 5
25%
tax inclusive*
Growth Bundle
Number of Reports: 8
30%
tax inclusive*
Enterprise Bundle
Number of Reports: 10
35%
tax inclusive*
How To Order

Select License Type
Choose the right license for your needs and access rights.

Click on ‘Buy Now’
Add the report to your cart with one click and proceed to register.

Select Mode of Payment
Choose a payment option for a secure checkout. You will be redirected accordingly.
Strategic Solutions for Informed Decision-Making
Gain insights to stay ahead and seize opportunities.

Get insights & trends for a competitive edge.

Track prices with detailed trend reports.

Analyse trade data for supply chain insights.

Leverage cost reports for smart savings

Enhance supply chain with partnerships.

Connect For More Information
Our expert team of analysts will offer full support and resolve any queries regarding the report, before and after the purchase.
Our expert team of analysts will offer full support and resolve any queries regarding the report, before and after the purchase.
We employ meticulous research methods, blending advanced analytics and expert insights to deliver accurate, actionable industry intelligence, staying ahead of competitors.
Our skilled analysts offer unparalleled competitive advantage with detailed insights on current and emerging markets, ensuring your strategic edge.
We offer an in-depth yet simplified presentation of industry insights and analysis to meet your specific requirements effectively.


