

Consumer Insights
Uncover trends and behaviors shaping consumer choices today
Procurement Insights
Optimize your sourcing strategy with key market data
Industry Stats
Stay ahead with the latest trends and market analysis.
The global robotic refuelling system market is anticipated to expand from USD 167.42 Million in 2025 to USD 3650.80 Million by 2035 at a CAGR of 36.10% during the forecast period of 2026-2035.
According to ABS, iron ore exploration rose by 29.9% between June 2023 and June 2024, reaching USD 195.3 million. The growth in mineral exploration reflects an increased demand for advanced technologies, which may boost the adoption of automated and robotic systems for resource extraction and refuelling applications.
The European Automobile Manufacturers Association reports an 8.5% increase in U.S. car production in 2023, with 7,629,525 units produced. This rise in production contributes to the growing need for efficient refuelling systems, including robotic refuelling solutions, to streamline operations in the automotive industry, improving refuelling efficiency.
According to industry reports, the top five military spenders in 2022- U.S., China, Russia, India, and Saudi Arabia—indicate a demand for advanced military technologies. This significant military expenditure is likely to drive the development of automated and robotic refuelling solutions for military vehicles, increasing operational effectiveness in defence sectors.
Compound Annual Growth Rate
36.1%
Value in USD Million
2026-2035
The increasing adoption of independent transport trucks in mining, where gasoline is used as the main fuel, is anticipated to drive the robotic refuelling system industry during the forecast period. The increasing demand for automation, electric/hybrid cars, and the growing implementation of cost-effective on-site refuelling stations for mining haulage trucks globally are the main factors driving the robotic refuelling system industry development with a payload capability of 105–155 kg.
Read more about this report - REQUEST FREE SAMPLE COPY IN PDF
The robotic refuelling market is growing due to advancements in automation and efficiency, the integration of AI and IoT, increasing demand for eco-friendly solutions, and the expansion of commercial aviation.
In the UAE, ADNOC launched a pilot project introducing an AI-powered robotic fueling arm at gas stations. The arm uses sensors, cameras, and computer vision to automatically fuel vehicles, reducing spills and improving efficiency. Demonstrated at Al Reem Island, the technology aims to enhance productivity and reduce wait times.
SwarmFarm Robotics introduced its Dock and Refill technology, set to launch in April 2024. This innovation allows spray robots to autonomously refill and refuel, enhancing productivity without relying on large equipment. The system, featuring a docking arm and payload pod, promotes flexibility and efficiency in farming operations, with multiple robots using a single dock.
Autofuel, a Denmark-based company, launched its fully automated robotic refueling system in Espoo, Finland. The system eliminates human involvement, improving safety, convenience, and efficiency. It adapts to various energy types, including EVs and hydrogen cars, and operates 24/7, reducing costs and increasing revenue for gas stations.
Stratom, a robotics company, launched RAPID, an autonomous refueling and liquid transfer system for military and other rugged applications. The system uses an industrial robot arm to autonomously refuel vehicles in challenging environments, enhancing safety and efficiency, with potential uses across various sectors like mining, aviation, and logistics.
The market is increasingly focused on automation, which enhances efficiency and accelerates the refuelling process. Automated systems reduce human error, improve turnaround times, and contribute to cost savings across industries like aviation and logistics. Advances in robotics, AI, and machine learning are at the forefront of this transformation. Orbit Fab partnered with Astroscale U.S. in January 2022 to provide refuelling services for the LEXI satellite-servicing robots. This collaboration involves supplying 1,000 kilograms of Xenon propellant to enhance satellite servicing, extending spacecraft lifespan, with launches expected in 2026.
The integration of AI and IoT is revolutionising the robotic refuelling market. AI enables autonomous decision-making, while IoT facilitates real-time monitoring, predictive maintenance, and remote operations. This convergence optimises system reliability and enhances operational efficiency, reducing downtime in refuelling operations. PIAP Space's INORT project, launched in August 2024. Funded by the European Space Agency, the project focuses on developing in-orbit refuelling technology, which aims to extend satellite lifespans by addressing fuel depletion. The system’s focus on docking, fuel transfer, and robotic control systems will promote sustainability and reduce satellite replacement costs.
Sustainability is becoming a major driving force in the market for robotic refuelling market. Companies are increasingly turning to eco-friendly solutions, such as electric-powered robots, to reduce their carbon footprints. Automated systems also reduce fuel waste, supporting environmental initiatives and complying with regulatory pressures. Collaboration between Astroscale Japan and JAXA, launched in December 2022, to develop satellite refuelling services as part of space sustainability efforts. The project, under JAXA's J-SPARC initiative, aims to create refuelling systems for both prepared and unprepared satellites, using advanced robotic technologies to support space operations.
The adoption of robotic refuelling solutions in commercial aviation is accelerating, driven by the need to improve turnaround times and boost operational efficiency. As air traffic increases and airlines look for cost-effective solutions, automated refuelling systems are becoming essential at airports worldwide. This shift is set to continue with technological advancements that promise faster, more precise, and cost-efficient refuelling. In August 2024, Solinftec introduced an autonomous docking station at the Farm Progress Show for Solix Ag Robotics. This solar-powered station ensures continuous operations by autonomously refuelling robots, with AI-driven management to optimise agricultural field tasks.
Robotic refuelling is an automated refuelling system that utilises high-end vision sensing and detection technologies to direct the nozzle into the fuel tank of the truck. This scheme considerably improves the flexibility of the on-the-job project while also solving cost, productivity, and safety difficulties when in place. The robotic refuelling system industry can be divided on the basis of the segments like components, fuel pumped, vertical, and payload carrying capacity. The industry can be differentiated on the basis of its components, like hardware and software. The industry can be divided on the basis of its fuel pumped into gasoline, natural gas, petrochemicals, and others. The market can be broadly categorised on the basis of its verticals into:
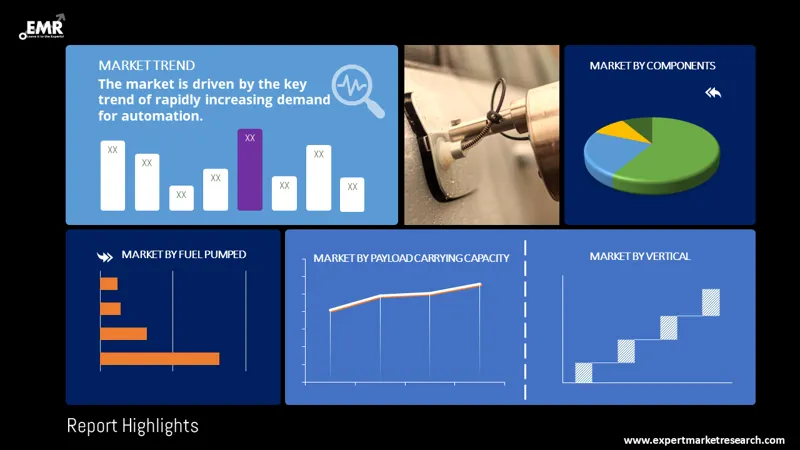
Market Breakup by Components
Market Breakup by Fuel Pumped
Market Breakup by Payload Carrying Capacity
Market Breakup by Vertical
Market Breakup by Region
Read more about this report - REQUEST FREE SAMPLE COPY IN PDF
Verticals such as mining, automotive, aviation, army and defence, and warehouse and logistics involve robotic refuelling systems with a broad spectrum of payload capability based on the type of fuel being pumped and the implementation of these technologies in each area, thus, aiding the market growth. The growing demand for minimum-cost operations in mining vertical and the need for enhanced safety and security are providing further impetus to the market growth. Fuel dispensation is the key driver of the market growth. It is anticipated that the market for robotic refuelling devices, involved in pumping gasoline, among other fuels, will hold the biggest share in 2020.
One of the main constraints to the market growth is the legal and safety regulations. The replacement of manual caps with automated fuel caps is a significant challenge, which may hamper the industry growth during the forecast period.


The robotic refuelling market key players design, manufacture, and service advanced automation equipment, providing solutions across various industries, including food processing, mining, and manufacturing. These companies are renowned for their innovation in robotic systems and automation technologies, helping businesses enhance efficiency, reduce costs, and improve safety. Their products include robotic arms, automated sorting systems, and custom-engineered solutions tailored to specific industry requirements.
Headquartered in Dunedin, New Zealand, Scott Technology Ltd. was established in 1913. The company provides advanced automation and robotic systems, primarily serving the industrial and food processing sectors. Scott Technology focuses on delivering innovative solutions to optimise manufacturing processes, improve productivity, and reduce operational costs.
Plug Power Inc., founded in 1997, is based in New York, United States. The company specialises in providing clean hydrogen and fuel cell systems, focusing on renewable energy solutions for industrial, commercial, and transportation sectors. Plug Power develops hydrogen-powered solutions to reduce dependence on traditional energy sources.
Rotec Engineering B.V. was established in 1985 and is headquartered in Rotterdam, Netherlands. The company designs and manufactures high-quality mechanical components, particularly in the industrial, marine, and offshore sectors. Rotec Engineering is known for its precision engineering and expertise in providing robust solutions for demanding applications.
Fuelmatics AB, founded in 2017 and based in Gothenburg, Sweden, is a leading provider of automated refuelling systems. The company’s innovative solutions focus on improving the efficiency and safety of refuelling processes, with a particular emphasis on alternative fuels, including electric and hydrogen-powered vehicles.
*Please note that this is only a partial list; the complete list of key players is available in the full report. Additionally, the list of key players can be customized to better suit your needs.*
Other key players in the robotic refuelling market report are Mine Energy Solutions (MES), ABB Group Ltd., and KUKA AG, among others.
Upto 15% Off
USD
$2499 $2249
$3999 $3599
$4999 $4249
$5999 $5099


*While we strive to always give you current and accurate information, the numbers depicted on the website are indicative and may differ from the actual numbers in the main report. At Expert Market Research, we aim to bring you the latest insights and trends in the market. Using our analyses and forecasts, stakeholders can understand the market dynamics, navigate challenges, and capitalize on opportunities to make data-driven strategic decisions.*
The robot refuelling system market size attained a value of USD 167.42 Million in 2025.
The market is projected to grow at a CAGR of 36.10% during the forecast period of 2026-2035.
The market is estimated to witness a healthy growth in the forecast period of 2026-2035 to reach USD 3650.80 Million by 2035.
The major drivers of the market include the increasing adoption of independent transport trucks in mining, growing implementation of cost-effective on-site refuelling stations for mining haulage trucks.
The rapidly rising demand for automation acts as a key trend for the market.
The major regions in the market are North America, Latin America, the Middle East and Africa, Europe, and the Asia Pacific.
The components in the market are hardware and software, among others. Hardware is further categorised into vehicle positioning system, control system, robotic arm, and fuel dispensing system.
The fuel pumped in the market are gasoline, natural gas, petrochemicals, among others.
The leading vertical in the market are mining, automotive, oil and gas, aerospace, military and defence, warehouse and logistics, marine and shipping, and construction, among others.
The leading payload carrying capacity in the market are up to 50 kg, 50–100 kg, and 100–150 kg.
The major players in the market are Scott Technology Ltd., Plug Power Inc., Rotec Engineering B.V., Fuelmatics AB, Mine Energy Solutions (MES), ABB Group Ltd., KUKA AG and Others.
Explore our key highlights of the report and gain a concise overview of key findings, trends, and actionable insights that will empower your strategic decisions.
| REPORT FEATURES | DETAILS |
| Base Year | 2025 |
| Historical Period | 2019-2025 |
| Forecast Period | 2026-2035 |
| Scope of the Report |
Historical and Forecast Trends, Industry Drivers and Constraints, Historical and Forecast Market Analysis by Segment:
|
| Breakup by Components |
|
| Breakup by Fuel Pumped |
|
| Breakup by Payload Carrying Capacity |
|
| Breakup by Vertical |
|
| Breakup by Region |
|
| Market Dynamics |
|
| Competitive Landscape |
|
| Companies Covered |
|
| Report Price and Purchase Option | Explore our purchase options that are best suited to your resources and industry needs. |
| Delivery Format | Delivered as an attached PDF and Excel through email, with an option of receiving an editable PPT, according to the purchase option. |
Datasheet
One User
USD 2,499
USD 2,249
tax inclusive*
Single User License
One User
USD 3,999
USD 3,599
tax inclusive*
Five User License
Five User
USD 4,999
USD 4,249
tax inclusive*
Corporate License
Unlimited Users
USD 5,999
USD 5,099
tax inclusive*
*Please note that the prices mentioned below are starting prices for each bundle type. Kindly contact our team for further details.*
Flash Bundle
Small Business Bundle
Growth Bundle
Enterprise Bundle
*Please note that the prices mentioned below are starting prices for each bundle type. Kindly contact our team for further details.*
Flash Bundle
Number of Reports: 3
20%
tax inclusive*
Small Business Bundle
Number of Reports: 5
25%
tax inclusive*
Growth Bundle
Number of Reports: 8
30%
tax inclusive*
Enterprise Bundle
Number of Reports: 10
35%
tax inclusive*
How To Order

Select License Type
Choose the right license for your needs and access rights.

Click on ‘Buy Now’
Add the report to your cart with one click and proceed to register.

Select Mode of Payment
Choose a payment option for a secure checkout. You will be redirected accordingly.
Strategic Solutions for Informed Decision-Making
Gain insights to stay ahead and seize opportunities.

Get insights & trends for a competitive edge.

Track prices with detailed trend reports.

Analyse trade data for supply chain insights.

Leverage cost reports for smart savings

Enhance supply chain with partnerships.

Connect For More Information
Our expert team of analysts will offer full support and resolve any queries regarding the report, before and after the purchase.
Our expert team of analysts will offer full support and resolve any queries regarding the report, before and after the purchase.
We employ meticulous research methods, blending advanced analytics and expert insights to deliver accurate, actionable industry intelligence, staying ahead of competitors.
Our skilled analysts offer unparalleled competitive advantage with detailed insights on current and emerging markets, ensuring your strategic edge.
We offer an in-depth yet simplified presentation of industry insights and analysis to meet your specific requirements effectively.


