

Consumer Insights
Uncover trends and behaviors shaping consumer choices today
Procurement Insights
Optimize your sourcing strategy with key market data
Industry Stats
Stay ahead with the latest trends and market analysis.
The global rugged tablet market is anticipated to grow in the forecast period of 2026-2035 at a CAGR of 5.00%.
Panasonic Connect refreshed its TOUGHBOOK rugged tablet lineup in April with new Windows-based and Android configurations targeting US and European public safety, defense, utility and field service customers. The launches reinforce TOUGHBOOK leadership against Zebra Technologies, Getac and Honeywell in rugged mobile computing, where 5G connectivity and Mil-Std-810H certification continue to set buyer expectations, Reuters reported.
Taiwanese rugged computing major Getac and US logistics specialist Zebra Technologies expanded rugged tablet offerings through March at the SHOT Show, AUSA Global Force and ProMat 2026 trade events, targeting defense, logistics and public safety buyers. The push capitalises on continued US Department of Defense, NATO and warehouse modernisation contracts, while Samsung's Galaxy Tab Active series defends share in the lower-tier rugged segment, Nikkei Asia reported.
Compound Annual Growth Rate
5%
2026-2035
| Global Rugged Tablet Market Report Summary | Description | Value |
| Base Year | USD Million | 2025 |
| Historical Period | USD Million | 2019-2025 |
| Forecast Period | USD Million | 2026-2035 |
| Market Size 2025 | USD Million | XX |
| Market Size 2035 | USD Million | XX |
| CAGR 2019-2025 | Percentage | XX% |
| CAGR 2026-2035 | Percentage | 5.00% |
| CAGR 2026-2035 - Market by Region | Asia Pacific | 6.0% |
| CAGR 2026-2035 - Market by Country | India | 6.6% |
| CAGR 2026-2035 - Market by Country | China | 5.7% |
| CAGR 2026-2035 - Market by Distribution Channel | Online | 5.5% |
| CAGR 2026-2035 - Market by End Use | Manufacturing | 5.7% |
| Market Share by Country 2025 | USA | XX% |
The demand for rugged tablet market is primarily being driven by the defence and security sector across the world. The security forces are increasing their investment in smart devices as they are suitable for usage in extreme conditions. The threat of global terrorism and difficult cross-border relations is leading to the increase in defence expenditures of the security forces. The resistance to vibrations, shock, temperature changes, and water is attracting this expenditure towards rugged tablets. North America is expected to be one of the leading regions for the rugged tablet industry. This is because of presence of major players and high defence expenditure of United States. Asia Pacific is also expecting a significant growth because of the upgradation of security forces by nations like China and India.
Read more about this report - REQUEST FREE SAMPLE COPY IN PDF
Rugged tablets refer to the handheld devices which are particularly deigned for operating in diverse environment conditions. They are designed with reinforced skins, waterproof case and harden glass for screen. These smart devices have high mobility better internet connectivity, display, stronger body with extended battery life.
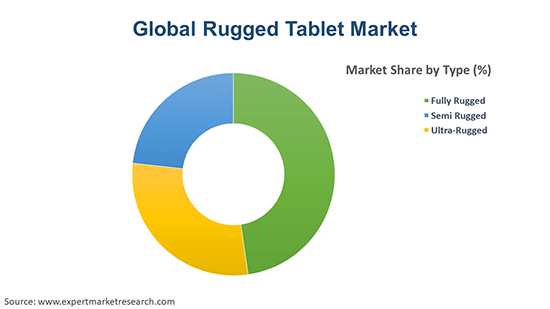
On the basis of type, rugged tablet market is segmented into:
On the basis of operating system, rugged tablets are classified into:
The rugged tablets have following distribution channels:
The end use segments of rugged tablet market are the following:
Market Breakup by Region:
| CAGR 2026-2035 - Market by | Distribution Channel |
| Online | 5.5% |
| Offline | XX% |
| CAGR 2026-2035 - Market by | End Use |
| Manufacturing | 5.7% |
| Construction | 5.4% |
| Oil and Gas | XX% |
| Retail | XX% |
| Government | XX% |
| Others | XX% |
| CAGR 2026-2035 - Market by | Region |
| Asia Pacific | 6.0% |
| North America | 4.8% |
| Europe | XX% |
| Latin America | XX% |
| Middle East and Africa | XX% |
The technological advancements such as progress of secure networks in wireless and mobile broadbands is aiding the growth of the rugged tablet market. The adoption of rugged tablets with new developed applications is helping the fire brigades, police force, and military systems. The innovations like introduction of bulletproof tablets are augmenting the industry growth. The continued investment in research and development will further improve the market demand by providing new features like fingerprint verification and longer battery life. The high cost of procurement can hinder the market growth. The technological progress is improving the cost effectiveness of rugged tablets and will lead to further growth of the market.


| CAGR 2026-2035 - Market by | Country |
| India | 6.6% |
| China | 5.7% |
| Canada | 5.4% |
| Japan | 5.1% |
| Australia | 5.1% |
| USA | 4.7% |
| UK | XX% |
| Germany | XX% |
| France | XX% |
| Italy | XX% |
The report gives a detailed analysis of the following key players in the rugged tablet market, covering their competitive landscape, capacity, and latest developments like mergers, acquisitions, and investments, expansions of capacity, and plant turnarounds:
The comprehensive EMR report provides an in-depth assessment of the market based on the Porter's five forces model along with giving a SWOT analysis.
Upto 15% Off
USD
$2499 $2249
$3999 $3599
$4999 $4249
$5999 $5099


*While we strive to always give you current and accurate information, the numbers depicted on the website are indicative and may differ from the actual numbers in the main report. At Expert Market Research, we aim to bring you the latest insights and trends in the market. Using our analyses and forecasts, stakeholders can understand the market dynamics, navigate challenges, and capitalize on opportunities to make data-driven strategic decisions.*
The global rugged tablet market is projected to grow at a CAGR of 5.00% between 2026 and 2035.
The major industry drivers include rising population, rising urbanisation, technological advancements such as progress of secure networks in wireless and mobile broadbands.
The key trends in the market are technological progress and increasing demand from security forces for smart defense solutions.
The major regions in the industry are North America, Latin America, the Middle East and Africa, Europe, and the Asia Pacific.
Fully rugged is the dominant type in the industry.
The operational systems can be divided into windows, iOS, and android, among others.
The distribution channels can be divided into online and offline.
The end-use sectors include oil and gas, retail, construction, education, government, food and beverage, manufacturing, healthcare, transportation, logistics, among others.
The major players in the industry are AAEON Technology Inc, Dell Inc., HP Development Company, L.P., Getac Corporation, Panasonic Corporation, and Mildef Group AB, among others.
Explore our key highlights of the report and gain a concise overview of key findings, trends, and actionable insights that will empower your strategic decisions.
| REPORT FEATURES | DETAILS |
| Base Year | 2025 |
| Historical Period | 2019-2025 |
| Forecast Period | 2026-2035 |
| Scope of the Report |
Historical and Forecast Trends, Industry Drivers and Constraints, Historical and Forecast Market Analysis by Segment:
|
| Breakup by Type |
|
| Breakup by Operational System |
|
| Breakup by Distribution Channel |
|
| Breakup by End Use |
|
| Breakup by Region |
|
| Market Dynamics |
|
| Competitive Landscape |
|
| Companies Covered |
|
| Report Price and Purchase Option | Explore our purchase options that are best suited to your resources and industry needs. |
| Delivery Format | Delivered as an attached PDF and Excel through email, with an option of receiving an editable PPT, according to the purchase option. |
Datasheet
One User
USD 2,499
USD 2,249
tax inclusive*
Single User License
One User
USD 3,999
USD 3,599
tax inclusive*
Five User License
Five User
USD 4,999
USD 4,249
tax inclusive*
Corporate License
Unlimited Users
USD 5,999
USD 5,099
tax inclusive*
*Please note that the prices mentioned below are starting prices for each bundle type. Kindly contact our team for further details.*
Flash Bundle
Small Business Bundle
Growth Bundle
Enterprise Bundle
*Please note that the prices mentioned below are starting prices for each bundle type. Kindly contact our team for further details.*
Flash Bundle
Number of Reports: 3
20%
tax inclusive*
Small Business Bundle
Number of Reports: 5
25%
tax inclusive*
Growth Bundle
Number of Reports: 8
30%
tax inclusive*
Enterprise Bundle
Number of Reports: 10
35%
tax inclusive*
How To Order

Select License Type
Choose the right license for your needs and access rights.

Click on ‘Buy Now’
Add the report to your cart with one click and proceed to register.

Select Mode of Payment
Choose a payment option for a secure checkout. You will be redirected accordingly.
Strategic Solutions for Informed Decision-Making
Gain insights to stay ahead and seize opportunities.

Get insights & trends for a competitive edge.

Track prices with detailed trend reports.

Analyse trade data for supply chain insights.

Leverage cost reports for smart savings

Enhance supply chain with partnerships.

Connect For More Information
Our expert team of analysts will offer full support and resolve any queries regarding the report, before and after the purchase.
Our expert team of analysts will offer full support and resolve any queries regarding the report, before and after the purchase.
We employ meticulous research methods, blending advanced analytics and expert insights to deliver accurate, actionable industry intelligence, staying ahead of competitors.
Our skilled analysts offer unparalleled competitive advantage with detailed insights on current and emerging markets, ensuring your strategic edge.
We offer an in-depth yet simplified presentation of industry insights and analysis to meet your specific requirements effectively.


